Introduction
The number of patients researching their health conditions online has increased dramatically over the last decade.Reference Rutten, Squiers and Hesse 1 Up to 80 per cent of internet users have searched for health-related information, and video-sharing websites are increasingly being utilised to this end.Reference Atkinson, Saperstein and Pleis 2 , 3 YouTube, the largest and best known of these video-sharing websites, is the third most popular website in the world. 4 Its users view over four billion videos every day and upload over 1 hour of video every second. 5 Many users, both lay and professional, upload and share health-related content. Over time, the website has built up a large repository of medically related material providing advice and information on a huge variety of topics, ranging from methotrexate self-injection to dialysis and bowel preparation for colonoscopy.Reference Rittberg, Dissanayake and Katz 6 – Reference Basch, Hillyer, Reeves and Basch 8
The success of YouTube as a medium for disseminating health information can in part be attributed to the fact that any individual may publish a video, regardless of their background, qualifications or intentions. However, this freedom, and the minimal guidelines surrounding the publication of material on YouTube, has led to the quality of health information within these videos varying dramatically and concerns being raised regarding their potential to cause harm. 9 – Reference Lau, Gabarron, Fernandez-Luque and Armayones 11
Many studies have sought to evaluate the content of YouTube videos relating to specific health conditions or procedures.Reference Madathil, Rivera-Rodriguez, Greenstein and Gramopadhye 12 Only four studies to date have looked at otolaryngology-related topics; these have focused on: teaching the Epley manoeuvre, paediatric tonsillectomy, rhinosinusitis, and adenotonsillectomy and ear tube surgery.Reference Biggs, Bird, Harries and Salib 13 – Reference Sorensen, Pusz and Brietzke 16 None thus far have examined videos relating to one of the commonest conditions in otolaryngology: epistaxis.
Epistaxis is extremely common, with up to 60 per cent of the general population experiencing at least one episode in their lifetime.Reference Petruson and Rudin 17 Most episodes are uncomplicated, and fewer than 10 per cent of sufferers require medical attention given the success of timely and appropriate conservative measures.Reference Villwock and Jones 18 Official guidelines for the conservative management of epistaxis do not exist; first aid advice from the National Institute for Health and Care Excellence (NICE) is based on expert opinion and review articles.Reference Pashen and Stevens 19 , Reference Pope and Hobbs 20
This study aimed to identify and assess the accuracy and quality of YouTube videos that patients and caregivers are likely to encounter when searching for information on epistaxis treatment, in line with best-evidence guidance. This will provide clinicians with an appreciation of the narratives that patients are exposed to when searching YouTube for epistaxis treatment advice, and aid them in directing patients and caregivers to reliable sources of information. To the best of the authors' knowledge, this study represents the first of its kind in relation to epistaxis.
Materials and methods
On 21 March 2015, a search was performed on YouTube.com using the phrase ‘how to stop a nosebleed’, with default settings. The results were automatically filtered by ‘relevance’; no further filtering was applied.
The first 50 videos were screened for their suitability for analysis. Exclusion criteria were: duplication of the video within the first 50 results, in which case the highest ranked video was considered to the exclusion of the duplicate; and the video content being in a non-English language. Descriptive data points collected included: number of video views, number of subscribers to the publisher's YouTube channel, number of video ‘likes’ and ‘dislikes’, and number of comments. Videos were also categorised by publishing organisation identity.
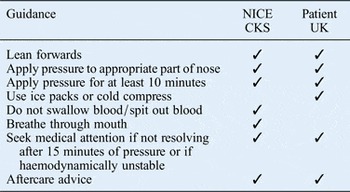
A list of first aid guidance points covering the conservative management of epistaxis was collated based on advice found on the NICE Clinical Knowledge Summaries 21 and Patient UK 22 websites. These represent best-evidence guidelines on the primary care management of epistaxis and advice on when it is appropriate to seek secondary medical attention (Table I).
Guidance used to determine advice score and its presence in NICE CKS and Patient UK websites
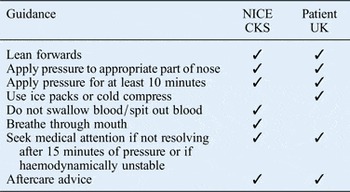
NICE CKS = National Institute for Health and Care Excellence Clinical Knowledge Summaries
All videos were watched independently by two raters. An objective advice score was attributed to each video based on the presence or absence of the specific guidance points within the video as listed in Table I. The maximum score for each video was 8. Inter-rater scoring was examined; in cases of differing advice scores, the videos were re-watched by both raters and re-scoring was settled by discussion.
A subjective production quality score was also allocated to each video by both raters independently. Scores ranged from 1 to 3. A score of 1 signified a video with a subjectively low production value; it may have been filmed on a mobile phone camera, be unedited, or represent a low-quality animated slide show of text. A score of 3 signified a video with a subjectively high production value; it may include high-quality graphics and animations, have been shot in high definition, and may be narrated by a presenter on a set. A video with a score of 2 falls in between these two categories in terms of subjectively perceived production value.
Data were collected using Microsoft Excel® and statistical analysis was performed using IBM's SPSS® program. Correlations between video rank in the results list, descriptive data points (described above), advice score and production value score were examined using Spearman's rank test. P values were derived using two-tailed analyses; values of less than 0.05 were considered significant. Inter-rater reliability of production value scores was assessed using Cohen's kappa. The mean production value score of each video was included in the correlation analysis using Spearman's rank.
Results
The first 50 videos were screened for their suitability for analysis. Five videos were excluded from analysis; four were repetitions of videos that appeared higher up the results ranking and one video was narrated in Spanish. Forty-five videos were thus analysed.
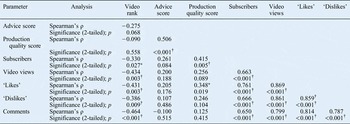
Descriptive data were collated and analysed (Table II). A large range in the number of views and degree of user interactivity with the videos was apparent. Strong negative correlations were observed between a video's rank in the results page and: the number of views it received, the number of publisher's channel subscribers, the number of ‘likes’, the number of ‘dislikes’ and the number of comments it received. These were all found to be statistically significant (Table III).
Descriptive data for all analysed videos

Correlation analysis findings

*p < 0.05; † p < 0.01
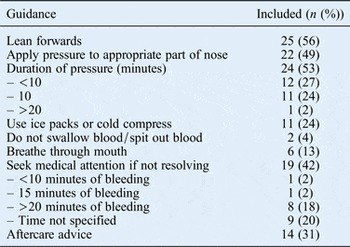
Twenty-five videos (56 per cent) correctly advised leaning forwards during an episode of epistaxis. Fewer videos specifically advised patients to breathe through their mouths (n = 6, 13 per cent), use ice packs (n = 11, 24 per cent) or spit out the blood (n = 2, 4 per cent) (Table IV). Twenty-two videos (49 per cent) correctly described the appropriate part of the nose to apply pressure to and 24 videos (53 per cent) quoted a specific duration of time to apply pressure for. Only 11 of these videos (24 per cent in total) quoted the advised 10 minutes of constant pressure. Twelve videos (27 per cent) recommended pressure for durations of less than 10 minutes, and one video (2 per cent) recommended pressure for more than 20 minutes (Table IV).
Frequency of advice score guidance components in the videos

Nineteen videos (42 per cent) advised seeking medical attention if the episode of epistaxis was not resolving with conservative measures. Only one video (2 per cent) advised that this should be after a maximum of 15 minutes of continuous pressure, in line with the NICE Clinical Knowledge Summaries and Patient UK advice. Eight videos (18 per cent) recommended seeking medical attention only after more than 20 minutes of continuous bleeding and one video (2 per cent) recommended seeking medical attention after only 10 minutes of nasal pressure. Nine of the videos (20 per cent) did not specify after what period of time one should seek medical attention (Table IV).
Fourteen videos (31 per cent) gave appropriate aftercare advice, including avoidance of nose blowing (Table IV). Twenty-one videos (47 per cent) advised inappropriate methods of treating epistaxis.
The mean advice score of the videos was 2.0 out of 8 (range, 0–5). A weakly negative correlation was demonstrated between the video's rank in the results list and its advice score (ρ = −0.28); however, this was not statistically significant (p = 0.068).
The mean production quality score of the videos was 1.6 (range, 1–3). Strong inter-rater scoring reliability was demonstrated (Cohen's Κ = 0.84). A weakly negative correlation between video rank and production quality score was observed (ρ = −0.090); however, this was not statistically significant (p = 0.558). A strongly positive and statistically significant correlation between production quality score and advice score was seen (ρ = 0.51, p < 0.001).
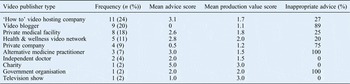
The videos were grouped by publisher type into 10 broad categories, the most populous of which was ‘how to’ video hosting companies (n = 11), commercial entities which publish ‘how to’ videos on a variety of medical and non-medical subjects. Other groups included so-called ‘vloggers’ (video bloggers) (n = 9), private medical facilities (n = 8), health and wellness video networks (n = 5), private companies (n = 4), and alternative medicine practitioners (n = 3).
A British Red Cross video, the only video produced by a charity, displayed the highest advice score of all the videos (score of 5); ‘how to’ video hosting companies displayed the second highest mean advice score (score of 3.1). Videos produced by health and wellness video networks were generally the best produced (mean production score of 2.0). Videos produced by video bloggers had the lowest mean advice score (score of 0), and 89 per cent of these contained inappropriate advice. Three videos produced by alternative medicine practitioners displayed comparatively high advice scores (score of 3.0), but all three contained inappropriate advice (100 per cent) (Table V).
Advice scores, production value scores and proportion of videos providing inappropriate advice grouped by publisher type

Discussion
YouTube contains a large repository of videos relating to the conservative management of epistaxis that are readily available to patients and caregivers. Our study has found that the popularity of a video, using descriptive data points such as video view count, and number of ‘likes’ and comments as surrogate markers, bears no correlation to the quality of the advice it contains. We also found that there was no statistically significant correlation between the quality of a video's content and its rank in the search results, indicating that a video's high rank is no indication of the quality or relevance of its content.
These points are of concern for a number of reasons. Firstly, when researching health topics on the internet, it is a well-known trait of patients that their focus will be directed on the first few results in a search page.Reference Eysenbach and Köhler 23 As such, if YouTube videos are ranked by their entertainment value rather than their factual content, any patient looking for serious and accurate information will be left frustrated and potentially misled by inappropriate advice contained within highly ranked but factually inaccurate videos. Secondly, this fact is of concern to professionals and organisations who wish to upload a high-quality, educational resource for patients; the chance of a new video being buried low down the rankings and not reaching its intended audience because of a lack of exposure is a significant problem.
Measuring the quality of health videos on video hosting websites is an under-developed area. Gabarron et al. described various methods employed by other authors to assess the quality of video content, including expert-based, popularity-based and heuristics-based factors.Reference Gabarron, Fernandez-Luque, Armayones and Lau 24 Our study utilised an expert-based measure of quality, derived from best-evidence guidelines, in order to create an objective advice score. We feel this is a more robust and reliable method of deriving an objective quality scoring system. However, it is limited by its specificity to the subject of epistaxis treatment, and does not take into account other factors that may alter the generic advice usually given to patients (e.g. significant medical co-morbidities such as haemophilia and other clotting disorders).
Using such a scoring system, we found that the quality of advice within the videos varied greatly. The mean advice score of the videos was poor (score of 2.0). Only 11 videos (24 per cent) identified the need to provide constant pressure for at least 10 minutes, in line with NICE and Patient UK advice, whilst 12 videos (27 per cent) recommended pressure for shorter durations. There is little evidence to guide these recommendations on the necessary duration of pressure. As such, the range of durations quoted in the videos represents a cross-section of public and professional opinion on the sufficient duration of pressure. Whilst durations of pressure for less than 5 minutes may be sufficient to stem a minor attack of epistaxis, it is unlikely to be of benefit when dealing with posterior bleeding. Similarly, with advice stating the need to apply pressure for more than 20 minutes, if a patient was suffering from a large posterior bleed and followed this advice, there is a risk of them losing a significant volume of blood before seeking medical attention.
Nineteen videos (42 per cent) recommended seeking medical attention if the bleeding did not respond to conservative measures; however, the majority of these (n = 9, 20 per cent total) did not specify after what period of time one should make this decision. One video recommended seeking medical attention after less than 10 minutes of using conservative measures. One could argue that this may lead to inappropriate secondary medical referrals if the patient is suffering from only minor epistaxis. However, this advice may be appropriate if the patient is suffering a significant bleed, has a concomitant clotting disorder or is haemodynamically unstable.
Nearly half of the videos (n = 21, 47 per cent) contained advice that the authors deemed inappropriate. Such advice included self-administered packing of the nose with tissue, gauze and even tampons. Other worrying advice from a pharmacist included rubbing black pepper onto the septum. An acupressurist recommended tying an elastic band around one's little finger until the bleeding stops, whilst an Ayurvedic medicine practitioner recommended holding a raw onion under the nose during an attack. A Medline literature review was undertaken, but the authors were unable to find any evidence to support the efficacy of these claims. Worryingly, this inappropriate advice was intermingled with other more appropriate advice in some relatively high production quality videos. As such, some patients may be unable to distinguish between evidence-based and alternative medicine practices, and risk wasting time, and blood, on pseudo-scientific methods during an episode of epistaxis.
Our study, like that of Sorensen et al., demonstrated that testimonial-style videos produced by video bloggers or lay persons were the least reliable and contained the least accurate information.Reference Sorensen, Pusz and Brietzke 16 However, we could not establish a correlation between production quality and video rank. This suggests that the situation may be more complicated than the ‘judging a book by its cover’ effect Sorensen et al. propose, and that other more complex factors may be involved in the ranking of videos on YouTube.
-
• Video hosting websites including YouTube.com are increasingly being used to disseminate health information
-
• No published papers to date have objectively analysed YouTube video advice on conservative epistaxis management
-
• The quality of information on conservative epistaxis management in YouTube videos is extremely variable
-
• There were no correlations between video information quality and: search result rank, popularity or production quality
-
• Many highly ranked videos suggest inappropriate and dangerous ‘alternative’ advice on epistaxis management for which there is no evidence
-
• We do not recommend YouTube as a source of patient information on epistaxis management
Studies of this type are not without limitations. As no prior research has defined the search terms that are used by patients to search for information on epistaxis treatment, our literal search term ‘how to stop a nosebleed’ may not be an accurate reflection of the actual spectrum of videos patients would be exposed to if employing other terms. The dynamic nature of YouTube's video library and the unknown methods by which video results are ranked means that our study provides only a snapshot in time of epistaxis treatment advice videos. As the rank and presence of videos may change on a daily basis, it is hard to draw conclusions regarding the evolving state of health information videos on YouTube without long-term follow up, a topic which has been neglected in the literature thus far.
YouTube videos on the subject of epistaxis treatment vary greatly in quality. Whilst helpful videos do exist, the majority are of poor educational value and production quality, and many contain inaccurate and potentially dangerous advice. Armed with this knowledge, we would advise that medical practitioners do not recommend YouTube as a reliable source of information on the topic of epistaxis treatment.