


INTRODUCTION
One remnant of the colonial era is its language legacy, with a large majority of postcolonial countries retaining English, French, Portuguese, and Spanish as their official languages, and relying on these languages for education and administration.Footnote 1 These languages tend not to be the native language of any indigenous group and are typically distant from the languages spoken by the local population.Footnote 2 With a distant language serving as a gatekeeper allocating education, jobs, political participation, and self-esteem, we explore the consequences of language choice for the economic and human development of postcolonial states.
It is widely acknowledged that language is central to the organization of human society and interpersonal relations. Without this method of communication, no leader could command the resources necessary for an inclusive political system extending beyond family and neighborhood (Weinstein Reference Weinstein1983). The choice of language influences human capital, as it provides those who speak the official language of the state with greater access to economic and political opportunities.
In order to conceptualize the notion of “distant languages,” we employ the measure of structural distance between languages based on Ethnologue’s (Lewis, Simon, and Fennig Reference Lewis, Simon and Fennig2014) language trees. Ours is a weighted measure that calculates the average distance and exposure of the local population’s languages from the official language. The theoretical framework advances two channels through which the choice of official language affects socioeconomic development: the distance from, and the exposure to the official language.Footnote 3 More specifically, we assume that increasing distance and lower exposure results in increasing learning costs and consequently reduces the level of human capital in society. Similarly the use of a distant language increases the cost of acquiring and processing pertinent health information, and acts as a barrier to fostering desirable health behavior, as well as affecting access and quality of health care provided. These differences in physical and mental human capital in turn translate into differences in productivity and wealth.
We demonstrate that the constructed measure of language distance and exposure, in line with our theory, is a statistically significant and economically meaningful correlate of proxies for human capital, health, income, and productivity.Footnote 4 The pattern of lower distance to the official language, implying higher country wealth and human development, holds both within and across continents.
To better understand the relationship we examine the motivations underlying choice of official language in sub-Saharan Africa, and provide evidence that the language policy observed today is almost indistinguishable from the one during the colonial period, and hence does not reflect active choices made by the political elite. By studying factors affecting official language choice, we find that it is not past wealth or development levels but in fact possessing a writing tradition that is a key explanatory factor. Using distance from the sites of invention of writing as an instrument for our constructed measure, we show that, like the OLS estimates, the instrumental variable estimates are also negative and significant, providing a causal logic linking higher distance from the official language to lower levels of socioeconomic development. The economic magnitude of the estimates is large, and shows that if a country like Zambia were to adopt Mambwe instead of English as its official language, it would move up 44 positions on the HDI ranking and become similar to a country like Paraguay in human development levels.
We next provide empirical support in favor of the two assumptions made under the theoretical framework. Data from the 2005/06 National Family and Health Survey of India (International Institute for Population Sciences (IIPS) and Macro International 2007) provide evidence for the first channel, viz. that individual level distance to the official language affects various socioeconomic outcomes. The data reveal that the distance to the official language of the state in which the individual is resident predicts lower schooling and occupational outcomes. For a Hindi speaker resident in West Bengal, where an Indo-European language Bengali is used, moving to a state using a Dravidian language (e.g., Tamil Nadu) as opposed to moving to another state where an Indo-European language is official (e.g., Uttar Pradesh), would reduce average years of schooling by around one year and decrease the probability of using a mosquito net, of ever having heard about AIDS, or holding a white-collar job by four, nine, and three percentage points, respectively. As the identification strategy accounts for state, language group, and time specific trends through the inclusion of fixed effects, as well as a rich set of other controls, we can be reasonably confident that the effects of language distance are being captured.
Evidence on the importance of the exposure channel is evaluated using data from a set of 11 African countries where English is the medium of instruction. It is shown that exposure to English at home is a significant factor in explaining student performance. Using a model with classroom fixed effects and a rich set of pupil controls at the home level, we find that exposure to English increases the probability of reaching the minimum reading level by around ten percentage points; and Math scores increase by around one-fifth of a standard deviation.
The article highlights the importance of both the distance from and exposure to the official language in determining health and human capital outcomes, and consequently growth and development of nation states. Future research is needed to understand the relative importance of each channel and how they interact to develop effective policy responses to the problem of inefficient language choice in postcolonial states.
THE CROSS-COUNTRY FRAMEWORK
One institutional factor distinguishing “developed” from many “developing” nations today is their official language. The official language in developed nations is typically one which is spoken and used widely by a majority of the population. To be sure, at the time when the official languages of today’s developed states were chosen, they were not universally understood, even in countries as linguistically homogeneous today as France (Weber Reference Weber1976) or Japan (Laitin Reference Laitin1992, 14), but in those countries, there was a core indigenous group fluent in the official language of state. On the other hand, in most developing states today, the official language is often one that is neither indigenous nor spoken by citizens outside of an elite minority.
Sub-Saharan African countries in particular have primarily chosen nonindigenous languages, typically distant from the local language, as official. Relying on current data from Albaugh (Reference Albaugh2014, 237), for those sub-Saharan countries that are in our dataset, an average of only 18.7 percent of the population could speak the official language of the state. This reaches depths of 4.5 percent for Niger and 5 percent for Guinea and Malawi. And these low cases include countries that were ruled directly (Niger) where the colonial language was the medium of rule and those that were ruled indirectly (Malawi) where indigenous languages and cultures were supposedly recognized. To be sure, there is great variation across estimates on what counts as “speaking” the official language of the state. However, we can surmise that these figures would be lower if the criterion were basic literacy in that language. Secondary education, the key to joining the modern sector in Africa, is almost entirely conducted through the media of nonindigenous languages throughout Africa, with possible exceptions of Somalia (before state collapse) and Mauritania (Albaugh Reference Albaugh2014, Appendix A).
The effect of reliance on colonial languages in sub-Saharan Africa, though, a factor highlighted by a small group of educationalists and pedagogues (Alidou et al. Reference Alidou, Boly, Brock-Utne, Diallo, Heugh and Wolff2006), has engendered only a few papers providing systematic quantitative evidence. Eriksson (Reference Eriksson2014) exploits a language policy change in South Africa, and shows that the provision of two extra years of local language instruction, instead of in English or Afrikaans, had a positive effect on wages, the ability to read and write, on educational attainment, and on the ability to speak English. Ramachandran (Reference Ramachandran2012) using a triple difference-in-differences strategy, finds that introduction of mother tongue schooling for the largest ethnic group in Ethiopia in 1994 resulted in increasing the probability of completing primary schooling and the ability to read a complete sentence by 7 and 28 percent, respectively. Taylor and von Fintel (Reference Taylor and von Fintel2016) employ a school fixed-effects model and find that provision of mother tongue instruction in the early grades significantly improves English acquisition, as measured in grades 4, 5, and 6. Laitin, Ramachandran, and Walter (Reference Laitin, Ramachandran and Walter2015) report on a quasirandom introduction of indigenous language medium of instruction in a region of Cameroon. They report that after three years, treated students’ overall scores were double those of control students. In the OECD, Dustmann, Machin, and Schönberg (Reference Dustmann, Machin and Schönberg2010) and Dustmann, Frattini, and Lanzara (Reference Dustmann, Frattini and Lanzara2012) highlight the language repertoires of the students as the single most important factor in explaining differences between immigrant and native children’s school outcomes.Footnote 5 This article seeks to complement the early controlled studies of language media in schools to assess more generally the costs in human development on the national scale of reliance on official languages that are “distant” from the indigenous languages of postcolonial countries.
Data and Country Level Measure of Distance
For a cross-country estimation of the relationship of linguistic distance to economic outcomes, we need an algorithm to determine distance between any two languages and a measurement strategy to calculate average distance for any population of its language to that of the official language. In order to conceptualize the notion of distances between languages, the measure based on Ethnologue’s linguistic tree diagrams is used. The distance between any two languages i and j based on Fearon (Reference Fearon2003) is defined as
 {\fontsize{8}{10}\selectfont{$$\begin{eqnarray*}
&&\hspace*{-5.5pt}d_{ij}=1\nonumber\\
&&\hspace*{-8pt}\quad-\,\bigg (\frac{\text{no. of common nodes between i and j}}{\frac{1}{2}(\text{no}.\text{of nodes for language $i$} + \text{no}. \text{of nodes for language $j$})}\bigg )^{\lambda }.
\end{eqnarray*}$$}}
From Equation (1) we see that if two languages belong to different language families, i.e., the number of common nodes between them is 0, their distance is equal to 1, which by construction is the maximum distance between any two languages. The value of λ determines the relative distance between two languages which belong to the same family compared to two languages that belong to different families. For instance, consider Spanish and Catalan belonging to the Indo-European language family and having seven branches in common.Footnote 6 Choosing a value of λ equal to 0.5 would imply the distance between Spanish and Catalan is equal to 0.116. Choosing a lower λ, such as 0.05, would give greater weight to the similarity in the earlier nodes, and the distance between Spanish and Catalan would fall to 0.012. Of course, if two languages differ at the first node, as would be the case for Spanish and Tamil, whatever the value of λ the distance score would remain at 1. As no theoretical basis has been established for choosing the correct value of λ, following Fearon (2003), we fix the value of λ equal to 0.5 in our analysis.Footnote 7
We can now calculate a weighted measure of average distance of a country’s population from the official language. The official language(s) of the countries included in the regression on Tables 3 and 4 are shown in the Excel file accompanying the Online Appendix. The data on the number and size of linguistic groups in the country comes from the data of Fearon (Reference Fearon2003), which take into account all linguistic groups that form at least 1% of the population share.Footnote 8
The average distance from the official language (ADOL) for any country i is calculated as
 $$\begin{equation}
ADOL_{i} = \sum _{j=1}^{n}P_{ij}d_{jo},
\end{equation}$$
where n are the number of linguistic groups in the country, Pij refers to the population share of group j in country i, and djo refers to the distance of group j from the official language. The coding rules when there is more than one official language depend on whether there is a group associated with an official language in which social and political mobility is possible for monolinguals of that language (e.g., Germans in Switzerland, Afrikaners in South Africa) or whether the group associated with that official language must have proficiency in another official language for full mobility prospects (e.g., Urdu speakers in Pakistan). For the former, language distance equals zero. In the case of the latter, language distance equals one-half the distance between their indigenous language and the less prestigious official language plus one-half the distance between their language and the more prestigious official language.Footnote 9
The constructed measure of ADOL is distinct from indices of linguistic diversity used in the literature (Alesina et al. Reference Alesina, Devleeschauwer, Easterly, Kurlat and Wacziarg2003; Desmet, Weber, and Ortuño-Ortín Reference Desmet, Weber and Ortuño-Ortín2009; Greenberg Reference Greenberg1956); while measures of linguistic diversity are concerned with the level of linguistic heterogeneity within a country, our index measures how distant the official language of a country is from the languages spoken within a country. As the choice of official language is not restricted to a set of indigenous languages, countries that are classified as having low levels of linguistic diversity nonetheless maybe linguistically distant from the official language. To see this, consider countries such as Angola, Burundi, Lesotho, Rwanda, Swaziland, and Zambia; all have a value of linguistic diversity as measured by the Greenberg index of less than 0.005, however their average distance from the official language is at least 0.50, as all use a nonindigenous imperial language as their official one.Footnote 10
The measure of ADOL is closest in spirit to the peripheral index proposed by Desmet, Ortuño Ortín, and Weber (Reference Desmet, Ortuño Ortín and Weber2005). Their index measures the distance of all peripheral groups to the dominant central group, which in their application referred to the largest linguistic group in the country. Here we extend their application where the official language is the language of the largest linguistic group in the country. In our application, ADOL differs from the original application of the peripheral index when the official language is not the language of the largest ethnic group, such as Amharic in Ethiopia, or when a country has adopted a nonindigenous language to act as their official language, as is the case in most postcolonial states in sub-Saharan Africa and South Asia.Footnote 11
Figure 1 shows a color-coded map of the world depicting the average distance from the official language for the sample of countries included in our study. For illustrative purposes, Table 1 also provides the average language distance scores for a selected set of ethnic groups and countries.Footnote 12
World Distribution of Average Distance from Official Language

Distance from Official Language for the Three Largest Ethnic Groups for Selected Countries

Note: According to the coding rules, Afrikaans speakers are treated as if Afrikaans were the only official language; hence their value for distance is zero.
Table 2 in turn shows descriptive statistics for a range for interesting socioeconomic variables for the entire sample, as well as by quartiles of language distance. Strikingly, all variables considered are seen to be monotonic with respect to ADOL.
Socioeconomic Outcomes by Quartiles of Language Distance

Note: In the parentheses are provided the number of observations followed by the standard deviation.
Why does the Distance from the Official Language Matter?
Outlining a clear theoretical mechanism is essential in order to understand through which channels choice of official language affects socioeconomic development. The framework will subsequently guide us in our empirical exercise. It will also enable a theoretically founded interpretation of the results, as sketched below with a formal exposition provided in the Online Appendix. The two main facets of socioeconomic development that our theory links to official language choice are human capital formation and health.
Individuals in our framework are assumed to be utility maximizers and choose the level of human capital and preventive health behavior to maximize their wellbeing. The cost of human capital formation for any individual i is assumed to be a function of their ability, the distance of individual i from the official language of the country, and to the amount of exposure of individual i to the official language.
In our theory, the first assumption is the greater the distance of individual i to the official language, the higher the cost of obtaining human capital and participating in the economy. This first assumption implies that all else equal, a native French speaker would face a lower cost of learning Italian than a native German speaker, as Italian is structurally closer to French than German, and hence obtaining higher human capital. The second assumption states that the greater the exposure to the official language, the lower the costs of obtaining human capital and participation in the economy. The second assumption in turn implies, all else equal, Akan speakers from Ghana would face lower learning and participation costs and obtain higher human capital due to the use of English as the official language in the United States as compared to in Ghana, as their level of exposure to English would be much higher in the United States.Footnote 13
The health behavior of individuals is assumed to be affected through two distinct channels. The first one, directly linked to official language choice, is through language acting as a barrier to health care access or to the comprehension of pertinent health information (Bowen Reference Bowen2001; Djité Reference Djité2008, Chapter 3; Higgins and Norton Reference Higgins and Norton2009; Underwood, Serlemitsos, and Macwangi Reference Underwood, Serlemitsos and Macwangi2007).Footnote 14 Evidence supplied by Translators Without Borders (TWB) provides pertinent information. In a study conducted in Kenya after the outbreak of the Ebola crisis, they were able to gauge the importance of language in comprehending health related information. Randomly sampled rural and urban respondents were first tested on their knowledge regarding channels of Ebola transmission. Before treatment, the average share of correct answers was as low as 8 percent. Subsequently, a random half of the study population was provided information regarding Ebola transmission using posters in Swahili, and the other half using posters in the official language of English. Post-treatment the Swahili-treatment group had on average 92 percent of the answers correct whereas the English-treatment group had only 16 percent of the answers correct.Footnote 15
To be sure, governments can use multilingual messaging to transmit health education to all their citizens. However, it is costly to transmit technical information in languages that have not been standardized, as would happen if those languages had official status. Indeed, much of the primary health care information, especially in Africa, is only available in the official language.Footnote 16 In any event, our claim about the favoring of official language in the health sector is not that it is an absolute impediment to available health care, but that on average, the probability of successful access and treatment is reduced.Footnote 17
The second channel through which language policy affects health behavior is indirect and works through the conduit of human capital. The reasoning being that education matters for the ability of individuals to be able to process and use information regarding best health practices (refer to Dupas (Reference Dupas2011, 435–6) and the citations contained therein for an overview on the complementarities between education and health behavior; also refer to De Walque (Reference De Walque2007 Reference De Walque2009) on the relationship between education, HIV, and preventive sexual behavior in sub-Saharan Africa, and De Walque (Reference De Walque2010) on the relationship between education and smoking behavior).
It is important to note that our measure of ADOL subsumes both the theoretical concepts of distance and exposure to the official language. Referring to the formal exposition in the Online Appendix, the notion of distance from official language is self-evident from Equation (2); for the case of exposure, in the cross-country analysis we attribute the distance of other ethnic groups (i ≠ j) in the country to be a measure of exposure of the ethnic group i to the official language. The intuition here is that the greater the average linguistic distance of all other groups to the official language, the less likely the other groups j ≠ i will be relying on the official language in their everyday lives, and therefore the lower the exposure of members of group i to the official language. As the measure takes into account the distance of all ethnic groups, the concepts of group distance and exposure are both captured by the same measure.
Recent research strongly suggests the independent and joint influence of both measures for health outcomes. A series of recent papers (Aoki and Santiago Reference Aoki and Santiago2015; Bleakley and Chin Reference Bleakley and Chin2004 Reference Bleakley and Chin2008 Reference Bleakley and Chin2010; Clarke and Isphording Reference Clarke and Isphording2015) examines the link between language proficiency of immigrants in the destination country language, i.e., English and education, labor market, and of particular interest to us here, health outcomes in the United States, United Kingdom, and Australia. They all follow the methodology suggested by Bleakley and Chin (Reference Bleakley and Chin2004), which uses the age-at-arrival (a measure of exposure to English) interacted with a non-English-speaking origin country dummy (a measure of distance) to predict English proficiency. The reasoning is based on the “critical period hypothesis” of language acquisition (Lenneberg, Chomsky, and Marx Reference Lenneberg, Chomsky and Marx1967). In other words, young children find it easier than older children or adults to learn languages.
Bleakley and Chin (Reference Bleakley and Chin2010) data allow us to show that the joint effect of exposure and distance to the official language, English, leads to higher rates of disabilities later in life. Our reanalysis of this data (available from authors on request) specifies a dummy outcome variable based on whether an individual reports that he or she suffers from a disability that hampers work. The analysis shows that the coefficient on English proficiency (jointly determined due to exposure and distance to English) reduces the probability that an individual reports such a disability by 6.5 percentage points.Footnote 18 Clarke and Isphording (Reference Clarke and Isphording2015), relying on the same identification strategy (but here using a continuous variable for language distance) with data on immigrants to Australia, also find large effects of our two channels (high exposure and low distance) on physical health.
The main result from these studies is that immigrants from non-English-speaking countries (i.e., with high language distance) who arrive after the age of nine (signifying late exposure to English) have significantly worse health outcomes in later life. These data provide strong empirical support for our theoretical claim on both the individual and the joint effects on health outcomes of linguistic exposure and distance.Footnote 19
The Choice of Proxies for our Dependent Variable
The discussion in the previous section assumes that the choice of official language influences the level of human capital in society by affecting the cost of acquisition. A measure of human capital is thus a natural outcome variable to explore. Since this cannot be measured directly, we need reasonable proxies, and for this we need to address two issues. First, available measures of human capital, such as years of schooling or enrollment rates, mostly capture quantity and not quality, which obscures the variation in the levels of learning that students at the same grade level exhibit across countries. The problem becomes especially pronounced as enrollment levels and years of schooling have sharply risen in developing countries over the past decades, but learning outcomes have either stagnated or even worsened. For instance, in some countries in sub-Saharan Africa, up to 40 percent of young people who have attended primary school for five years have neither the essential skills to avoid lapsing into illiteracy, nor the minimal qualifications to secure a job (UNECOSOC 2011). Similarly the latest available round of Demographic and Health Survey (DHS) data from 35 sub-Saharan African countries shows that 33 percent of the males recorded as having between four and seven years of schooling are still unable to read a complete sentence. This implies that available quantitative measures of human capital might be a poor indicator of actual stock of knowledge, especially for developing countries.
A second issue relates to the time it takes to translate values on average distance to observable changes in levels of human capital. If language choices for postcolonial states were made post–World War II, it might take two generations for the effects of this choice to affect standard outcome variables in a significant way such as output per worker.
Our proposed solution to these problems is to use four distinct measures, each with different advantages, and to show that our results are robust across these different measures, allowing us to combine them for general analysis. For our most direct measure, one that captures the actual level of knowledge (or human capital), we rely on test scores from comparable student achievement tests across countries.Footnote 20 Using such a measure however comes at a potential cost. These internationally comparable test scores are available only for 70 countries, and these include only six from sub-Saharan Africa.
As an indirect measure of human capital, here working through the channel of health, we measure life expectancy. As just discussed, we assume that populations with high rates of human capital, controlling for country wealth, are better able to take advantage of modern health resources and communicate successfully with medical staff, thereby improving diagnoses and implementation of remedies. These differences in knowledge (based on test scores) and life expectancy ultimately (albeit slowly) translate into differences in levels of wealth and productivity, as captured by GDP per capita and output per worker, our third and fourth proxies, and both (rather noisy) economic variables that should also be affected by average language distance. Indeed, the down side of using a purely income based measure such as GDP per capita is that it fails to account for the fact that certain countries that are rich in natural resources concentrate income in the hands of a few individuals. Consequently, for such countries, GDP per capita is a poor indicator of the true state of development for the majority of the population. Figure 2 shows a strong negative relation between ADOL and the four dependent variable of interests.
Scatter plot of ADOL and the Four Socio-Economic Variables of Interest

As noted, none of these four proxies is perfect. Given this lack of a perfect composite measure of socioeconomic development we undertake the approach of first presenting our basic regressions with each of the above four dependent variables: a measure of cognitive skills, life expectancy, log GDP per capita and log output per worker. After presenting our initial results in support of our thematic framework, we then adopt the strategy of using the standardized score on the Human Development Index (zHDI) as our preferred dependent variable. This index includes health, education, and wealth measures, and is strongly correlated with the four component measures.Footnote 21 The rationale of using zHDI as the dependent variable, for robustness exercises and further empirical analysis, is based on the fact that not only does it capture all four dimensions outlined by our theory, albeit imperfectly, but also avoids losing valuable observations.
Cross Country Regressions
In order to explore the correlation between the dependent variables of interest and ADOL, we estimate a reduced form regression that takes the form
 $$\begin{equation}
DV_{i} = \alpha *ADOL_{i}+B*X_{i}+\epsilon _{i},
\end{equation}$$
where in all specifications we estimate robust standard errors. The results are shown in Table 3, where the DVi in columns (1) and (2) is a measure of cognitive skills taken from the work of Hanushek and Woessmann (Reference Hanushek and Woessmann2012). Columns (3) and (4) in turn use life expectancy in 2010 as the dependent variable to explore the effect of ADOL on health. Columns (5) and (6) consider log GDP per capita in 2005 in 2005 constant dollars and finally columns (7) and (8) use log output per worker from the work of Hall and Jones (Reference Hall and Jones1999) as a measure of productivity.
Regressions of Distance on Cognitive Scores, Life Expectancy, Log GDP per Capita, and Log Output per Worker

Notes: **p < 0.10; **p < 0.05; ***p < 0.01. Robust SE’s in parentheses and standardized coefficients in square brackets.
Xi refers to a vector of controls and in all eight specifications shown in Table 3; besides our measure of ADOL, we control for three additional confounding factors. First, we control for ethnolinguistic fractionalization (ELF), a measure that takes into account linguistic distance between all ethnic group dyads, and based on Fearon (Reference Fearon2003). The concepts of ELF and ADOL, as explained in the section on data and country level measures of distance, are distinct; however, empirically the correlation between the two measures is 0.57 and thus it is important to account for it in a multivariate framework. The choice of the measure of ELF is inspired by the work of Desmet, Weber, and Ortuño-Ortín (Reference Desmet, Weber and Ortuño-Ortín2009) who show that accounting for distance between groups in diversity measures is important, though once distance is accounted for the choice between the exact nature of the index used—diversity, peripheral heterogeneity, or polarization—is empirically irrelevant.Footnote 22
Second, we include a measure of institutional quality from the Polity-IV data set, quantifying the extent of institutionalized constraints on the decision-making power of chief executives averaged over the years 1960 to 2000.Footnote 23 As we are interested in understanding the effects of language policy choices on socioeconomic development, the third control we include is the level of log GDP per capita in the year of independence, i.e., before official language choices were instituted and hence account for the previous level of development which were largely unrelated to contemporary language policy choices.Footnote 24
Columns (2), (4), (6), and (8) additionally include continent dummies. The inclusion of continent dummies implies that the coefficient on ADOL is being estimated based on the difference in language distances between countries within a continent, and the dependent variable of interest. On the one hand, the inclusion of continent dummies ensures that the effect we are capturing is not being driven by the black box of across continental differences. On the other hand, if our objective is to explain what makes countries in any continent distinct, the inclusion of continent fixed effects by definition will imply that these differences, if they are correlated with the independent variable of interest, are relegated to the black box of fixed effects. As we later contend (in the section on the instrumental variable approach) that geography is a key factor affecting language policy choices, they are consequently correlated with continents. For this reason, the inclusion of continent dummies absorbs a large part of the effect of language distance, though there remains much variance to be explained.
For the dependent variable life expectancy we additionally control for the percentage of people ages 15–49 who are infected with HIV, to ensure that our estimates are not only capturing differences in HIV prevalence rates. For log GDP per capita we control for the availability of natural resources, namely percent of world oil, gold, iron, and zinc reserves, and number of minerals present in a country.Footnote 25
In all eight specifications ADOL is seen to be both substantively and statistically an important correlate of the four dependent variables. To have an intuitive understanding of the magnitude of the effect imagine a country such as Ghana switching from using English to Akan, the language of the largest ethnic cluster, as their official language. This reduces the ADOL from 1 to 0.18, and moves Ghana up 13 and 11 spots in terms of their ranking on cognitive tests scores and life expectancy, respectively, and 21 ranks up in the case of log output per worker.
Table 4 in turn considers the standardized value of the HDI in 2010, a composite measure of the facets of socioeconomic development outlined by our theory, as the dependent variable. ADOL by itself explains around 55% of the cross-country variation in the HDI, and together with all controls 76% of the cross-country variation in the levels of HDI are accounted for in the regression. The largest drop in the coefficient occurs between columns (4) and (5) when we include continent dummies.
Regressions of Distance on zHDI

Notes: *p < 0.10; **p < 0.05; ***p < 0.01. Robust SE’s in parentheses and standardized coefficients in square brackets.
Finally, Table 5 shows that the correlation documented between ADOL and HDI in Table 4 cannot be attributed to any particular region of the world. Columns (2)–(6) in Table 5 drop Africa, the Americas, Asia, Europe, and Oceania, respectively, and the coefficient on average distance remains, both substantively and statistically, an important correlate of HDI.
Regressions of Distance on zHDI Excluding One Continent at a Time

Notes: Column (1) considers the entire sample; columns (2)–(6) drop Africa, Americas, Asia, Europe, and Oceania, respectively. *p < 0.10; **p < 0.05; ***p < 0.01. Robust SE’s in parentheses and standardized coefficients in square brackets.
Theoretically Inspired Controls and Some Robustness Checks
We now explore other potentially important factors that have been highlighted in the literature as important in explaining cross-country income differences to evaluate the robustness of our results.
Taking into account new insights on deep historical sources of economic performance (Ashraf and Galor Reference Ashraf and Galor2013; Bockstette, Chanda, and Putterman Reference Bockstette, Chanda and Putterman2002; Michalopoulos and Papaioannou Reference Michalopoulos and Papaioannou2013; Nunn Reference Nunn2009), we add a measure of genetic diversity, genetic diversity squared, and the index of state antiquity to the specification given by column (5) of Table 4. The results are shown in column (2) of Table 6. The addition of these controls does not affect the precision or magnitude of the coefficient on average distance.
Robustness Tests of Regressions of Distance on Standardized Value of HDI

Notes: *p < 0.10; **p < 0.05; ***p < 0.01. Robust SE’s in parentheses and standardized coefficients in square brackets.
The historical origin of a country’s laws has been shown to be correlated to a broad range of economic outcomes (Shleifer, Lopez-de Silanes, and La Porta Reference Shleifer, Lopez-de Silanes and La Porta2008). In column (3) of Table 6 we additionally control for the legal origin of the countries. As can be seen this control does not affect the precision or magnitude of our estimates.
The data on GDP at independence is measured in a common denominator, i.e., at constant 1990 prices, for all countries in our sample. However, given the date of independence between countries varies widely, the same income levels in different eras might imply a different stage of development. Alternatively, the timing of independence itself may contain information on a country’s wealth. In order to address this concern of comparability across eras, we consider only the sample of countries that gained independence after 1945 and re-estimate Equation (3) for all five dependent variables of interest. The results in Table 7 show that ADOL is still statistically significant and an economically meaningful predictor of the socioeconomic variables considered.Footnote 26
Regressions of Distance on Cognitive Scores, Life Expectancy, Log GDP per Capita, Log Output per Worker, and zHDI in 2010—Sample of Countries Independent Post-1945

Notes: The dependent variables in columns (1)–(5) are cognitive scores, life expectancy in 2010, log GDP per capita in 2005, log output per worker from the work, and zHDI in 2010, respectively. *p < 0.10; **p < 0.05; ***p < 0.01. Robust SE’s in parentheses and standardized coefficients in square brackets.
We need also to ask how robust our findings are to contemporary changes in the international political economy, from an era of import substitution growth models (where there may have been an advantage to the promotion of indigenous languages) to an era of globalization (where the premium on English would be revealed) (Rodrik Reference Rodrik1990). Perhaps our results supporting the role of languages that are proximate to that of the local populations were appropriate for the first era, but not for the second? We examine this possibility in column (3) of Table 8, by replacing GDP at independence with zHDI in 1990, and find that the effect remains significant both statistically and substantively in the 1990–2010 period. Globalization, in other words, has not lessened the importance of average distance for human development.
Regressions of Distance on Standardized Value of HDI in 1990 and 2010

Notes: In column (1) and (3) the dependent variable is zHDI in 2010; in column (2) it is zHDI in 1990. *p < 0.10; **p < 0.05; ***p < 0.01. Robust SE’s in parentheses and standardized coefficients in square brackets.
In the Online Appendix we conduct a series of robustness tests and show the correlation is robust to additional controls for geography, climate, and alternative measures of ELF and institutions.
Methodological Concerns
Omitted variable Bias
The cross-country framework raises important methodological concerns regarding reverse causality and omitted variable bias (OVB). To quantitatively examine the problem of omitted variable bias we use the test suggested by Oster (Reference Oster2013), which builds upon the methodology of Altonji, Todd, and Taber (Reference Altonji, Todd and Taber2005) that selection on observables can be used to assess the potential bias from unobservables. The results of the test suggest that the power of the unobservables would have to be about 2.5–10 times stronger relative to the observables, which seems highly unlikely given we explain 75 percent of the cross-country variation in zHDI. The methodological details and results are provided in the Online Appendix.
Notwithstanding the quantitative estimate of the extent of OVB, the concern remains that it is not language policy choices, but some other underlying unobservable characteristics that affect both language choices and the socioeconomic outcomes. If that were the case, language policy choices would be endogenous in our setting. In this regard, at least with respect to sub-Saharan Africa, there is good reason to believe that the observed language policy choices strongly mirror the language choices observed during the colonial era, and are hence exogenous.Footnote 27
The objectives of the education policy of the French and British colonialists were identical—train a few elites through the use of the colonial language to help administer the country, and ensure that the masses were docile and controlled through restricting access to secondary and higher education (Bokamba Reference Bokamba1984; Fabunmi Reference Fabunmi2009; Whitehead Reference Whitehead2005). The British and French, however, undertook differing paths to achieve their objectives. In the case of France, a French-only language policy was instituted right from the start of primary schooling, whereas the British adopted a more laissez faire policy and allowed the use of local languages for the initial one to three years of primary schooling.Footnote 28 The fact that less than 3 percent of the population in sub-Saharan Africa was enrolled in secondary education or higher in 1960 highlights that the policy objective of restricting access to higher education was successfully achieved in both the former British and French colonies.Footnote 29
In line with the colonial-era policy, up until 1990, only two former French colonies—Madagascar and Guinea—changed their language policies from colonial times. All others continued with a policy of using only French for all levels of education. On the other hand, the former British colonies also continued with the colonial-era policy of using multiple local languages for a duration of one to three years in primary schooling before switching to the use of English.Footnote 30
Albaugh (Reference Albaugh2014) makes a compelling case for why language policy in general, and in education in particular, was characterized by policy inertia. Drawing on the works of Tilly and Ardant (Reference Tilly and Ardant1975) and Herbst (Reference Herbst2000), she argues that in an environment of low external threat due to stable borders, and income taxation rendered relatively unnecessary due to foreign aid and taxes on primary commodities, African leaders did not have to engage in language planning and rationalization for state building.Footnote 31 The nature of incentives, compared to those that faced European state builders, implied that African leaders did not have to engage in the spread of a standard language to project power and retained the language policy they inherited from their colonial predecessors. Leaders in the face of public pressure to increase access to schooling predictably decided to invest in education to pacify the population, though with little or no interest in actual outcomes. The main challenge to their power came from internal rather than external threats, and therefore patronage was a common resort to maintain power.Footnote 32 These internal competitors in turn were concerned with their share of spoils rather than language rights (Cooper Reference Cooper2008). The strongest indication of the continued colonial influence on language policy in sub-Saharan Africa is that not a single nation in the past 60 years has ever used an indigenous language for secondary or higher education. The available evidence on student outcomes suggests that the language policy today has been as effective as in colonial times in restricting access to a small section of the population and ensuring continuous replenishment in the ranks of the elite, while still separating it from the masses.Footnote 33
The above discussion lends weight to the assertion that language policy choices in sub-Saharan Africa reflect choices made during the colonial era. However, one concern that remains is that perhaps countries become independent with entrenched elites having an interest in perpetuating the inefficient policies of the colonial state. For example, consider policies affecting exchange rates (Bates Reference Bates1981) or political boundaries (Michalopoulos and Papaioannou Reference Michalopoulos and Papaioannou2011), that while inefficient, helped perpetuate the rule of postindependence leaders. From this perspective, the causal variable would be entrenched elite interests rather than any particular policy. In Table A10 of the Online Appendix, we rely on the Archigos dataset and use leader duration since independence for all countries as a proxy for entrenched elites.Footnote 34 Including leader duration (or duration squared) in our standard regression does not affect the coefficient on ADOL, and we thereby gain confidence that the channel of language policy, over and above the general interests of entrenched elites, is an important factor affecting cross-country development.
Reverse Causality
Reverse causality is less troublesome. The measure of language distance is time invariant, to the extent the composition of ethnic groups remains constant at the country level and language policy choices do not change, and hence are not affected by the levels of socioeconomic development directly. The concern regarding endogeneity might still arise as poorer countries plausibly choose more distant language policies, while rich states are able to assimilate minorities thereby reducing average distance. If this is the complete story, all we are observing in our regressions are secondary consequences of weak and poor states vs. strong and rich ones.
Does income determine language choice? In order to answer this, we control for the level of GDP per capita at the time of independence of countries since language policy choices were instituted at the time of independence. Hence if it is difference in income levels rather than language policy choices that is the underlying cause, inclusion of GDP per capita at independence should reduce the magnitude and significance of our coefficient. However as can be seen in column (4) of Table 4, controlling for initial income does not affect the precision and magnitude of the coefficient on average distance.Footnote 35
An Instrumental Variable Approach
To provide evidence that the documented relationship between ADOL and socioeconomic development is indeed causal, we now undertake a strategy of using an instrument that is correlated with ADOL but uncorrelated with other country characteristics.
We identify the availability of a written tradition as one of the important factors affecting language policy choices. The rationale is that in the absence of a written language states first need to invest in creating a standardized orthography, vocabulary, and modern scientific terminology before a language can be utilized to fulfill the functions of an official language. Thus many states in the face of uncertainty associated with the cost and returns involved in the creation of written language might resort to using the colonial language. The proposed relationship finds strong support when we observationally examine availability of written traditions and choice of official language. Looking across the globe, nearly every country that had a writing script for an indigenous language has adopted at least one indigenous language as at least co-official. This factor can explain the language policy choices observed in sub-Saharan African. Most sub-Saharan African countries (with Ethiopia, Tanzania, and Liberia as exceptions) did not possess a writing tradition and are characterized by the usage of only the colonial language as the official language. To empirically test whether availability of a writing tradition has any explanatory power, we regress our measure of distance from official language on a dummy for having a writing tradition.Footnote 36 The results are shown in Table 9.
Factors Affecting Average Distance from Official Language

Notes: *p < 0.10; **p < 0.05; ***p < 0.01. Robust SE’s in parentheses and standardized coefficients in square brackets.
The availability of a writing tradition is seen to be a statistically significant predictor of ADOL. In columns (2) and (3) we control for log GDP per capita at independence and log population in 1500 (as a proxy for levels of development in the Middle Ages), respectively. The two wealth related factors are not only seen to be statistically insignificant but also their explanatory power is seen to be less by a factor of 40–60 as compared to the hypothesized factor.
The regressions shown in Table 9 thus provide support to the assertion that possessing a writing tradition is an important determinant of ADOL. However, the indicator variable cannot be used as an instrument, as states which had a writing tradition, as compared to those which did not, arguably also differ on other important unobservable characteristics which might affect socioeconomic development.
Drawing from the work of Diamond (Reference Diamond1997), we hence propose using distance from the sites at which writing was independently invented as an instrument for ADOL.Footnote 37 He argues that geography was a crucial factor as to why a set of polities—Tonga’s maritime protoempire, the Hawaiian state emerging in the late 18th century, all of the states and chiefdoms of subequatorial Africa and sub-Saharan West Africa, and the largest native North American societies, those of the Mississippi Valley and its tributaries—did not acquire writing before the expansion of Islam and the arrival of the Europeans.
Writing was independently invented in Mesopotamia (Sumer) around 3200 BCE, in China around 1200 BCE, and in Mesoamerica around 600 BCE, and then diffused through trade and exchange to the rest of the world. The rationale for using the distance from the site of invention as an instrument is that the further the distance from the site of invention, the less likely is a country to have obtained the writing tradition through the process of diffusion, and consequently based on the evidence in Table 9 will have a higher ADOL. Observe that using the distance from the site of invention as an instrument exploits the exogenous component of the probability of having a writing tradition, i.e., geography. The key underlying assumption for it to be a valid instrument is that the distance from these sites of invention should have no independent impact on socioeconomic development today, except through the channel of affecting the probability of possessing a writing tradition.
To operationalize the measure we calculate the great-circle distance, using the Haversine formula, from each of the sites of invention to every other country in our sample. We then take the minimum of the distance from the three sites as the measure of distance from the place of invention of writing. Figure 3 shows the relationship between the shortest distance from the sites where writing was invented and the ADOL; as hypothesized the distance from official language is seen to be increasing in the distance from where writing was invented. The IV estimates for the five dependent variables of interest are shown in Table 10.
Reduced Form Relationship Between ADOL and Distance from Site of Invention of Writing

IV Regressions of Distance on Cognitive Scores, Life Expectancy, Log GDP per Capita, Log Output per Worker, and zHDI in 2010

Notes: *p < 0.10; **p < 0.05; ***p < 0.01. Robust SE’s in parentheses and standardized coefficients in square brackets.
Columns (1), (3), (5), (7), and (9) regress cognitive test scores, life expectancy, log GDP per capita, log output per worker, and zHDI, respectively, on ADOL instrumented for by the minimum distance from the sites of invention of writing. In panel (B) the first stage regressions of distance from the sites of invention of writing on ADOL are shown. Inspecting the F statistics shows that all, except in column (1), meet or exceed the value of 10, and in most cases are greater than 30, suggesting that distance from the site of invention is a strong instrument for ADOL.Footnote 38 In panel A are the results of the second stage; we see that the predicted value of ADOL is a statistically significant and economically important predictor of all the socioeconomic variables. The point estimates slightly exceed the OLS estimates in Tables 3 and 4.
In columns (2), (4), (6), (8), and (10) we additionally add the three controls outlined before in the section on cross country regressions—linguistic diversity accounting for distance, constraints on the executive, and log GDP per capita at independence. We additionally control for an America dummy and the proportion of population of European descent in 1975. The reason is that the majority of the population on the American continent can be classified as either settlers or individuals of mixed race heritage (also known as “mestizos”), whose mother tongue is a language which the settlers brought along with them. Thus for these countries distance from the site of invention of writing is not an important determinant of ADOL. Again the ADOL is seen to be a statistically significant predictor of the levels of socioeconomic development. Results remain stable adding genetic diversity, genetic diversity squared, and latitude to these estimations, as shown in Table A.12 of the online Appendix.
A potential concern with the estimates in Table 10 is that the distance from the sites of invention of writing could be correlated with other factors affecting socioeconomic development. If for instance we were to assume that distance from these earliest sites of invention of writing was responsible not only for acquiring the writing tradition but also a determinant of quality of state institutions and/or governance, then we would be violating the exclusion restriction for our instrument to be valid. In order to assess whether this is a cause for concern we run reduced form regressions of the minimum of the distance from the sites of invention of writing on the three most widely used measures of state institutional capacity and governance: (i) average protection against expropriation risk from the Political Risk Services (PRS) group averaged over the years 1995–05; (ii) social infrastructure combining government anti-diversion policies and openness to international trade from the work of Hall and Jones; and (iii) constraints on the executive from Polity-IV and averaged over the years 1960–2000. The results are shown in Table 11.
IV Falsification Test—Regressions of Distance from Sites of Invention of Writing on Development Outcomes

Notes: *p < 0.10; **p < 0.05; ***p < 0.01. Robust SE’s in parentheses and standardized coefficients in square brackets.
The distance from the sites of inventions of writing is not a significant correlate of any of the three measures of state institutions or governance, with the F statistic taking a value of less than 1 in all three regressions. Thus the IV results confirm the negative relationship between ADOL and socioeconomic development estimated by the OLS, and suggest that the OLS estimates may be a lower bound of the true effect of ADOL.
Finally, to gauge the economic magnitude of the IV estimates, again consider Ghana adopting Akan, the language of its largest ethnic cluster, as its official language instead of English. Such a change would move Ghana 23, 24, and 31 positions up in the ranking of countries on cognitive test scores, life expectancy, and log output per worker. Alternatively it would move Ghana from the
 $7{\text{th}}$
,
 $22{\text{nd}}$
and
 $21{\text{st}}$
percentile of the distribution of cognitive test scores, life expectancy, and log output per worker to the
 $38{\text{th}}$
,
 $40{\text{th,}}$
and
 $47{\text{th}}$
percentile, respectively.
MICROEVIDENCE FOR THE THEORETICAL FRAMEWORK—THE EFFECT OF INDIVIDUAL LEVEL DISTANCE FROM THE OFFICIAL LANGUAGE
Distance for every individual between his/her language and the official language is the first channel through which language policy operates. Our theory holds that high distance from the official language, holding other factors constant, increases learning as well as information acquisition and processing costs for the individual. This increased cost affects human capital formation, knowledge, and adoption of best health practices, and in turn these translate into differences in occupational and wealth outcomes.
In order to estimate the effect of distance from the official language on individual outcomes, consider the case of India. Most Indian states use their majority indigenous language up to the end of secondary schooling. Government affairs, administration, and courts carry out their functions in the state language and English.Footnote 39 The central government in turn operates in Hindi and English, where Hindi is the mother tongue of around 45% of the population. The languages in India come from two distinct language families, the Indo-European and the Dravidian, which provides us with crucial variation at the subnational level, as the distance within each language family is around 0.29 and across language families, by construction, is 1.
Data
The data come from the Indian National Family Health survey (NFHS 3) of the year 2005–06. We consider the sample of males and females aged 15–54 years to estimate the effect of individual language distance on various socioeconomic outcomes of interest. The data provide information on the native language of the respondent, typically a proxy for the language of one’s ethnic group even if the respondent has only limited facility in it, and state of residence, which allows us to calculate the language distance for individuals from the official state language. The data set also provides information on relevant individual characteristics such as age, religion, caste, educational attainment, a wealth index, employment status, nature of occupation, as well as knowledge and adoption of health practices.
Identification Strategy
We estimate the effect of the distance of an individual’s native language from the official state language on six variables. The first two are proxies for human capital: (i) years of education and (ii) a dummy variable for whether the individual is literate. The next two measure health knowledge and practices: (iii) an indicator variable for whether the individual has ever heard of AIDS; (iv) whether the household uses a mosquito bed net for sleeping.Footnote 40 The final two measure occupation and wealth outcomes: (v) whether the individual holds a white-collar jobFootnote 41 ; (vi) an indicator for whether the individual falls in the top quintile of the income distribution.
Comparing across Indian states indicates large variations in their levels of socioeconomic development, which are important to account for in any empirical exercise. Accordingly in all our specifications we account for state fixed effects.Footnote 42
A naive comparison of language distance and socioeconomic outcomes based on native speakers (nonmigrants) vs non-native speakers (migrants) resident in the same state fails to account for the fact that natives and migrants might differ along unobservable dimensions which are not accounted for and which might be correlated with language distance.Footnote 43 In order to address this concern we restrict ourselves to the sample of individuals who report as having always lived in the same state, or in other words we exclude any first generation migrants. For nonmajority language speakers, our data include both members of rooted minority groups (who by rights in the Indian Constitution can receive primary education in their mother tongues) and individuals whose families were migrants in recent generations (who do not have concentrations of their population that would make them eligible for indigenous language instruction in public education). To the extent that rooted minorities are getting the indigenous language instruction that the Constitution affords them, our results seeking to estimate the effect of not receiving mother-tongue education would be an underestimate. On the Constitutional formula for minority language instruction, see Sridhar (Reference Sridhar1996).
As we observe individuals belonging to the same linguistic groups in states having different official languages, we are able to account for any linguistic-specific group differences through the inclusion of language group fixed effects. In sum, our identification strategy ensures that the estimated effect of language distance is not due to any time invariant state or linguistic group characteristics.
Results
To estimate the effect of language distance on the dependent variables of interest, the following regression is estimated:
 $$\begin{eqnarray}
O_{ijm}&=&S_{j}+\delta _{0}*\text{Distance}\_\text{State}\_\text{Language}_{ijm}+\beta _{k}\nonumber\\
&&+\, L_{m}+X_{ijm}+\epsilon _{ijm},
\end{eqnarray}$$
where Oijm is the outcome of interest for individual i in state j and linguistic group m; and where all individuals report having always been resident in the same state, or in other words are not first-generation migrants. Sj refer to state fixed effects, β k refer to a set of year of birth dummies, and Lm to language group fixed effects. Xijm is a vector of individual level characteristics which include dummies for caste, religion, whether individual lives in a city, town, or countryside and the altitude of the primary sampling unit. The coefficient of interest δ0 captures the effect of distance from the official state language on various socioeconomic outcomes, and which according to the theoretical framework should be negative.
The results of the estimation exercise are provided in Table 12. The effect on years of education and literacy is calculated using an ordinary least squares regression, whereas the other four dependent variables are estimated using a logit regression, and all six models account for individual sample weights. Table 12 reports the average marginal effect of moving from a language distance of 0.292 (that is, within language families) to 1 (that is, between language families).
Marginal Probability Estimates of Language Distance from Official State Language on Socioeconomic Outcomes

Notes: *p < 0.10; **p < 0.05; ***p < 0.01. Robust SE’s in parentheses.
In column (1) and (2) the dependent variables considered are years of education and whether the individual is able to read a complete sentence. The marginal effect shows that moving from a language distance of 0.29 to 1 decreases the years of education by 0.81 years, and is statistically significant at the 1 percent level. Similarly, for the dependent variable literacy, the average marginal effect shows that the probability of being literate reduces by 5.9 percentage points moving from a language distance of 0.29 to 1. In other words, comparing a Bengali speaker living in Delhi with one in Tamil Nadu shows, after accounting for state and language group specific difference and time trends, that the Bengali living in Tamil Nadu would have 0.81 fewer years of education and would be less likely to be literate by a whole 9 percent.
Columns (3) and (4) use binary indicators for whether the individual has ever heard of HIV, and if the household uses a mosquito net for sleeping as dependent variables. We observe that the marginal effect of moving from a language distance of 0.29 to 1 reduces the probability of having ever heard about AIDS or the household using a mosquito net for sleeping by 9 and 4.4 percentage points, respectively. Given that the sample average for the binary variable, usage of mosquito nets, is around 40 percent, the estimated marginal increase amounts to a 11 percent increase in the likelihood of using a mosquito net.
Finally columns (5) and (6) consider a binary indicator of whether the individual holds a white-collar job and belongs to the top quintile of the income distribution, respectively. The estimate shows the probability of holding a white collar job and belonging to the top income quintile decreases by 2.5 and 1 percentage point, respectively, when we move from a language distance of 0.29 to 1. Given that on average only 8 percent of individuals hold a white-collar job, the estimated marginal probability amounts to a 31 percent increase in the probability of holding a white-collar job.
The above results confirm the pattern observed in the cross-country data, but are now based on individual level data from India. The individual level data show that distance from the official language has important implications for human capital (education and health), as well as for occupational and wealth outcomes. The identification strategy ensures that the effect of language distance cannot be attributed to state specific or language group specific differences, time trends, or issues of selection related to migration.
MICRO EVIDENCE FOR THE THEORETICAL FRAMEWORK—THE EXPOSURE CHANNEL
Relying on microlevel data, let us now test for the effects of the exposure channel. Our evidence comes from countries that participated in the second round of the Southern and Eastern Africa Consortium for Monitoring Educational Quality (SACMEQ) program. SACMEQ is a consortium of education ministries, policymakers, and researchers that in conjunction with UNESCO’s International Institute for Educational Planning (IIEP) collects data on primary schools from 11 African countries.
Consistent with our second assumption, other analysts have conjectured that one of the potentially important reasons for the poor educational outcomes observed on the African continent is not just the fact that the language of instruction is very distant from the native language of the students, but the fact that their exposure to this language remains virtually absent outside the classroom (Brock-Utne Reference Brock-Utne2002; Dutcher Reference Dutcher2003). Unrelated directly to education, but still related to the notion of exposure, Lazear (Reference Lazear1999) shows that the likelihood that an immigrant will learn English is inversely related to the proportion of the local population that speaks his or her native language. Since everyday family, social, and community life is based on the use of their native language or lingua franca, the exposure to the language of instruction is limited. The two forces in combination—use of a nonindigenous language along with limited exposure—imply that learning costs of the official language are high.
Data
The SACMEQ II round collected data on around 40,000 students, 5,300 teachers, and 2,000 school heads from 2000 primary schools.Footnote 44 The dataset provides information on standardized student achievement tests in reading and mathematics across the 13 countries for pupils currently in the sixth grade.Footnote 45 The scores are standardized with a mean of 500 and standard deviation of 100. Moreover the standardized scores are provided for essential reading and math tests as well as for a comprehensive math and reading test. The data also provide a categorical indicator which captures whether students meet the minimum and desirable reading levels of SACMEQ. These are the main pupil related outcomes which form the dependent variables of interest. The dataset also provides extensive information on the students’ socioeconomic background such as parents’ education, possessions, housing quality, availability of extra lessons outside the classroom (often referred to as tuitions), support at home for homework, and school absences. It also asks a question regarding usage of the medium of instruction, English, at home, which is divided into the category of never, sometimes, and often. The dataset also collects information regarding teachers, headmasters, schooling infrastructure, and quality. It also allows us to identify the classroom to which each student belongs. Control variables and descriptive statistics are provided in Table 13.
Educational Data for East and Southern Africa: Selected Descriptive Statistics

The descriptive statistics convey the gravity of the problem facing the educational sector in Africa. About 60% of the students do not reach the minimum reading level. When the bar is fixed at the desirable reading level, about 86% of the students are classified as not reaching that level, and this in spite of vast foreign aid expenditures over the previous decade directed at the educational sector (Devarajan and Fengler Reference Devarajan and Fengler2013). Obviously, fundamental factors affecting student achievement have not yet been addressed, which directs attention to the exposure channel.
Identification Strategy
To test for exposure, the key independent variable of interest is the frequency with which pupils use English at home. Regarding the usage of English at home, 23% report as never using English at home, 55% report using English sometimes at home, and 21% report using English often at home. We construct a binary indicator which takes the value 0 in case the student never uses English at home and the value 1 if the students use English often or sometimes at home.Footnote 46 As all students are Africans, in the data their distance to the official language, English, is equidistant and equal to 1.Footnote 47 This means there is no need to control for the effect of individual level distance from the official language. The choice of our independent variable, use of English at home, is inspired by the work of Dustmann, Frattini, and Lanzara (Reference Dustmann, Frattini and Lanzara2012) who show that the single most important factor in explaining differences between immigrant and native children PISA tests scores in OECD countries is the language spoken at home.
Recall that more than 70–80% of the population in most African countries do not speak the official language and this is especially true for the older generations. It is therefore not surprising that the variable “using English at home” captures a rather small increment in academic success. In the data around 70% of the pupils who do not reach the minimum reading level still claim to use English at home. Given the low level of skills the pupils themselves possess it can be inferred that the exposure to English that takes place even at home is not comparable in quantity or quality in any way to the exposure that language minority students in advanced industrial countries, for instance as immigrants, experience while learning in a majority language. Thus the reported levels of high usage might still be very low in quality and quantity when compared to conventional exposure to the medium of instruction in countries where it is spoken by the local population as a native language. That said, given that our measure of exposure captures low quantity and quality of exposure, if it still turns out to be a significant explanatory factor of student performance, this would imply that the estimate should be considered to be the very lower bound of the effects of exposure.
The data identify the classroom to which each student belongs. We have information on 33,141 students in 4,686 classes across the 11 countries.Footnote 48 We are hence able to account for classroom fixed effects in our analysis. Taking classroom fixed effects implies that common factors—such as teachers, school infrastructure, and other unobservables—that affect student performance at the classroom level are accounted for. We can now estimate the effect of using English at home, which is our proxy for exposure to the medium of instruction, on test scores with class fixed effects and controls at the level of the student’s home.
Results
To estimate the effect of exposure on student achievement we estimate the following reduced form equation:
 $$\begin{equation}
\hspace*{-10pt}S_{ij}=C_{j}+\delta _{0}*\text{English}\_\text{Home}_{ij}+\delta _{1}*X_{ij}+\epsilon _{ij},
\end{equation}$$
where Sij refers to the relevant outcome of interest of student i in classroom j. The outcomes considered are the test scores on essential and comprehensive math and reading tests, respectively, for students in the sixth grade.
Cj refers to the classroom fixed effects which account for factors at the classroom level which potentially affect student performance. δ0 is the coefficient of interest and captures the effect of using English at home on student performance. Xij refers to the student level controls at the family level, which are shown in Table 13. All regressions are estimated using pupil weights provided by SACMEQ and robust standard errors are estimated.
The results of the estimation exercise are shown in Table 14. Exposure to English has a positive and statistically significant effect on all six student outcomes considered. The first column considers the essential reading score as the dependent variable. The estimation results suggest that increased exposure to English, captured by frequency of use of English at home, increases the essential reading score by 20 points or
 $\frac{1}{5}$
of a standard deviation. In column (2), the dependent variable considered is the standardized score on a comprehensive reading test. The results again indicate that exposure to English increases the reading score by 19 points or
 $\frac{1}{5}$
of a standard deviation.
Effect of Exposure to English on Student Achievement

Notes: The dependent variables in columns (1) and (2) are the essential and comprehensive reading scores; columns (3) and (4) are the essential and comprehensive math scores; columns (5) and (6) the dependent variable is a binary indicator of whether the student reaches the minimum and desirable reading level. The list of individual level controls is shown in Table 13. *p < 0.10; **p < 0.05; ***p < 0.01. Robust SE’s in parentheses and standardized coefficients in square brackets.
Columns (3) and (4) consider the essential and comprehensive mathematics test scores. Exposure to English is seen to have a similar effect as the one on reading scores. It increases the mathematics score on the essential and comprehensive tests by 18.82 and 18.16 points, respectively, amounting to a
 $\frac{1}{5}$
of a standard deviation in both tests.
The last two columns, (5) and (6), consider the effect of the use of English on reaching the minimum and desirable level of reading. The table reports the average marginal effects of the binary indicator. Use of English at home increases the probability of reaching the minimum and desirable reading level by about 9 and 4 percentage points, respectively.
The fact that even this low (both in terms of quantity and quality) level of exposure that we have isolated has a positive and significant impact on student performance in turn hints at the fact that high levels of official language exposure, a factor missing on the African continent, might play a very important role in increasing human capital.
Discussion and Methodological Concerns
One cause for concern is that the indicator of exposure might be correlated to some other omitted home level variable which is driving the results. In Figure A.1 in the Online Appendix is plotted the average usage of English at home by socioeconomic status and education level of parents. Usage of English is increasing in both the socioeconomic status as well as the parents’ education level. This suggests that children from better-off households are more likely to use English at home. That said, it should be noted that the coefficient and significance on our coefficient of interest, δ0, remains remarkably stable even after controlling for a rich set of individual level controls that could affect student performance.Footnote 49
It is often stated that as usage of the indigenous language is very vibrant for home and community affairs in Africa, the use of a foreign language does not really threaten the position or the existence of these indigenous languages. The results here however indicate that this maintenance might very well be at the cost of poor schooling outcomes and the usage of the medium of instruction for home and community affairs might be consequential for reducing learning costs.
CONCLUSION
One of the legacies of colonialism has been the continued use of the former colonial language as the official language in most postcolonial states. Here we theorize that the official language, by acting as a gatekeeper for accessing education, jobs, and elite political networks, imposes costs of participation due to its linguistic distance from popular speech and due as well to the low exposure people have to that official language in everyday life. The question raised by this theoretical orientation is whether a foundation in a language which is proximate in structure and rich in exposure provides a stronger foundation for health and human capital.
In our attempt to test this theory, readers will note that we have analyzed several observable implications of our theory, but without an “interocular traumatic test,” that is, one that hits you between the eyes (Putnam, Leonardi, and Nanetti (Reference Putnam, Leonardi and Nanetti1994, 19) quoting John Tukey). A perfect test would have been if there were a set of countries that were randomly assigned official languages such that we could isolate the average returns to decreased average distance. Alas, the world did not offer us this experiment, nor even a set of countries whose official language was altered in a way that was exogenous to concerns of development.
A less ideal experiment, but still one that is direct, would have been to rely on the digitized Ethnologue map of ethnolinguistic groups within each country, and for each ethnic heartland measure its economic prosperity (proxied by satellite imagery on level of night lighting) and the degree of distance of its language in reference to the official language of the state (Alesina, Michalopoulos, and Papaioannou Reference Alesina, Michalopoulos and Papaioannou2016). Alas, this too would not provide valid inferences. Given that our theoretical channel is in human capital formation, we should expect that those students who best succeed in gaining human capital will have an incentive to migrate outside the home region in order to get the most prestigious jobs. Therefore the light exposure in the ethnic heartlands would be measuring the impact of the educational system on those who took the least advantage of it.
As readers can infer, we abandoned the quest for the ideal experiment, but as we summarize our results below, we hope we have not only exposed the limits of, but also the possibilities for observational data for the study of development.
Using language trees from Ethnologue, a measure of average distance to the official language (ADOL) was constructed for each country. We regress ADOL on four outcome measures that are theorized to be implications of language distance: comparative test scores on internationally comparable exams; life expectancy; per capita GDP; and output per worker. We then combine the elements of these proxies and rely on a standardized score on the Human Development Index (zHDI). Whether using the proxies or the zHDI, we find a robust negative relationship between ADOL and the development outcomes of interest.
We then address the methodological issues of possible omitted variable bias and endogeneity, and our results hold up. After that, we address the question of causality, and apply several tests. Most important is an instrumental variable estimation. We first show that if there is a major group in the country that has a long writing tradition, that country is more likely to have an indigenous language as official. This was the source of the idea for using as our instrument the distance of the country’s capital to the nearest spot of the historical origins of writing. Therefore, proximity to the invention of writing is a good predictor of language choice but uncorrelated with standard measures of institutional quality and state strength, and therefore a valid instrument. Our results hold with this IV estimation, giving us confidence that language choice has a causal impact on human capital and health.
Moving to more micro data, we then test for each of our two theoretically derived channels by using data from a set of 11 African countries and India. Exposure to English, which is the medium of instruction in schools in the 11 African countries considered, has a positive effect on student achievement in both mathematics and reading scores. The Indian data show that the higher the distance between the native language of the individual and the official language of the state he or she is born in, the poorer the human capital and occupational outcomes.
A natural question, assuming that reliance on colonial languages constrains human development, is why many postcolonial countries have relied so heavily on colonial languages for education and administration. Building on ideas presented in Laitin (Reference Laitin1994; Reference Laitin2000), a subsequent article will explain the perpetuation of inefficient language policies. It will focus on potential opposition of language groups whose languages are not officialized. But it will also show how elites, taking advantage of their command of colonial languages, can perpetuate their returns to political power by (over)emphasizing the costs of transition to an indigenous language policy. Though this article does not assess the political economy of a shift in language policy, it provides a reasonable estimate of the costs entailed in the reliance on colonial language.
The second important question that then follows is how best to shift from an inefficient language equilibrium. Recognizing the individual and joint effects of both the exposure and distance channels, this article suggests two possibilities. First, institutionalizing in education and the health sector a language which is proximate in structure to the indigenous language of the population would provide a stronger foundation for human capital. Second, if this is politically infeasible, efforts to increase exposure to the educational medium is likely to have high returns in human capital. This might be done through adult education campaigns in the official language in the expectation that this would imply more of its use in student homes. Or governments could work to upgrade teacher fluency in the official language, thereby providing better exposure to their students of its standard use. Finally, the employment of professionally trained translators in the health sector would have considerable value. In any event, the data in this article suggest that future work in development should put more attention on remedying the heavy costs of inefficient language policies in postcolonial states for human development.

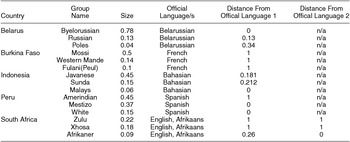
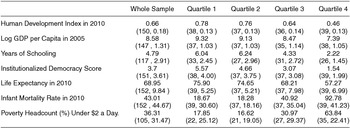
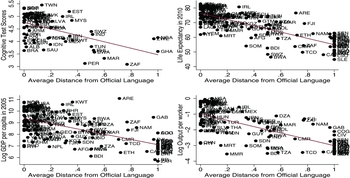
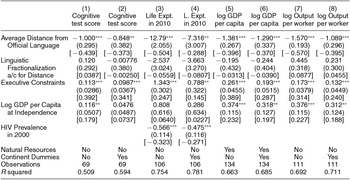
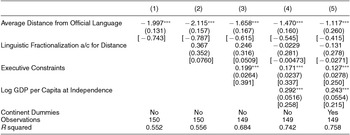
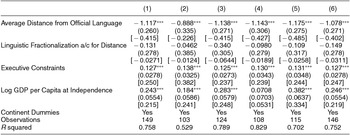
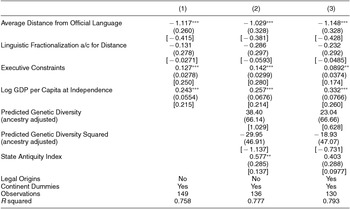
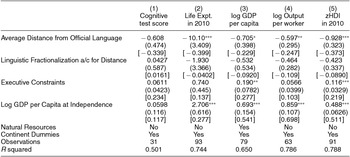
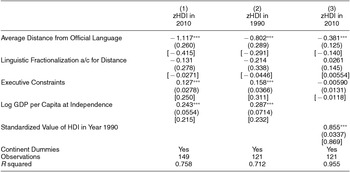
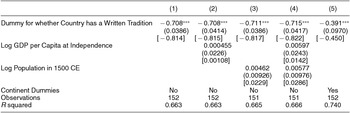
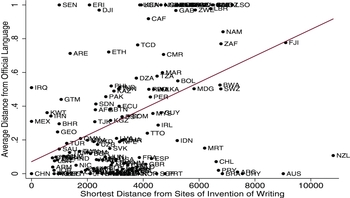
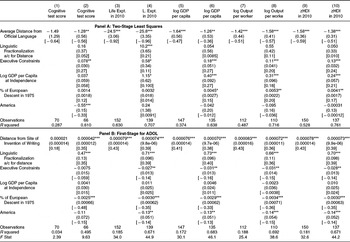
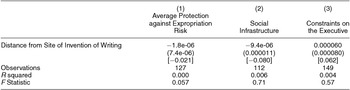
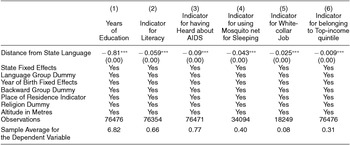
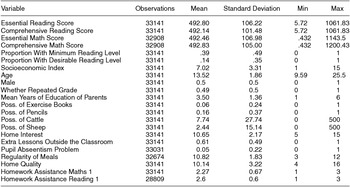




Comments
No Comments have been published for this article.