Attention deficit hyperactivity disorder (ADHD) is a biobehavioral developmental disorder. The fourth revised edition of the Diagnostic and Statistical Manual of Mental Disorders (DSM-IVTR, American Psychiatric Association, 2002) differentiates three types of ADHD: combined (ADHD-C), predominantly inattentive (ADHD-I), and predominantly hyperactive-impulsive (ADHD-HI). Some investigators consider that ADHD-I and ADHD-C are not variants of the same disorder, but different disorders because they differ in the type of altered attentional processes and in the associated brain circuits (Barkley, Reference Barkley1997; Diamond, Reference Diamond2005; Milich, Balentine, & Lynam, Reference Milich, Balentine and Lynam2001).
Attending to a stimulus requires the capacity to select and separate it from other irrelevant stimuli, either internal or external. This capacity has been related to inhibitory control processes (Luna, Garver, Urban, Lazar, & Sweeney, Reference Luna, Garver, Urban, Lazar and Sweeney2004). According to Marzi (Reference Marzi, Denes and Luigi1999), control processes can be either automatic (reflect) or intentional (voluntary). From an evolutionary perspective, the automatic processes developed before the voluntary processes, and may be underlying their functioning (Aksan & Kochanska, Reference Aksan and Kochanska2004). This distinction is important because these processes can progress at different rhythms, and the development of automatic processes is necessary for the correct functioning of the voluntary processes (Luna et al., Reference Luna, Garver, Urban, Lazar and Sweeney2004).
One of the most influential models of ADHD proposes that these difficulties are due to a deficit in response inhibition to distractor or irrelevant stimuli (Barkley, Reference Barkley1997). Some experimental evidence shows that people with ADHD do not present difficulties in some reflect processes such as orientation towards visual stimuli (Huang-Pollok & Nigg, Reference Huang-Pollock and Nigg2003). However, they do present difficulties in reorientation of attention towards novel stimuli, sustaining their attention, and task persistence (Swaab-Barneveld et al., Reference Swaab-Barneveld, de Sonneville, Cohen-Kettenis, Gielen, Buitelaar and van Engeland2000).
Attending to a stimulus requires the capacity to filter and separate it from other irrelevant stimuli (internal or external). This capacity to filter and select stimuli is considered to be related to the delay or voluntary suppression of a response (also known as inhibitory control). In the past two decades, some works have studied visual attention and inhibitory control by analyzing eye movements in samples of participants with ADHD and controls. The most important findings of these studies are: (a) the broad variability of the responses of the ADHD groups, compared to the controls, (b) the greater difficulty of the ADHD groups to voluntarily control eye movements and to inhibit gaze direction towards irrelevant or distractor stimuli (for a review: Luna, Velanova, & Geier, Reference Luna, Velanova and Geier2008; Rommelse, van der Stigchel, & Sergeant, Reference Rommelse, Van der Stigchel and Sergeant2008).
The diagnosis of attentional problems is controversial and the appraisal of attention deficit currently constitutes an ill-defined problem (Adams, Derefinko, Milich, & Fillmore, Reference Adams, Derefinko, Milich and Fillmore2008; Diamond, Reference Diamond2005; Milich et al, Reference Milich, Balentine and Lynam2001). The diagnosis of ADHD is a clinical diagnosis and it is conducted on the basis of information collected from diverse informants and with diverse instruments. Interviews, symptom rating scales, psychometric tests, laboratory tasks, or neuropsychological profiles all contribute in different degrees to the diagnosis. In order to contribute to the diagnosis of visual attentional disorders, and particularly of ADHD, a test based on binocular rivalry (BR)—a little-used paradigm in the study of this disorder—has been elaborated.
The stimulatory richness of the immediate environment provokes a competition between stimuli or objects, in which, due to the activity of the attention mechanism, some of the stimuli are selected to form part of a perceptive experience. Stimulus selection is a property shared by BR and attention, so it is assumed that both processes are related (Alais & Blake, Reference Alais and Blake2005; Tong, Meng, & Blake, Reference Tong, Meng and Blake2006). Helmholtz (Reference Helmholtz1867), observed that the dominance of a specific stimulus could be increased by counting the number of lines that composed it; Tong et al. (Reference Tong, Meng and Blake2006) found that attention influenced the initiation of perceptive alternation, but not the duration of exclusive dominance, because “it is not possible to prolong the dominance of a stimulus indefinitely” (p. 509).
When two dissimilar images are presented, one to each eye, perception alternates every few seconds between the two images. This phenomenon, in which one stimulus becomes dominant while the other one is excluded from the field of visual awareness, is known as BR, and it is an effective way to measure selective attention and visual awareness (Alais & Blake, Reference Alais and Blake2005; Tong et al., Reference Tong, Meng and Blake2006). The BR phenomenon is produced automatically, and there is little voluntary control over it (Blake, Reference Blake2001; Meng & Tong, Reference Meng and Tong2004). The imposition of one of the precepts is an automatic process, in which attention or certain characteristics of the stimuli can favor the initiation of dominance. However, one of the precepts cannot remain indefinitely dominant over the other one, so that the perceptive change, and the subsequent visual awareness of the precept, can be considered an indicator of an automatic inhibition process (Alais & Blake, Reference Alais and Blake2005; Blake, Reference Blake2001).
There are no works that have examined the relations between BR and attention disorders, comparing children from community and clinical samples. In order to fill this gap, we have applied a BR task to a group of children with ADHD and a control group, registering the frequency of alternations, dominance duration, and the decision time between perceptive alternations, as measures of BR.
Method
Participants
The sample comprised 159 participants, aged between 6 and 15 years (M = 10.32 years, SD = 2.71), who were assigned to one of the following groups:
ADHD group. It included 57 participants (40 males), 41 ADHD-C (M age = 10.27 years, SD = 2.32 years; 36 males) and 16 ADHD-I (M age = 11.29 years, SD = 2.54 years; 14 males), recruited from the psychiatry and psychology service of a public hospital. The diagnosis was carried out following the criteria of DSM-IV-TR (APA, 2002), by means of an interview (Clinical Interview-Parent report form; Barkley & Murphy, Reference Barkley and Murphy2006 ) and taking into account the results of the ADHD Questionnaire (Amador-Campos, Forns-Santana, Martorell-Balanzó, Guàrdia-Olmos, & Peró-Cebollero, Reference Amador-Campos, Forns-Santacana, Martorell-Balanzó, Guàrdia-Olmos and Peró-Cebollero2005) and the revised Conners’ Scales (Conners, Reference Conners1997), completed by parents and teachers. The type of ADHD was classified based on the results of the interview and the questionnaire scores. Participants were classified as ADHD-I if they met the criteria for inattention but not for hyperactivity-impulsivity in the interview and on the rating scales for parents and teachers (6 or more symptoms of inattention and fewer than 6 symptoms of hyperactivity-impulsivity, scored with 2 or 3 on the ADHD Questionnaire for parents and teachers; T-scores > 65 on the factor Cognitive/inattention problems, and ADHD index and T-scores < 65 on the Hyperactivity factor of the Conners’ Scales for parents and teachers). The participants with ADHD-C met the for criteria inattention and hyperactivity-impulsivity (6 or more symptoms of inattention and of hyperactivity-impulsivity, scored with 2 or 3 on the ADHD Questionnaire for parents and teachers; T-scores > 65 on the factors Cognitive/inattention problems, Hyperactivity, and ADHD index of the Conners’ Scales for parents and teachers).
Control group. This included 102 participants (M age = 10.23 years, SD = 2.92 years; 43 males), all recruited through a private school in Barcelona. They all presented fewer than 6 symptoms of inattention and hyperactivity-impulsivity, rated by parents and teachers on the ADHD Questionnaire, and T-scores < 60 on the factors Cognitive/inattention problems, Hyperactivity, and ADHD index of the Conners’ Scales for parents and teachers.
Exclusion criteria for both groups were: full IQ < 80 on the WISC-IV (Reference WechslerWechsler, 2003/2005), tic disorders, neurological disorders, autistic spectrum disorders, learning disorders, motor skill disorders, communication disorders, psychosis, bipolar disorder, and mood or anxiety disorders.
The ADHD-C and ADHD-I groups and the control group were equivalent in age, F(2, 157) = .867. All the participants had normal visual acuity (Snellen chart), or corrected to normal with glasses, and normal stereoscopic acuity (Titmus test).
The study was approved by both the hospital’s ethics committee and the management board of the school. All the participants volunteered to take part in the study and their parents or legal guardians signed informed consent. The study was conducted in accordance with the Declaration of Helsinki of 1975 (as revised in Tokyo in 2004).
Instruments
Clinical Interview-parents’ version (Barkley & Murphy, Reference Barkley and Murphy2006)
This interview was used to collect information from the parents of the children or adolescents with ADHD in the clinical sample. It includes 7 sections: family composition, parents’ concern and reasons for the assessment, review of DSM-IV disorders (ADHD, oppositional defiant disorder, conduct disorder, bipolar disorder, anxiety and mood disorders), parents’ educational methods, medical, prior treatment, school and familiar history (psychopathological antecedents of parents and siblings).
ADHD Questionnaire (Amador Campos et al., Reference Amador-Campos, Forns-Santacana, Martorell-Balanzó, Guàrdia-Olmos and Peró-Cebollero2005)
This instrument has 18 items that describe the symptoms of the DSM-IV for ADHD. Parents and teachers rate the frequency and intensity of the symptoms on a scale ranging from 0 (Not true) to 3 (True, happens almost always). The 18 ADHD symptoms are grouped into two factors: inattention and hyperactivity-impulsivity, both for the teachers’ and the parents’ ratings. Reliability is high and even higher for teachers (α between .948 and .957) than for parents (α between .858 and .892).
Conners’ Revised Scales (Conners, Reference Conners1997)
These scales assess symptoms and behaviors associated with ADHD. There are parents’ and teachers’ forms, which cover an age range between 3 and 17 years. The presence and severity of each behavior is rated on a scale ranging from 0 (not true, never, rarely) to 3 (very true, very frequent). The factor analyses of the brief forms, which were used in this work, provide 4 factors for parents and teachers: oppositionism, cognitive/inattention problems, hyperactivity and ADHD index. The internal consistency of the diverse scales ranged between moderate and excellent, both for the parents’ version (.86 to .94) and the teachers’ version (.88 to .95). Test-retest reliability, with intervals between 6 and 8 weeks, ranged between moderate and high: parents’ version (.62 to .85), teachers’ version (.72 to .92).
Wechsler Intelligence Scale for Children, fourth edition (WISC-IV; Reference WechslerWechsler, 2003/2005)
We applied 8 of the 10 main tests (excluding Comprehension and Concepts), obtaining the indexes for Working Memory (WM), Processing Speed (PS), and the prorated Full Scale Intelligence Quotient (PFSIQ). This combination provides an adequate estimation of the FSIQ (Glass, Ryan, Bartels, & Morris, Reference Glass, Ryan, Bartels and Morris2008).
Binocular Rivalry Test
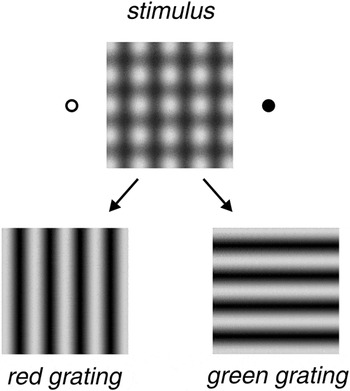
The stimulus used in the Binocular Rivalry Test (Aznar Casanova, Reference Aznar-Casanova2010) consists of an anaglyph image with two gratings, one oriented vertically and the other horizontally, which, when observed from a 60-cm distance, subtend a 4°-visual angle on the retina. The image is made up of two superimposed layers: a red and a green grating that vary in luminance and, when presented dichoptically, induce the BR phenomenon (Figure 1). In this anaglyph image, there was a distractor (a black 5-mm-diameter dot) that switched between two positions in each trial (left-right and up-down).
Image used as the stimulus in the BR test. It was made up of two layers (upper part). Below is shown the separation of the two layers: a grating with a sinusoidal luminance variation in the red band (left, below) and with luminance variation in the green band (right, below).

The test consisted of eight trials in which the anaglyph-stimulus with the two rival images was presented. The participants observed these images through special red-green filter glasses. Each trial had 24-s duration, with a 10-s rest between trials.
Apparatus
The BR test was applied by means of a PC Lenovo ThinkPad T510 computer. The stimuli were presented on a 22” screen with a graphic card with a 1024 x 768-pixel spatial resolution. Fixations and blinks were controlled by means of an eye-movement detector (iViewRED-120 Hz, SensoMotoric Instruments GMBH, Teltow. Germany). Glasses with a red-green filter were used so that the participants would see the images dichoptically. A chin-rest maintained the observation distance and prevented and controlled head movements.
Procedure
The participants were assessed in a hospital or school room, in the same conditions of artificial environmental illumination (100 cd/m2). Task sequence was the same for all participants: the WISC-IV and ocular and manual dominance tests were administered in one session and, in the following session, the BR test was applied.
The participants were seated 60 cm from a screen in the center of which the stimuli that induced BR appeared. They were instructed to look at the center of the image through the glasses with the red-green filter, without moving the head or the eyes.
In each trial, participants were asked to press one of the three knobs on a response box. One, when they were aware of seeing only the vertical grating, one when they were aware of seeing only the horizontal grating, and they should keep pressing them for as long as they saw these gratings. When they stopped perceiving the vertical or the horizontal grating, they should press the knob FIN [END]. The participants were instructed in the task by means of a series of trials with a figural anaglyph-stimulus.
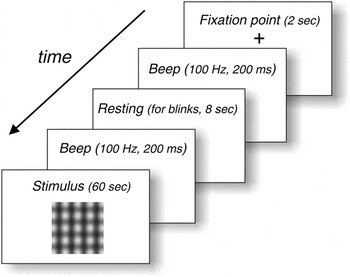
In each trial, the frequency of alternations, the duration of exclusive dominances, and the decision time between alternations were recorded, as well as eye movements (saccades and fixations). Figure 2 shows the sequence of a trial of this test.
Sequence of a trial of the BR test. Achromatic image of the stimulus presentation during the test is shown, and the brief rest intervals required to allow for blinks.

Data Analysis
The data from 37 participants (10 ADHD-C, 4 ADHD-I, and 23 control subjects) were excluded from the analyses because they presented records of eye movements with calibration deviations of ≥ 1°.
We conducted exploratory factor analysis (EFA) with principal components. The factors were selected taking into account: Eigenvalues > 1, variance explained by the factors, and the analysis of the scree plot (Jollifre, Reference Jollifre1986).
Internal consistency was assessed by means of Cronbach’s alpha. Differences of means were analyzed with factorial ANOVAs.
To assess concurrent validity, we calculated the Pearson correlations between the BR measures, the WISC-IV scores, and the questionnaires that measure ADHD symptomatology.
Results
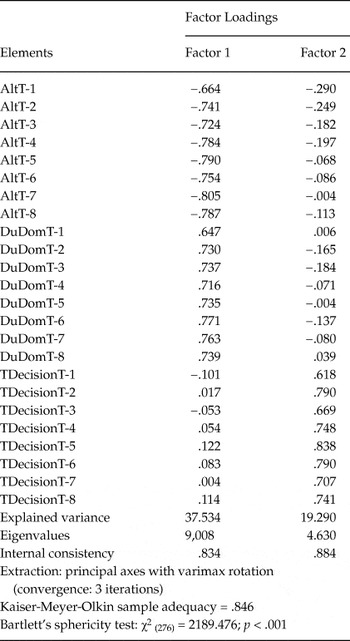
A principal component EFA with varimax rotation, using as variables the number of alternations, the duration of exclusive dominances, and the decision time in the 8 BR test trials, yielded 4 factors, with Eigenvalues higher than 1, which explain 66.7% of the variability. The analysis of the Eigenvalues and of the scree plot indicated that, as of Factor 2, the plot forms an asymptote with the X axis, so we retained the first two factors. Table 1 shows the factor loading matrix after rotation, the Eigenvalues and the Cronbach’s alpha coefficient. Factor 1 includes, with different signs, the perceptive alternations and the duration of exclusive dominances of the 8 test trials; Factor 2 groups all the elements related to the decision time between perceptive alternations. Internal consistency of the two factors was excellent (α = .834 and α = .884, respectively).
Matrix of Factor Loadings of the Measures of the BR Test

Note:
AltT-1/T-8 = Alternations in trials 1-8; DuDomT-1/T-8 = Duration of exclusive dominances in trials 1-8; TDecisionT-1/T-8 = Decision time in milliseconds in trials 1-8.
Analysis of Differences by Group
The first factor of the EFA groups the two indicators of BR: perceptive alternations (the number of times that the visual percept changes, reported by the observer), and the duration of exclusive dominances (the time in ms that the percept remains in visual awareness). As both indicators are complementary, that is, the lower the frequency of alternations, the greater the duration of exclusive dominances, and vice versa, we separated them for subsequent analysis, in order to study the effects of group (ADHD-C, ADHD-I, and controls) and age on the behavioral measures recorded in the BR. We obtained scores in three indicators, two derived from the first factor, alternations (α = .921) and duration of exclusive dominances (α = .905), and one derived from the second factor, decision time between alternations (α = .884), from the sum of the scores in the elements that load on each factor (Russell, Reference Russell2002).
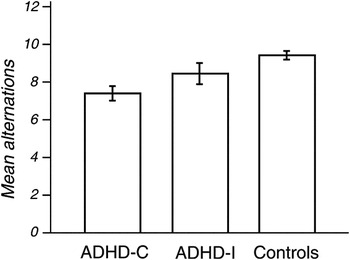
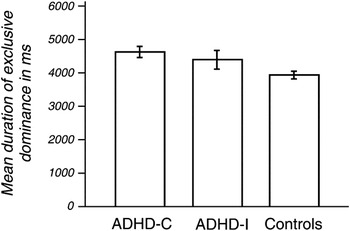
Significant correlations were found between age and the number of alternations, r = −.365, p < .001, the duration of exclusive dominances, r = .524, p < .001, and decision time, r = −.368, p < .001. No significant differences were found between males and females in the number of alternations, t(120) = 1.408, p = .162, the duration of exclusive dominances, t(120) = 1.432, p = .157, or in decision time, t(120) = .799, p = .426. Therefore, we analyzed the groups without separating them as a function of the variable sex. We also conducted a factorial ANOVA, using as dependent variables the number of alternations, the duration of exclusive dominances, and the decision time, and as fixed factor the diagnostic group (ADHD-C, ADHD-I, and controls), with age as a covariate. We found significant effects of diagnostic group, F(2, 118) = 13.204, p < .001, η2 = .183, power = .985, and age, F(1, 118) = 20.867, p < .001, η2 = .150, power = .995, in the number of alternations. The post-hoc (Bonferroni) contrasts indicated that the significant differences occurred between the ADHD-C and the control groups; the ADHD-C group presented a lower number of alternances.
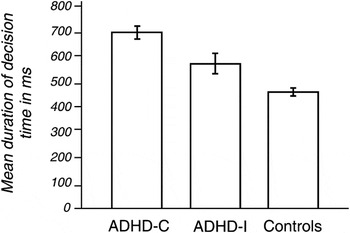
With regard to the duration of exclusive dominances, we found significant effects of age, F(1, 118) = 40.811, p < .001, η2 = .257, power = 1.00, and diagnostic group, F(2, 118) = 8.276, p < .001, η2 = .123, power = .958. The differences occurred between the control group and the ADHD-C group, which displayed higher duration of exclusive dominances. Lastly, we found significant effects of group, F(2, 118) = 33.589, p = .001, η2 = .363, power = 1.000, and age, F(1, 118) = 19.973, p < .001, η2 = .145, power = .99 in decision time. The post-hoc contrasts indicated significant differences among the three groups; the ADHD-C group displayed the highest decision times, followed by the ADHD-I group and the controls.
Figures 3, 4, and 5 show the mean scores in the number of alternations, duration of exclusive dominances, and decision time of the participants. The bars represent measurement error.
Mean number of alternations in the BR test. The error bars delimit the confidence interval (95%).

Mean duration of exclusive dominances (ms) in the BR test. The error bars indicate the confidence interval (95%).

Mean duration of the decision time (ms) in the BR test. The error bars show the confidence interval (95%).

Concurrent Validity
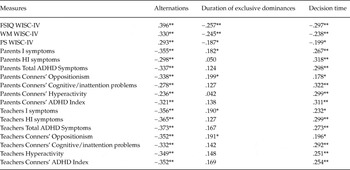
Table 2 shows the Pearson correlations between the BR measures (alternations, duration of exclusive dominances, and decision time) and the WISC-IV scores, ADHD symptoms, and the scores on the Conners’ Scales, completed by parents and teachers.
Correlations between BR Indicators, WISC-IV Scores, Number of ADHD Symptoms, and Scores on the Conners’ Scales

Note:
PFSIQ = Prorated Full Intelligence Quotient; WM = Working memory; PS = Processing speed; ADHD = attention deficit disorder with hyperactivity; I = Inattention Symptoms; HI = Hyperactivity-impulsivity Symptoms.
*p = .05. **p = .01.
We obtained positive and significant correlations, of moderate magnitude, between the number of alternations and the scores in the Full Scale IQ, WM, and PS of the WISC-IV. The correlations between the WISC-IV scores, the duration of exclusive dominances, and decision time were negative, significant, and between low and moderate in magnitude.
The symptoms and altered behaviors associated with ADHD had moderate, negative, and significant correlations with the number of alternations; low and nonsignificant—in most cases—correlations with the duration of exclusive dominances, and positive and significant correlations with decision time.
Discussion and Conclusions
This work present the psychometric properties of a test based on BR in a sample of children with ADHD and a control group. The frequency of alternations and the duration of exclusive dominances have been used previously as neurophysiological markers of BR, especially in samples of adults. However, till now, decision time had not been used in any kind of sample, either clinical or community, of any age. These indicators have been grouped into two factors that explain a high percentage of variability. The first factor groups two complementary measures of BR, with inverse loadings: the frequency of alternations and the duration of exclusive dominances. The second factor, decision time, seems to be separate from the former. The internal consistency of the factors is excellent, which, along with the explained variance and their capacity to discriminate between ADHD groups and controls, shows that these indicators, derived from the BR test, could be used as behavioral measures of BR in the diagnosis of ADHD.
The participants with ADHD-C present a smaller number of alternances and longer duration of exclusive dominances than the control group, although no significant differences were observed between the two ADHD groups (ADHD-C and ADHD-I). All three groups were different in decision time. These data support the hypothesis that children with ADHD, especially the ADHD-C group, have more difficulties than controls in tasks that require the automatic inhibition of a visual percept. The results of this work are partially in accordance with those obtained by Fillmore, Milich, and Lorch (Reference Fillmore, Milich and Lorch2009). These authors used two types of tasks: an automatic inhibition task in which participants should detect the onset of a visual signal, and a voluntary control task in which they should inhibit an eye movement (saccade) towards a visual signal. They found that participants with ADHD (ADHD-C and ADHD-I) required more time than the controls to intentionally inhibit their responses, although no differences were found between the types of ADHD. The participants with ADHD also displayed higher reaction times than the control group in the task that required automatic control of inhibition. In this latter task, the ADHD-I participants displayed lower reaction times than the ADHD-C participants, although they were higher than the control group. The data of our work point in the same direction and support the hypothesis that participants with ADHD present more difficulties than controls in automatic inhibition, and that the ADHD-C group has the most difficulties. This might indicate that, although both types of ADHD have problems of automatic inhibition, the time that the percept takes to clearly prevail in visual awareness is different for the two types of ADHD. This could indicate a lower information-processing speed in the processes of selective visual attention. However, these results do not support those obtained in other works (Adams et al., Reference Adams, Derefinko, Milich and Fillmore2008; Diamond, Reference Diamond2005; Milich et al., Reference Milich, Balentine and Lynam2001) that report that ADHD-I participants present lower information-processing speed than ADHD-C participants. The differences could be due to the type of tasks used, as in the above-mentioned works, they used tasks that are related to voluntary control of inhibition, whereas in this work, the task is related to automatic control. In any event, it must be taken into account that the number of participants of the group with ADHD-I was small, so these results should be taken with precaution until they are replicated in larger samples.
The behavioral indicators of BR show correlations of medium magnitude with working memory and somewhat lower correlations with processing speed. The correlations between ADHD symptoms and measures of BR (alternations and decision time) are moderate and significant, and low and nonsignificant—in most cases—with the duration of exclusive dominances. Tillman, Thorell, Brocki, and Bohlin (Reference Tillman, Thorell, Brocki and Bohlin2007) found low correlations between reaction time and the symptoms of inattention (r between .17 and −.21) and of hyperactivity-impulsivity (r between .05 and −.19) appraised by the teachers, in a motor inhibition task. The authors report that their results support the hypothesis that the difficulties to inhibit motor behaviors were more closely related to the symptoms of inattention than to those of hyperactivity-impulsivity. The correlations obtained in this work are also higher than those of Tillman et al. and of a similar magnitude for the symptoms of inattention and of hyperactivity-impulsivity. The differences may be due to the type of tasks used to measure inhibition, in this case visual, and to the type of inhibition measured, in this work, automatic.
Summing up, the behavioral measures derived from the BR task present adequate psychometric characteristics and allow us to discriminate between participants with ADHD and controls. Decision time, a measure that may be linked to the automatic functioning of the inhibition mechanism, is revealed as the most consistent indicator to discriminate between the groups of ADHD-C, ADHD-I, and controls. It is necessary to carry out more works that include participants with ADHD-HI, and also to increase the number of participants with ADHD-I. In these works, in addition to the behavioral indicators of BR, other measures of selective visual attention and automatic and voluntary control of inhibition processes should taken into account.