

Introduction
Following the 2008 global financial crisis, mortgage lending drove a property crash that produced the deepest post-war recession across advanced economies (Aalbers, Reference Aalbers2012). Public authorities intervened at scale to stabilise housing markets and assist troubled homeowners. In the US and UK, governments launched the Home Affordable Modification Program and Homeowner Mortgage Support to encourage banks to cut repayments for over-indebted borrowers (Langley, Reference Langley2009). Facing potential losses, banks expanded mortgage forbearance through reduced or frozen payments and partial debt write-downs (Waldron & Redmond, Reference Waldron and Redmond2016a). However, while the crisis exposed risks faced by homeowners globally, consideration of renters remained minimal (Kemp, Reference Kemp2015). Research and political debate centred on mortgage defaults, foreclosures and the gendered, class and racial dimensions of the crash (Aalbers, Reference Aalbers2012), despite renting being more associated with poorer housing quality, limited tenure security and weaker regulation (McKee et al., Reference Mckee, Reeves, Clair and Stuckler2017). Only in the recovery did scholarship on ‘Generation Rent’ emerge, as homeownership rates fell below 70 per cent and renting expanded across traditional homeowner societies (Smith et al., Reference Smith, Clark, Ong Viforj, Wood, Lisowski and Truong2022).
This article mobilises the concept of precariousness to quantitatively compare the hardships faced by mortgagors and renters (private and social) during Ireland’s property market collapse and recovery, linking their divergent experiences to government policy choices. The concept of precarity has become central to social scientific analyses of how economic and social conditions generate vulnerability and shape individuals’ responses to socio-economic crises (Butler, Reference Butler2012; Kalleberg, Reference Kalleberg2009). Within housing research, the concept acts as a double signifier to (1) capture individuals’ lived experiences of housing unaffordability, tenure insecurity, poor quality and access (Clair et al., Reference Clair, Reeves, Mckee and Stuckler2019), and (2) illuminate the political economic and institutional drivers of precarity beyond the home. Growing scholarship documents how private renters, migrants and younger and older cohorts face precarious housing, and how such conditions intersect with wider material disadvantages, including energy poverty, poor health and labour instability (Bentley et al., Reference Bentley, Baker and Aitken2019; Petrova, Reference Petrova2018).
Building on gaps identified by Gielens et al. (Reference Gielens, Seo and Dewilde2026) and Debrunner et al. (Reference Debrunner, Hofer, Wicki, Kauer and Kaufmann2024), this study advances four contributions to this literature. First, it provides a longitudinal account of how housing precarity concentrates over time and compares its impact across housing tenures. Secondly, the field would benefit from an agreed set of indicators to measure housing precarity accurately and a coherent method for combining them. Thirdly, few accounts link the distribution of housing precarity to housing policy choices, particularly in response to economic or housing market crises. Finally, it examines the duration of precarious conditions, identifying which indicators persist longest across tenures and socio-economic groups.
The Irish case offers a stark example of the crisis impact on housing, while mirroring trends in similar ‘post-homeowner’ societies like the United Kingdom, United States and Australia, where private renting dominates among under-thirty-fives (Ronald & Kadi, Reference Ronald and Kadi2018). We show how political pressure on banks to limit defaults reduced mortgagor precarity from 2012, whereas limited social policy for renters left their precarity persistently high. We develop a Precarious Housing Index (PHI) to capture the multidimensional risks of housing precarity, moving beyond single indicators, and then compare key risk factors (i.e. income, household type, employment) across tenures and assess the strength of their effects. We critically reassess bailout policies that disproportionately favoured mortgagors and demonstrate how private and social renters faced more enduring housing hardships following the crisis. The paper first reviews existing literature on housing precarity, outlines the Irish context, presents the methods and findings, and concludes with implications for theory and policy.
Conceptualising precarious housing
Precariousness has become a significant focus of social research in recent years (Bolt & Darling, Reference Bolt, Darling, Münch and Siede2022; McKee et al., Reference Mckee, Reeves, Clair and Stuckler2017). Within cultural studies, precarity describes an inherent vulnerability arising from the relational structure of society (Butler, Reference Butler2012). This perspective interrogates lived experiences of socio-economic uncertainty and how differential exposure to precarity is shaped through societal structures. A second approach from labour studies emphasises how neoliberalisation has shaped employment instability, low incomes and weakened welfare provision (Kalleberg, Reference Kalleberg2009). For Standing (Reference Standing2014a, Reference Standing2018, Reference Standing2014b), these dynamics have created a new class – the ‘precariat’ – marked by shared vulnerability and social exclusion. Precarity therefore describes a state of uncertainty in which adverse events are more likely for vulnerable individuals. Both approaches highlight the concept’s multidimensionality, where one form of precarity (e.g. unemployment) can intensify other dimensions (e.g. ill health). The concept’s analytical strength lies in disentangling these overlapping risk elements across socio-economic domains of labour, health, housing, family and immigration.
More recently, precarity has been applied to housing, examining how vulnerable groups like migrants (Lombard, Reference Lombard2023) or low-income renters (Waldron, Reference Waldron2022a) navigate insecure housing systems. However, definitions of precarity vary, and there is little consensus among scholars. For Bolt and Darling (Reference Bolt, Darling, Münch and Siede2022), housing precarity encompasses unaffordable, insecure and poor-quality housing, including overcrowded or unsafe homes. Others define it through affordability and tenure insecurity, particularly for renters experiencing forced moves (Beer et al., Reference Beer, Bentley, Baker, Mason, Mallett, Kavanagh and Lamontagne2016), mortgaged homeowners threatened with foreclosure (Wood et al., Reference Wood, Smith, Cigdem and Ong2017) or broader housing instability, including homelessness (Burgard et al., Reference Burgard, Seefeldt and Zelner2012).
Numerous qualitative studies document the impacts of precarious housing, but rarely capture its multidimensional character consistently. Clair et al. (Reference Clair, Reeves, Mckee and Stuckler2019, p. 16) advance a replicable quantitative definition, where precarity is a ‘state of uncertainty which increases a person’s real or perceived likelihood of experiencing an adverse event, caused by their relationship with their housing provider, the physical qualities, affordability, security of their home and access to services’. Unlike narrower concepts like housing instability or deprivation, housing precarity integrates these four dimensions of households’ experiences within a single framework. First, cost overburden and unaffordability are strongly associated with poor health outcomes (Bentley et al., Reference Bentley, Baker and Aitken2019). Second, security of tenure is central, where arrears and missed payments can lead to evictions and foreclosure (Baker et al., Reference Baker, Lester, Bentley and Beer2016). Short-term leases, ‘no fault’ evictions and weak enforcement of rent regulations heighten private renters’ vulnerability to displacement (Lima, Reference Lima2020). The global financial crisis also exposed mortgagors’ vulnerability through mass mortgage defaults (Köppe, Reference Köppe2017). Third, poor housing quality deepens precarity. Overcrowding limits privacy and comfort, while damp, mould and insufficient heating impact health outcomes (Ruiz-Tagle & Urria, Reference Ruiz-Tagle and Urria2022). Finally, limited financial capacity (e.g. low income, insufficient savings) undermines households’ ability to meet housing costs and increases their eviction risk (Waldron, Reference Waldron2023).
Research has shown that exposure to housing precarity varies across socio-economic subgroups. Vulnerable populations such as migrants, students and low-income renters are disproportionately affected (Kemp, Reference Kemp2015; Soaita et al., Reference Soaita, Munro and Mckee2020). Yet, precarity increasingly extends into middle-income households, and even those with stable jobs and good incomes struggle with housing costs in high-demand cities (Waldron, Reference Waldron2022a; Waldron, Reference Waldron2024; Worth, Reference Worth2019). This expansion highlights how precarity now affects social strata once considered relatively secure.
While much research explores qualitative experiences of precarious housing, few studies quantitatively analyse its extent and trajectory over time. In a notable contribution, Clair et al (Reference Clair, Reeves, Mckee and Stuckler2019) develop an index of housing precarity from the EU-Survey on Incomes and Living Conditions (EU-SILC) by combining measures of affordability, quality, tenure security and access to services across thirty-one European countries. However, this cross-national analysis is limited to a single year (2012) due to data constraints. In response, Waldron (Reference Waldron2023) adapts this index to include a dimension related to the financial capacity of households, which allows the index to be applied across multiple years and includes area-based measures of precarity (e.g. perceptions of neighbourhood security). Yet, Waldron (Reference Waldron2023) restricts his analysis to renting households without a comparative analysis across tenures. Ong ViforJ et al. (Reference Ong Viforj, Singh, Baker, Bentley and Hewton2022a, Reference Ong Viforj, Singh, Baker, Bentley and Hewton2022b), using Australian panel data, develop a housing precarity measure based on whether a household has experienced a ‘forced move’ (i.e. eviction) and perceptions of neighbourhood safety, as well as measures of affordability and overcrowding. More recently, Debrunner et al. (Reference Debrunner, Hofer, Wicki, Kauer and Kaufmann2024) use survey data from six global cities to examine how vulnerable residents perceive dimensions of precarious housing, adding neighbourhood quality and community cohesion to traditional measures. Yet, none of these contributions consistently compares mortgagors and renters (both private and social), nor the differential impacts arising from the 2008 crisis and the selective policy responses. To address this gap, we analyse housing precarity trends during Ireland’s property crash and ‘recovery’ period (2008–2016), documenting how burdens were exacerbated for particular socio-economic and demographic groups in response to policy choices and economic priorities.
The economic and policy background of the Irish case
Ireland traditionally represented a liberal housing regime defined by mass homeownership, deep mortgage markets and an asset-based welfare model. Historically, 75 per cent of households were homeowners by the early 2000s, though this model is now being reshaped by widening wealth divides and growing landlordism (Byrne, Reference Byrne2020). Social housing is residualised, serving the poorest 10 per cent of households, while the private rental sector, which has doubled in size in the last decade and now accommodates 20 per cent of households, is particularly disadvantaged (Waldron, Reference Waldron2023). During the 2000s, Ireland experienced a pronounced property bubble and bust, driven by deregulation across its banking, housing and urban planning systems (Waldron & Redmond, Reference Waldron and Redmond2014). A ‘wall of credit’ precipitated a housing and construction boom, which escalated house prices and concentrated the economy within the construction sector (Williams & Nedovic-Budic, Reference Williams and Nedovic-Budic2016). This reliance was exposed in 2008, when global financial market contraction triggered a collapse in the Irish property and banking sectors, thereby decimating the public finances and requiring a state guarantee of bank liabilities. Nationally, house prices fell by over 50 per cent, while housing output fell by 90 per cent and many developers were bankrupted in the process or unable to access development finance (ibid).
While the crisis had far-reaching effects on the economy and society, the housing precarity of mortgaged homeowners and renters differed markedly and received varying levels of state support. Figure 1 highlights three key years covering the property bubble (2008), crash (2012) and recovery period (2016). Between 2008 and 2012, unemployment rose to 14 per cent while per capita GDP and median household incomes declined by 11 and 14 per cent, respectively (CSO, 2014). Irish house prices fell by 54 per cent between 2007 and 2012, pushing half of all mortgagors into negative equity (Waldron & Redmond, Reference Waldron and Redmond2016a; Waldron & Redmond, Reference Waldron and Redmond2016b), where they were unable to sell their homes without significant financial loss.
House price and rent index, Ireland and Euro Area (100 = 2015).
Source: OECD (2020), own presentation.

Falling incomes, unemployment and over-indebtedness precipitated a mortgage payments crisis. By mid-2012, one in five mortgages were in arrears (Central Bank of Ireland, 2012), concentrating among lower-income households with high loan-to-value mortgages and longer loan terms (McGuinness, Reference Mcguinness2011). Given the centrality of mortgaged homeownership to economic and social mobility in Ireland, a high level of repossessions was politically unconscionable. In response, the Government introduced a twelve-month moratorium on repossessions in 2010, and a Code of Conduct on Mortgage Arrears to ensure uniform treatment of borrowers by banks. Banks established Arrears Support Units, and a new policy of forbearance was emphasised, where banks were required to offer mortgage modifications, such as interest-only or reduced payments, term extensions, arrears capitalisation or a switch to a new mortgage product (Waldron & Redmond, Reference Waldron and Redmond2016a). Banks were set targets to resolve 75 per cent of arrears cases by 2014 or face higher capital requirements. As a result, very few cases resulted in home repossessions – just 8,200 homes were repossessed between 2009 and 2018, despite more than 92,000 arrears cases in 2012 (Burke-Kennedy, Reference Burke-Kennedy2018). Overall, the policy response for mortgagers was to mitigate insecurities as a result of the crisis.
For private renters, the crisis impacts were less immediate. In the short term, rents fell by 22 per cent between 2007 and 2012, aided by labour emigration and the growth of ‘accidental landlords’ who rented their properties rather than selling in negative equity (Duffy et al., Reference Duffy, Kelleher and Hughes2017). However, reduced incomes and unemployment also affected private renters. Rent arrears rose from 11 to 18 per cent between 2008 and 2012, comparable to the arrears rate among mortgagors (Waldron, Reference Waldron2023). Social housing estates, already facing deprivation, were further stressed as regeneration projects stalled under austerity conditions. A compounding difficulty for renters was the heightened restrictions on mortgage lending post-crash, where LTV ratios were limited to 80 per cent for existing mortgagors, and 90 per cent for first-time buyers, and loan-to-income ratios were capped at 3.5 times income. At the same time, economic growth returned strongly from 2013, when rising investor activity and strong population growth increased rental demand. Indeed, the number of renting households increased by 113 per cent between 2006 and 2016, while average rents surged by 32 per cent between 2012 and 2017 (Waldron, Reference Waldron2023).
Despite similar insecurities, policy interventions for renters, both private and social, lagged those for mortgaged homeowners. The Government introduced an expanded set of rent subsidies at the onset of the recovery, but not during the most severe crisis period. For instance, the Housing Assistance Payment and Rent Supplement was introduced in 2014, where the government pays the majority of a tenant’s rent directly to their landlord, and by 2022 this covered around 22 per cent of all tenancies (CSO, 2023). However, the scheme has been criticised as poor value for money, and for acting as a demand-side subsidy which has underpinned higher rents. In 2016, Rent Pressure Zones (RPZs) were introduced in areas with sustained annual rent inflation above 7 per cent, and thereafter limited increases to 4 per cent (later revised to 2 per cent in 2021). While RPZs cover 73 per cent of tenancies, enforcement gaps and exemptions have limited their effectiveness (Ahrens et al., Reference Ahrens, Martinez-Cillero and O’toole2019).
In sum, homeowners, particularly mortgagors, were affected more immediately and visibly by the risks of the global financial crisis, which prompted targeted policy interventions. Renters, particularly private renters, experienced the effects more indirectly and over a longer time horizon, with policy responses slower and more piecemeal. These differences highlight the uneven exposure to housing precarity and the need to measure it consistently across tenure types. By doing so, we can develop a more nuanced understanding of the cumulative effects of the global financial crisis on Ireland’s housing landscape, with lessons for the class distribution of insecurities in similar homeownership societies.
Methods
For the analysis of how housing precarity affected renters and homeowners during the financial crisis, we use nationally representative EU-SILC microdata for Irish adults in 2008, 2012 and 2016, capturing the onset, nadir and recovery of the financial crisis. The dataset captures all housing tenures, including outright and mortgaged homeowners, social and private renters. The yearly sample sizes range from 4,592 to 5,247 individuals, representing 38–42 per cent of interviewed households (Table 1). EU-SILC follows a four-year rotating panel, where one-quarter of respondents are replaced annually. Our selected samples are therefore cross-sectional, enabling comparison before, during and after the crisis. All estimates are weighted (euroweight) and control for stratified sampling by primary sample units.
Precarious housing index measures

Table 1. Long description
A table comparing housing precarity indicators across three years. The table has 6 rows and 4 columns. The columns are labeled Variable, EU-SILC indicator, 2008, 2012, and 2016. The rows are labeled Affordability, Security, Housing quality, Financial capacity, and Mean PHI. Row 1: Affordability, Housing costs a heavy burden, 18 percent, 34 percent, 28 percent. Row 2: Security, Rent/mortgage arrears in last 12 months, 1 percent, 10 percent, 1 percent. Row 2: Security, Crime, violence or vandalism in area, 13 percent, 11 percent, 9 percent. Row 3: Housing quality, Presence of leaks or damp, 7 percent, 6 percent, 6 percent. Row 3: Housing quality, Rooms insufficiently lit, 6 percent, 6 percent, 6 percent. Row 3: Housing quality, Pollution or environmental problems in area, 6 percent, 6 percent, 6 percent. Row 3: Housing quality, Lack of central heating, 6 percent, 6 percent, 6 percent. Row 4: Financial capacity, Making ends meet is difficult/very difficult, 20 percent, 31 percent, 26 percent. Row 4: Financial capacity, Unable to afford unexpected expenses, 40 percent, 53 percent, 43 percent. Row 5: Mean PHI, 0.1632, 0.2353, 0.1891. Row 6: N, 5247, 4592, 5219.
Source: EU-SILC.
Clair et al (Reference Clair, Reeves, Mckee and Stuckler2019) developed their ‘housing precarity measure’ using EU-SILC questions on affordability, quality, tenure security and access to services. However, since their index is limited to 2012, we employ Waldron’s (Reference Waldron2023) adapted measure, which captures four dimensions identified in the literature. Affordability relates to households reporting a ‘heavy burden’ on housing costs. For tenure security, EU-SILC records arrears on mortgage or rent payments within the previous twelve months, which serves as a proxy for eviction risk. A second indicator captures neighbourhood security, asking whether areas are affected by crime or vandalism, similar to Ong Viforj et al (Reference Ong Viforj, Singh, Baker, Bentley and Hewton2022a). The quality dimension identifies households experiencing two of four issues: damp, dark rooms, poor environmental quality and absence of central heating. Financial capacity is measured by difficulty in making ends meet and the inability to meet an unexpected expense (€1,000) from immediate financial resources. Together, these six items form the Precarious Housing Index (PHI) (see Table 1).
Each variable is assigned a binary coding and equal weighting, generating a linear index ranging from 0 (no precarity) to 1 (all six indicators). Although one could argue for differential weights to reflect the relative importance of differing indicators, doing so can present methodological challenges. Weighting can often create more difficulties than it resolves, particularly in the absence of consensus on the proportional contributions of variables, or reliable evidence on how unobservable factors should be incorporated. Consistent with Clair et al (Reference Clair, Reeves, Mckee and Stuckler2019) and Waldron (Reference Waldron2023), and in the absence of specific research on proportional weights, we assign equal weighting across indicators. Nonetheless, three of the six indicators relate to economic or financial aspects, meaning that, in practice, these categories contribute a greater weight to the overall index. A Cronbach’s alpha test assessed the internal consistency of the index, producing a score of 0.625, which is acceptable for survey measures (Taber, Reference Taber2018) and is comparable to the 0.50–0.83 range reported by Clair et al. (Reference Clair, Reeves, Mckee and Stuckler2019). Cronbach’s alpha is sensitive to the number of items in a scale, and shorter indices (<10 items) produce lower alpha values.
Our analytical approach proceeds in two stages. Firstly, we use the PHI to describe sample characteristics and examine temporal changes by tenure, disaggregating the index to highlight distinct risk profiles between renters (social and private) and owners (mortgaged and outright). Respondents are grouped into categories based on equal intervals: no precarity (0), ‘low’ (≤ 0.33), ‘medium’ (0.34–0.66) and ‘high’ (≥ 0.67). Secondly, we pool survey years and utilise standard linear regressions (OLS) to identify the main risk factors for housing precarity. The two key independent variables are year and tenure. Survey years account for the effect of the crisis period. For tenure, we merge renters in social housing with those living rent-free, labelling this group ‘social renters’, as the latter represent only 1.5 per cent of households.
We incorporate standard socio-demographic controls: household type, gender, age, country of birth, marital status and number of children. Built environment variables include the dwelling type (house or apartment) and location (urban or rural). Labour status is modelled as in-work, unemployed or other (including retirees, students, and homemakers). Income is measured in yearly quartiles to account for fluctuations in income across years. Educational attainment is categorised as primary, secondary, post-secondary (non-degree) and third-level qualifications. Finally, we include two variables on financial strategies. The ability to save income regularly is expected to reduce housing precarity, while a higher debt burden is expected to increase it. The latter variable is explicitly independent from mortgage debt and refers only to consumer debt. All variables are used as dummy variables, and only the number of children is used as an interval variable. Beta-coefficients are reported in all models to compare the relative weight of each variable.
The extent and nature of precarious housing in Ireland
Initially, we profile average trends in the Precarious Housing Index for the years 2008, 2012 and 2016. Table 1 shows how the average PHI rose from 0.16 to 0.23 between 2008 and 2012, before falling to 0.18 as the economy recovered from 2016. While the PHI’s components highlight the nuances of housing precarity, the composite index captures its overall extent and nature. Housing precarity can be understood as a continuum, where households range from ‘no difficulties’ to ‘high precarity’, experiencing multiple and compounding dimensions of hardship.
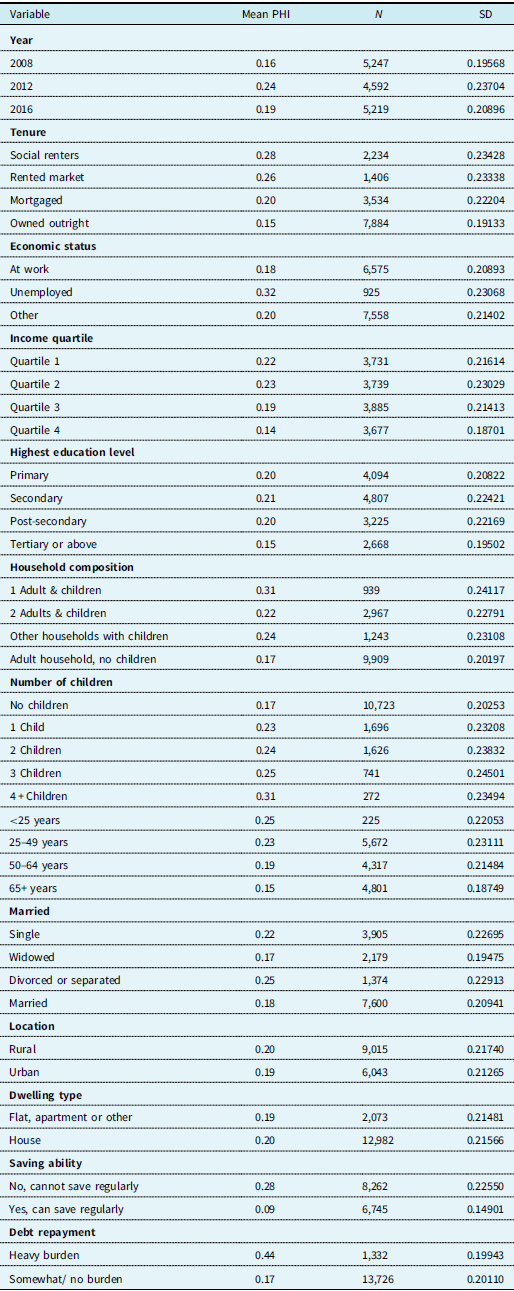
Table 2 elaborates on the relationship between housing precarity and individual variables. Clear disparities exist between tenures: average precarity was highest for social renters (28 per cent), followed by private renters (26 per cent), mortgagors (20 per cent) and outright owners (15 per cent). Social renting is a residualised sector, serving the poorest households in local authority estates where financial stress, poor quality, arrears and lengthy waiting lists have been longstanding (Norris, Reference Norris2013). The private rental sector, meanwhile, has long been considered a precarious tenure in Ireland owing to short leases, asymmetry between the rights of tenants and the interests of landlords and weak regulation. Affordability issues were accentuated post-crash by investor activity that fuelled rent increases (Byrne & McArdle, Reference Byrne and Mcardle2020; Byrne, Reference Byrne2020). Mortgagors, while enjoying greater tenure security, faced heightened arrears and repossession risks during the crisis, raising their precarity relative to outright owners. Yet even outright owners face risks, as older households may live in poor-quality homes with energy poverty and health implications.
Sample characteristics

Table 2. Long description
A table with 18 rows and 4 columns. The columns are labeled Variable, Mean PHI, N, and SD. The table presents data on various variables such as Year, Tenure, Economic status, Income quartile, Highest education level, Household composition, Number of children, Age, Married, Location, Dwelling type, Saving ability, and Debt repayment. Each row provides the mean PHI, number of observations (N), and standard deviation (SD) for each variable. For example, in the Year category, the data for 2008 shows a mean PHI of 0.16, N of 5247, and SD of 0.19568. The Tenure category includes Social renters with a mean PHI of 0.28, N of 2234, and SD of 0.21428. The Economic status category lists At work with a mean PHI of 0.18, N of 6575, and SD of 0.20893. The table provides a detailed breakdown of housing precarity across different variables.
Source: EU-SILC.
Figure 2 demonstrates the dynamic nature of housing precarity over time, offering a more developed perspective than Clair et al. (Reference Clair, Reeves, Mckee and Stuckler2019). Most notably, the proportions of those experiencing precarity rose sharply during the crash and declined with the recovery from 2016. At the crisis peak in 2012, two-thirds of Irish households reported some degree of housing precarity, while 16 and 11 per cent reported medium (0.34–0.66) or high (>0.67) levels, respectively. By 2016, high precarity cases fell sharply to 4 per cent, but medium (14 per cent) and low (37 per cent) levels remained elevated compared to pre-crisis figures.
Housing precarity trends, 2008–2016.
Source: EU-SILC.
Notes: Survey strata and weights are applied.

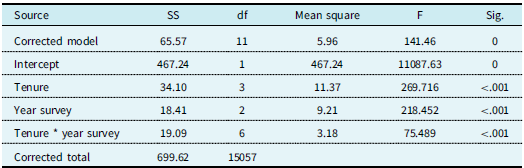
While overall shifts in housing precarity levels are revealing, the interaction between year and tenure is particularly significant. A two-way ANOVA confirms a strong relationship between these variables (Table 3; F = 75.489, p = <.001). Interestingly, tenure exhibited a stronger effect (F = 269.716, p = <.001) than year (F = 218.452, p = <.001), although both were statistically significant. In 2008, mean precarity for private renters (0.17) and mortgagors (0.16) was similar. Yet, by 2012 renters’ precarity increased more sharply (0.30) than mortgagors (0.26) (Figure 2). Crucially, while mortgagors saw a marked reduction in their overall precarity levels by 2016 (0.19), private renters’ scores remained elevated (0.26) in the recovery period. Indeed, the gap in mean precarity scores between private renters and mortgagors was actually wider (0.07) in 2016 than it was in either 2012 (0.04) or 2008 (0.01). Put another way, the proportion of mortgagors experiencing medium-to-high precarity fell from 32 per cent in 2012 to 19 per cent by 2016, while the proportion of renters only fell from 36 to 30 per cent over the same period.
ANOVA relationship between housing tenure and year

Table 3. Long description
A table with 6 rows and 6 columns. Column headers are Source, SS, df, Mean square, F, and Sig. Row labels include AQ2 ected model, Intercept, Tenure, Year survey, Tenure * year survey, and Corrected total. Row 1: AQ2 ected model, 65.57, 11, 5.96, 141.46, 0. Row 2: Intercept, 467.24, 1, 467.24, 11087.63, 0. Row 3: Tenure, 34.10, 3, 11.37, 269.716, <.001. Row 4: Year survey, 18.41, 2, 9.21, 218.452, <.001. Row 5: Tenure * year survey, 19.09, 6, 3.18, 75.489, <.001. Row 6: Corrected total, 699.62, 15057.
Source: EU-SILC.
Notes: Survey strata and weights are applied. R Squared = .09 (Adjusted R Squared = .09). R2
The radar chart in Figure 3 depicts the varying dimensions of housing precarity across tenures in 2012. Financial capacity was the most reported dimension, albeit this varied across tenures. While 42 per cent of outright owners reported financial difficulties, the figures for mortgagors (59 per cent), private (72 per cent) and social renters (86 per cent) were significantly higher. Housing affordability problems were more common among mortgagors (48 per cent) than private (41 per cent) or social (44 per cent) renters. Quality issues were negligible for mortgagors (2 per cent), somewhat elevated for outright owners (5 per cent) and private renters (6 per cent), but more problematic for social renters (12 per cent), where long-standing issues of overcrowding, poor maintenance and dereliction have been reported (Fahey, Reference Fahey1999). Finally, the security dimension of housing precarity was lowest among outright owners (9 per cent) and higher for mortgagors (23 per cent), private (25 per cent) and social renters (33 per cent), reflecting widespread concerns regarding mortgage and rent arrears that accompanied the financial crisis, and concerns regarding street safety within some disadvantaged neighbourhoods.
Radar plot of housing precarity dimensions by tenure, 2012.
Source: EU-SILC
Notes: Survey strata and weights are applied.

From a temporal perspective, some index components related to affordability and financial capacity increased more significantly during the crisis period. For example, in 2012, 34 per cent of households were experiencing heavy housing cost burdens, while only 18 and 28 per cent experienced this issue in 2008 and 2016. Comparatively, only 10 per cent of households were impacted by the variables relating to insecurity, such as the threat of eviction due to the presence of arrears or crime and vandalism in the area. However, the share of those affected by housing quality issues remained steady (6–7 per cent) throughout the boom-bust period. Furthermore, while all precarity variables declined in the post-crash period to 2016, some declined far more sharply (e.g. arrears from 10 to 1 per cent), while others remained elevated (e.g. housing cost burden at 28 per cent). As such, the different components of the precarity index are clearly affected by distinct and different causal processes, some of which will have more immediate or sudden effects (e.g. affordability), while others may be impacted by ‘slower burn’ processes of change (e.g. deteriorating quality). Nevertheless, we are interested in the overall housing precarity levels over time to answer our main question: how general levels of housing precarity have been associated with the crisis and tenure type? Therefore, the following section turns to multivariate models to disentangle this relationship.
The drivers of housing precarity across housing tenures
Table 4 disentangles the main risk factors of housing precarity and estimates the relative importance of each socio-economic factor. Six OLS regression models examine the effect of tenure and the global financial crisis on housing precarity (Model A). We then add interaction effects of year and tenure, followed by demographic (Model C), built environment (Model D), socio-economic (Model E) and financial (Model F) variables to iteratively test their relative and moderating effects. Across models, the number of observations is 15,057, with the adjusted R2 rising from .06 in Model A to .33 in Model F, indicating acceptable model fit for comparable general household survey studies.
Regression analysis (2008–2016)

Table 4. Long description
A table with six rows and thirteen columns comparing socio-economic factors affecting housing precarity from 2008 to 2016. The columns are labeled as Model A, Model B, Model C, Model D, Model E, and Model F, each with Beta values. The rows include Independent variables such as Year, Owned outright, Interaction year & tenure, Adult household, no child, Male, Married, Number of children, House, At work, Income quartile 4, Tertiary degree, and Able to save regularly. Each row provides Beta values for the different models. The table shows the relative importance of each socio-economic factor on housing precarity, with the adjusted R2 rising from .06 in Model A to .33 in Model F.
Source: EU-SILC.
Notes: Survey strata and weights are applied. *p ≤ 0.05 **p ≤ 0.01 ***p ≤ 0.001.
Model A demonstrates that both year and tenure significantly shape housing precarity. Compared to 2008, respondents in 2012 and 2016 reported higher precarity with effect sizes of .06 and .02. A one-unit increase in the PHI resulted in an additional .06 increase in 2012, persisting into 2016 at .02. Compared to outright owners, all tenure types face higher risk of precarity. The likelihood of precarity increases from outright owners to mortgagors, then to private renters and social renters. The effect size for private renters (.10) is double that for mortgagors (.05) and almost triple that for social renters (.13). The renter effect exceeds those of the crisis year and remains stable across models, moderated by controls. In conjunction with the interaction effects of the ANOVA, the key finding is that the tenure type is a stronger risk factor of housing precarity than the economic effects and policy responses of the global financial crisis.
Model B adds an interaction for tenure and year, thereby examining whether exposure to precarious housing across tenures is moderated by the crisis year. The R2 rises to .09, while the standalone effects for crisis year and tenure decline. The inclusion of interaction terms reverses the standalone crisis effect: all non-outright owners demonstrate elevated precarity, while outright owners face a lower risk. Similarly, the coefficient scores for tenure all reduce to 0, but the combined year–tenure effects increase markedly relative to outright owners in 2008. In 2012, the scores for private renters (.15), mortgagors (.12) and social renters (.23) all increase sharply and significantly. Put another way, when controlling for the combined effect of tenure and year, private and social renters experience an additional 15 and 23 per cent increase in the PHI relative to outright owners in 2008. By 2016, PHI scores declined as conditions improved, though the decline was sharpest among mortgagors. This interaction effect between year and tenure remains both strong and statistically significant throughout the other models that control for additional risk factors.
Models C to F find that the recovery from 2016 served to individualise precariousness, meaning that as we add individual risk factors, these outweigh the general crisis effects. While the 2012 slump remains a significant contributing factor to housing precarity, the effect size and significance for the recovery diminish as we add more control variables. This resulted in a dual recovery, where those with lower risk factors for housing precarity recovered, while those with continuous exposure to crisis risks were more likely to experience precarious housing.
Similar to Waldron’s (Reference Waldron2023) findings, the household type and presence of children are strongly associated with housing precarity. Single-parent households (.06) and those with more children (.02) face elevated precarity relative to adult households without children. Families with four children have the same effect on housing precariousness as a lone parent household. The costs of raising children compound existing housing expenses and increase vulnerability. Surprisingly, the results here show that gender is not a significant variable of precarity under any model.
Migrant households record slightly elevated precarity scores (.01) relative to Irish-born respondents, although the strength of the effect dissipates in Model F once the household’s saving and debt position is considered. Waldron’s (Reference Waldron2023) study found that migrants were more likely to be younger, employed full time and have higher incomes, meaning they were less exposed to traditional risk factors that might amplify a precarious housing situation. Married households have the least exposure to housing precarity, albeit the effect diminishes once labour market effects are considered. Married households are more likely to be two-income households but also enjoy tax advantages that others may not. Divorcees (.05) carry a housing precarity risk more than double that of single (.02) and widowed (.02) households, which demonstrates how the income effect might be amplified by the death of, or separation from, a partner. The financial risks of losing a partner are buffered through the welfare state (e.g. spousal pension benefits) and private insurance, while the costs of divorce are not covered by traditional welfare schemes.
The built environment variables (geographic location and property type) have no impact on the explanatory power of the model, as the adjusted R2 remains at 0.11. Urban dwellers are more vulnerable to higher levels of housing precarity (.01), but the effect is only significant when the household’s financial buffers are considered (i.e. ability to save and non-housing debt liabilities). Dwellers in apartments are less likely to be exposed to precarious housing (−.02), with a significant and consistent negative relationship observed across models. Apartments in Ireland are largely concentrated in the major cities, and the majority are modern builds constructed from the late 1990s. As such, apartment units might score higher on the quality dimension of the index than older housing stock.
Model E analyses socio-economic factors, like incomes, employment and education, as factors associated with housing precarity. Each influences precarity in the expected direction. Households headed by unemployed persons experience a .08 increase, while those in the two lowest income quartiles face .09 increases. It is clear, however, that the experience of precarious housing conditions extends up the income chain to affect even middle-income groups, as the effect remains significant for those in Quartile 3 (.05). Quartile 3 households average €50,534 in disposable income, compared to €13,239 and €27,451 in Quartiles 1 and 2. Indeed, the global financial crisis has revealed that mortgaged homeownership is no longer a sure bet for economic prosperity and that a ‘squeezed’ middle class increasingly struggles with insecure housing conditions (Shlay, Reference Shlay2015). Furthermore, the model reveals a strong and significant relationship between education and housing precarity. Those who completed only a primary (.04) or secondary (.03) education were significantly more likely to experience higher levels of housing precarity than someone with a third level qualification. Clearly, the experience of housing precarity is wrapped in wider social and economic inequalities with respect to labour markets, class positions and welfare provision.
When income, education, and financial variables are included, intergenerational disparities in housing precarity become more evident. Indeed, while age had a negligible effect in models C and D, it emerges as significant in Models E and F. Indeed, younger households aged under twenty-five years, those in the family formation age group (—twenty-six to forty-five years) and the middle aged (—fifty to sixty-four years) all display higher precarity scores than those aged over sixty-five years, though the effects are more pronounced amongst the young. These results echo Arundel and Hochstenbach (Reference Arundel and Hochstenbach2020) on generational divides in housing access and wealth, and the emergence of new socio-spatial inequalities in advanced economies.
Finally, the most significant increase in explanatory power of the model comes with the inclusion of the variables relating to the financial capacity of the household. The adjusted R2 jumps from .16 to .33 following the inclusion of these variables. Households who are unable to save income regularly (.14) and who experience their non-housing debt repayments as a heavy burden (.20) are significantly more likely to experience elevated housing precarity. Both variables emerge as the strongest risk factors of precarity across all models. It is the combination of low incomes, unstable employment and the limited financial reserves of households, and their reliance on credit to meet everyday expenses, that exposes households to the most severe experiences of housing precarity.
Robustness checks and limitations
Overall, this research charts the trajectory of housing precarity during Ireland’s property bubble and crash, though it is limited by available data. The EU-SILC uses a four-year rotating panel, meaning individuals can be surveyed for a maximum of four years. This constrains our ability to track changes in housing precarity across the longer cycle of crisis and recovery. While some individuals may endure temporary housing difficulties, others experience more persistent structural precarity. Yet the PHI index cannot fully capture such differences, nor all dimensions of housing precarity. For example, elements vital to specific groups, such as landlord discrimination against migrant renters, may be overlooked. Furthermore, it would be preferable to capture other dimensions of housing precarity – including the features of housing inaccessibility and the impacts upon well-being – described by others. Although the model fit is strong, a considerable share of the variation remains unexplained. Nevertheless, compared with other socio-economic variables, housing tenure and crisis year are among the strongest determinants of precarity, accounting for around 9 per cent of variation (ANOVA). It also highlights that further qualitative research is required to reveal underlying determinants of housing precarity and include these in future survey questionnaires.
Despite these limitations, the PHI provides a consistent and efficient means of monitoring national housing systems across tenures, identifying demographic sub-groups most exposed to economic, social or political shocks. Ireland’s severe post-crash context demonstrates the potential of the index as an annual monitoring tool to advocate for precarious households in a parsimonious way. At the same time, the components of the index are as important as the overall trend and a nuanced analysis of policy and precarity is required to induce generalisable policy responses in Ireland – let alone in Europe.
Discussion
Our starting point was that private and social renters’ experiences of housing precarity were overlooked politically during the financial crisis, which exacerbated their exposure to housing unaffordability, tenure insecurity and poor quality in ways that endure to this day (Waldron, Reference Waldron2024). Rescue packages for mortgagors neglected the higher prevalence and severity of precarity among renters. Our findings show tenure is a key contributor to housing precarity, independent of the crisis itself. While housing precarity rose sharply from 2008 to 2012, before moderating by the 2016 recovery, tenure effects remain more pronounced. Private and social renters are significantly more likely than mortgagors to experience precarious housing regardless of the observation period. Demographic, economic and labour market factors can mitigate or amplify risk at the household level, but renters remain exposed to a much higher degree overall.
Given the scale of the crisis, the muted political response to renters’ concerns is puzzling. In homeownership societies, rising house prices deepen intergenerational divides: older, wealthier homeowners gain while younger renters lose out economically and politically (Arundel & Hochstenbach, Reference Arundel and Hochstenbach2020). Yet, declining homeownership (Smith et al., Reference Smith, Clark, Ong Viforj, Wood, Lisowski and Truong2022) and widening precarity may increase the political constituency of renters. Housing has emerged as a decisive electoral issue across advanced economies and is linked to populist political dynamics (Adler & Ansell, Reference Adler and Ansell2020). Standing (Reference Standing2014a, p. 22) argued that the new precariat class ‘has yet to solidify as a class-for-itself’. In contrast, Ross (Reference Ross2008) had been much more sceptical that any movement could bridge the underlying imbalance of social capital between self-employed web designers and part-time cleaners, although citing the electoral success of left-wing movements. While Standing (Reference Standing2014a) postulated lower voting turnout among the precariat, research suggests precarious workers are more likely to vote for right-wing populist parties (Zhirnov et al., Reference Zhirnov, Antonucci, Thomeczek, Horvath, D’ippoliti, Mongeau Ospina, Krouwel and Kersting2023). What remains uncertain is the electoral effects of rising housing precarity (Waldron, Reference Waldron2021; Marsh, Reference Marsh, Coakley and Gallagher2010) and further analysis of partisan positioning on housing would show how renters’ structural precarity might shift party politics.
Relatedly, our analysis demonstrates a significant class dimension to the experience of precarious housing, whereby households with lower incomes, less secure labour status and lower levels of educational attainment all exhibit markedly higher levels of exposure. Those with weak financial buffers and limited savings capacity displayed precarity scores three times higher than those able to save income regularly. It is perhaps not surprising that more economically insecure groups experience greater housing precarity, but the HPI adds precision in measuring their exposure and can accurately specify the strongest statistical predictors. Furthermore, by introducing a scalar index, our findings reveal that housing precarity is extending into the ‘squeezed’ middle class, who face financial stress, economic instability and diminishing social status. Middle-class households in income quartile 3 exhibited a precarity score quite similar to low and low-to-middle income households from income quartiles 1 and 2. Following Standing (Reference Standing2014), housing precarity thus appears to be a widely held condition, affecting almost everyone up to the upper-middle class because of the individualisation of risk, and this is particularly pronounced amongst private and social renters. Mitigating such effects will require more universal policy responses. In liberal housing regimes, social renters are marginalised, while heavily means-tested policy schemes alienate middle-class voters. Rothstein (Reference Rothstein1998) argued that universal policies strengthen welfare state legitimacy, because middle-class voters benefit directly and support their continuity. Following this line of argument would mean that housing policies in liberal housing regimes have to reduce means-testing and bottlenecks to access key housing supports.
Our results highlight the important role that financial buffers play in mitigating the impacts of precarious housing. Higher savings and lower debt reduce vulnerability significantly, even when controlling for income. The level of consumer debt burden, which is independent of mortgage obligations in our data, further compounds precarity (Searle & Köppe, Reference Searle, Köppe, Martin and Pollard2017). Elevated debt can trap households into a spiral of precariousness. Financial literacy campaigns and access to debt advice can yield positive outcomes for overly indebted consumers, but the emphasis often tends to be on alleviating the debt problem rather than resolving it, and access to financial counselling is uneven (Stamp, Reference Stamp2012). Future research needs to further disentangle the ability to save, debt burdens, financial literacy and other financial strategies, and how these can contribute to, or mitigate against, housing precariousness.
Housing precarity is also shaped by conditions in the labour market and income disparities. Our analysis demonstrates that those in work with higher incomes are significantly less likely to experience precarious housing outcomes. Clear labour market penalties exist for single parents and families with children, which is reflected in their higher incidences of precarity. Future research should measure labour market precarity more consistently and how these relate to housing precarity. This would require in-depth analysis of interaction effects between key socio-demographic and labour market indicators to provide a more comprehensive understanding of this relationship.
Conclusions
The concept of precariousness has become a key focus of social scientific research, describing the risks generated by the neoliberalisation of the economy and society, and by greater labour instability, low incomes and weakening welfare provision (Kalleberg, Reference Kalleberg2009). It describes a state of uncertainty where vulnerable individuals face increased exposure to adverse events, particularly through insecure work, incomes and housing. Precarious living arrangements, arising from unsuitable, insecure, unaffordable or unsafe housing, can have wider detrimental impacts, including poorer wellbeing, health, social relations and long-term life planning (Lombard, Reference Lombard2023). While anyone can encounter precariousness, its distribution is structured by political, social and economic conditions (Bolt & Darling, Reference Bolt, Darling, Münch and Siede2022). Precariousness is thus complex and multi-faceted, spanning multiple and overlapping dimensions related to housing, welfare, work and mobility (McKee et al., Reference Mckee, Reeves, Clair and Stuckler2017). An experience of precarity in one domain of life (e.g. unemployment) might serve to exacerbate other aspects of precarious living (e.g. eviction from home). The concept’s utility lies precisely in exposing these overlapping and interdependent dimensions across labour, housing and welfare.
Our article explores precarious housing across tenures in Ireland during and after the global financial crisis. Contrary to the dominant narratives, we show that renters, and particularly social renters, experienced far greater precarity than mortgaged or outright homeowners. Precarious housing conditions spiked significantly in response to the crash, and remained elevated four years later, despite a significant rebound in the Irish economy. Mortgaged households were heavily impacted by affordability pressures and arrears at the crisis peak (2012), but these abated quickly following extensive policy interventions to limit repossessions. Social policy interventions to support private and social renters were less forthcoming, despite similar levels of arrears on their housing payments. While new restrictions have been imposed on rent setting since 2016, these responses have been criticised for a lack of enforcement and exemptions for landlords under certain circumstances (Ahrens et al., Reference Ahrens, Martinez-Cillero and O’toole2019); and were implemented after our observation period.
Although based on the Irish case, our findings have political and policy implications for similar liberal housing regimes. The decline in homeownership, the growth of the rental sector and widening housing wealth disparities are trends that are evident in cases including Australia, the United Kingdom and the United States (Köppe, Reference Köppe2017; Smith et al., Reference Smith, Clark, Ong Viforj, Wood, Lisowski and Truong2022; Wood et al., Reference Wood, Smith, Cigdem and Ong2017). Moreover, the applied Precarious Housing Index demonstrated a comprehensive understanding of housing insecurities and promises to advance our understanding of precarity when exploring further interactions between precarious housing conditions and other forms of material disadvantage in subsequent studies.
The analysis also reveals shifts in the population experiencing precarious housing during the crisis. Precarity was most acute among low-income households and associated risk factors, but it also extended into middle-income groups. Even mortgaged homeowners faced new strains, pushing precarity beyond traditionally marginalised groups and subtly shifting class boundaries. However, we challenge the dominant discourse that mortgagors suffered most during the crisis, as precarious housing remained much more common and severe among renters, particularly social renters. More importantly, tenure type is a much stronger risk factor associated with housing precariousness than the crisis itself, which underscores the structural disadvantage of renters in homeowner societies.
Acknowledgments
The initial idea for the article was developed during a Trinity Research in Social Sciences (TRiSS) visiting fellowship at Trinity College Dublin (TCD). Also thanks to the Monday Seminar series of the Political Science Department at TCD for critical discussions.
Funding statement
Part of this research was supported through a Senior Fellowship at the Hanse Wissenschaftskolleg (HWK), Institute for Advanced Studies.
Competing interests
The authors have no competing interests to declare.
Ethical standards
The research study has been approved by the UCD Ethics Committee as low risk (HS-LR-22-110-Koeppe).





 Open access

