

Introduction
In the absence of systematic colonial statistics for most of the nineteenth century, historians of Yorubaland have repeatedly turned to missionary archives for demographic evidence. Among those archives, the Church Missionary Intelligencer (CMI) has enjoyed unusual authority. Its published population figures for Yoruba towns and regions have circulated for more than a century through works on warfare, urbanization, evangelization, and political organization.Footnote 1 The attraction of the CMI is obvious: it seems to provide ready-made numbers for a period in which headcounts are scarce.
Yet the authority of the CMI has rested less on demonstration than on repetition. The famous table published in 1895 has often been treated as if it were a census-like baseline for late nineteenth-century Yorubaland, even though the table itself provided no explanation of method, mixed towns with regions, and drew together figures generated at different moments and under different circumstances. Once read as a transparent demographic source, it encourages a view of Yoruba population history in which the late nineteenth century already possessed urban totals on a scale that later scholarship sometimes naturalized as ordinary or stable.Footnote 2
As this article argues, the year 1895 should be treated as the date of CMI publication, not as the date of observation for all the figures it contained. Several entries were already circulating in missionary and official correspondence in 1886, while other items appear to have entered the missionary record through later travel, report-writing, and editorial consolidation. This article therefore begins analytically in 1886 and treats the 1895 CMI table as a printed compilation of older and uneven source layers rather than as a fresh enumeration of Yoruba towns in 1895.
This article argues that the 1895 CMI table was not a census and should not be used as one. It was, rather, a composite artifact of missionary intelligence: a printed digest assembled for metropolitan readers from reports of uneven date, uneven method, and uneven comparability. That argument does not require the opposite mistake of treating colonial censuses as neutral truth. The Nigerian censuses of 1911, 1921, 1931, and 1952–53 were themselves shaped by administrative expediency, uneven enumeration, tax logic, political pressure, and the practical limits of colonial rule.Footnote 3 The problem, then, is not to choose one archive over the other, but to specify what kind of evidence each source represents and what claims can responsibly be made from their comparison.
Methodologically, the article proceeds in three steps. First, it undertakes provenance analysis, disaggregating the 1895 CMI table into the reports from which its figures were drawn, identifying where possible the observer, date, unit of observation, and probable estimation technique. Second, it uses matched comparison: only those CMI entries that can plausibly be compared to later census units are set beside the colonial returns. Regional entries such as “Ijesha” and “Ekiti” are not treated as equivalent to later town counts. Third, it employs bounded demographic inference. Because the surviving Yoruba evidence does not permit a full reconstruction of births, deaths, and fertility rates before 1911, this is not a parish-register style historical-demography exercise. Instead, the rate formula used here is:

where P₀ is the earlier missionary or colonial estimate, Pₜ is the later census return, and t is the number of years between the two figures. The formula is used only as a plausibility test. It does not reconstruct birth rates, death rates, or migration rates.
A final point of method follows from that choice. The article does not attempt to produce a definitive replacement table for Yoruba populations in the 1890s. The surviving evidence is too heterogeneous for that. There is no serial run of comparable missionary tables, no continuous system of parish or civil registration, and no set of household-level enumerations from which a full historical-demographic reconstruction could responsibly be made. The aim is therefore narrower, but also more defensible: to classify the source, compare only like with like, and identify the range of demographic scenarios that the evidence makes plausible.
This framework recasts “triangulation” in a more precise way. The third point in the triangle is not a second numerical series; it is the qualitative historical evidence for population concentration and redistribution: warfare, refugee aggregation, emancipation, return migration, transport expansion, labor mobility, and changes in the geography of production. Read together, these sources suggest a more cautious conclusion. The CMI’s figures are valuable, but not as exact counts. They are better understood as indicators of missionary perception and wartime scale, filtered through a publication designed to show British supporters the size of the field to be evangelized.
The article’s aim is therefore not to recover the “true” population of each Yoruba town in the 1880s or 1890s, but to establish which inherited figures can be compared, which must be re-dated, which require correction, and which should be excluded from demographic comparison altogether.
The article’s contribution lies in demonstrating how such sources can be read critically without discarding them altogether. It is therefore framed not as an attempt to settle once and for all the population of late nineteenth-century Yorubaland, but as an exercise in evidentiary classification. That framing matters where the central question is not only whether a figure is right or wrong, but how numerical authority is produced, circulated, and embedded in later historiography. In that sense, this article asks readers to treat population numbers as archival statements with histories of their own.
Missionary intelligence, provenance, and the making of the 1895 table
The CMI was a missionary periodical intended to circulate news, statistics, and exhortation among supporters of the Church Missionary Society (CMS) in Britain. In its early formulation, the publication justified itself as a means of conveying “full, early, and authentic intelligence,” but it did so in the service of sympathy, prayer, and financial support, not detached statistical inquiry.Footnote 4 This institutional setting matters. As John Peel has argued for missionary archives more generally, missionaries produced records within organizational routines and evangelical priorities that shaped both what they observed and how they reported it.Footnote 5 Numbers in such a context did argumentative work. They displayed the size of the population to be reached, the magnitude of the labor required, and the significance of missionary endeavor.
That observation should not be caricatured into the claim that missionaries simply wrote whatever they pleased or that their reports went to print without scrutiny. CMS reporting followed routines; letters and reports moved through local and metropolitan channels before publication; and missionary statements were often subject to editorial shaping.Footnote 6 But organizational routine is not the same thing as statistical method. A mission could vet prose, standardize genres, and still publish numbers produced through rough estimation rather than formal enumeration.
That context does not invalidate every figure in the CMI, but it does shift the burden of proof. The 1895 table was printed without a methodological preface. It did not explain whether population totals derived from house counts, estimates by local informants, visual approximations of settlement extent, or analogy with other towns. Nor did it explain whether the listed units were towns, districts, mission fields, or wartime agglomerations. To use such figures responsibly, one must first ask how they were assembled.
The first methodological correction is chronological and bibliographical. The printed CMI table should not be read as a single 1895 act of enumeration. It is better understood as a composite missionary intelligence artifact in which the date of publication, the date of observation, and the date of later historiographical use do not necessarily coincide. For the purposes of this article, I distinguish three levels of evidence: first, figures traceable to Phillips’s 1886 wartime reporting from the interior; second, figures associated with later missionary tours and correspondence in the early and mid-1890s; and third, figures stabilized by CMI publication and subsequent citation. The demographic question is therefore not simply whether “the 1895 figures” were correct, but how observations made under conditions of war, movement, mission travel, and editorial selection became stabilized as if they were census-like data.
The most important clue is supplied by Charles Phillips, whose reports from the Yoruba interior fed several of the figures later printed in the CMI. In his 1886 report on the war in the interior, Phillips explicitly listed estimated populations for a number of Yoruba settlements, including Ondo, Ijebu Ere, Imesi-Ile (or Imesi-Ipole), and Ikoro. Those numbers were not the result of formal enumeration. They were missionary estimates, produced in the course of travel and observation, and almost certainly derived from rough calculations based on settlement extent, houses, and locally supplied information.Footnote 7 It must be noted that some entries in the 1895 CMI table were already years old when printed, and that at least one of them contained an obvious typographical error: the CMI’s “Ode Ondo, 1,500” should almost certainly read 15,000, the figure given in Phillips’s earlier report.Footnote 8
Once that provenance is reconstructed, the famous table begins to look much less like a single demographic snapshot and much more like a heterogeneous compilation. It combined observations from 1886 with later reports from the 1890s; it mixed towns with regional aggregates; and it rounded several places into neat numerical categories—60,000, 80,000, 100,000—that strongly suggest estimation rather than enumeration. In a source-critical article, that heterogeneity is not a side issue. It is the central fact about the table. Even more revealing is what the table omits. Ibadan, a city established by war refugees in the 1820s and by the late nineteenth century one of the major centers of the interior, does not appear at all in the printed list. Lagos, the colony’s chief port and already a crucial urban node, is likewise absent.Footnote 9 A document that omits such places while mixing towns and regions is plainly not an exhaustive census of Yoruba urban life.
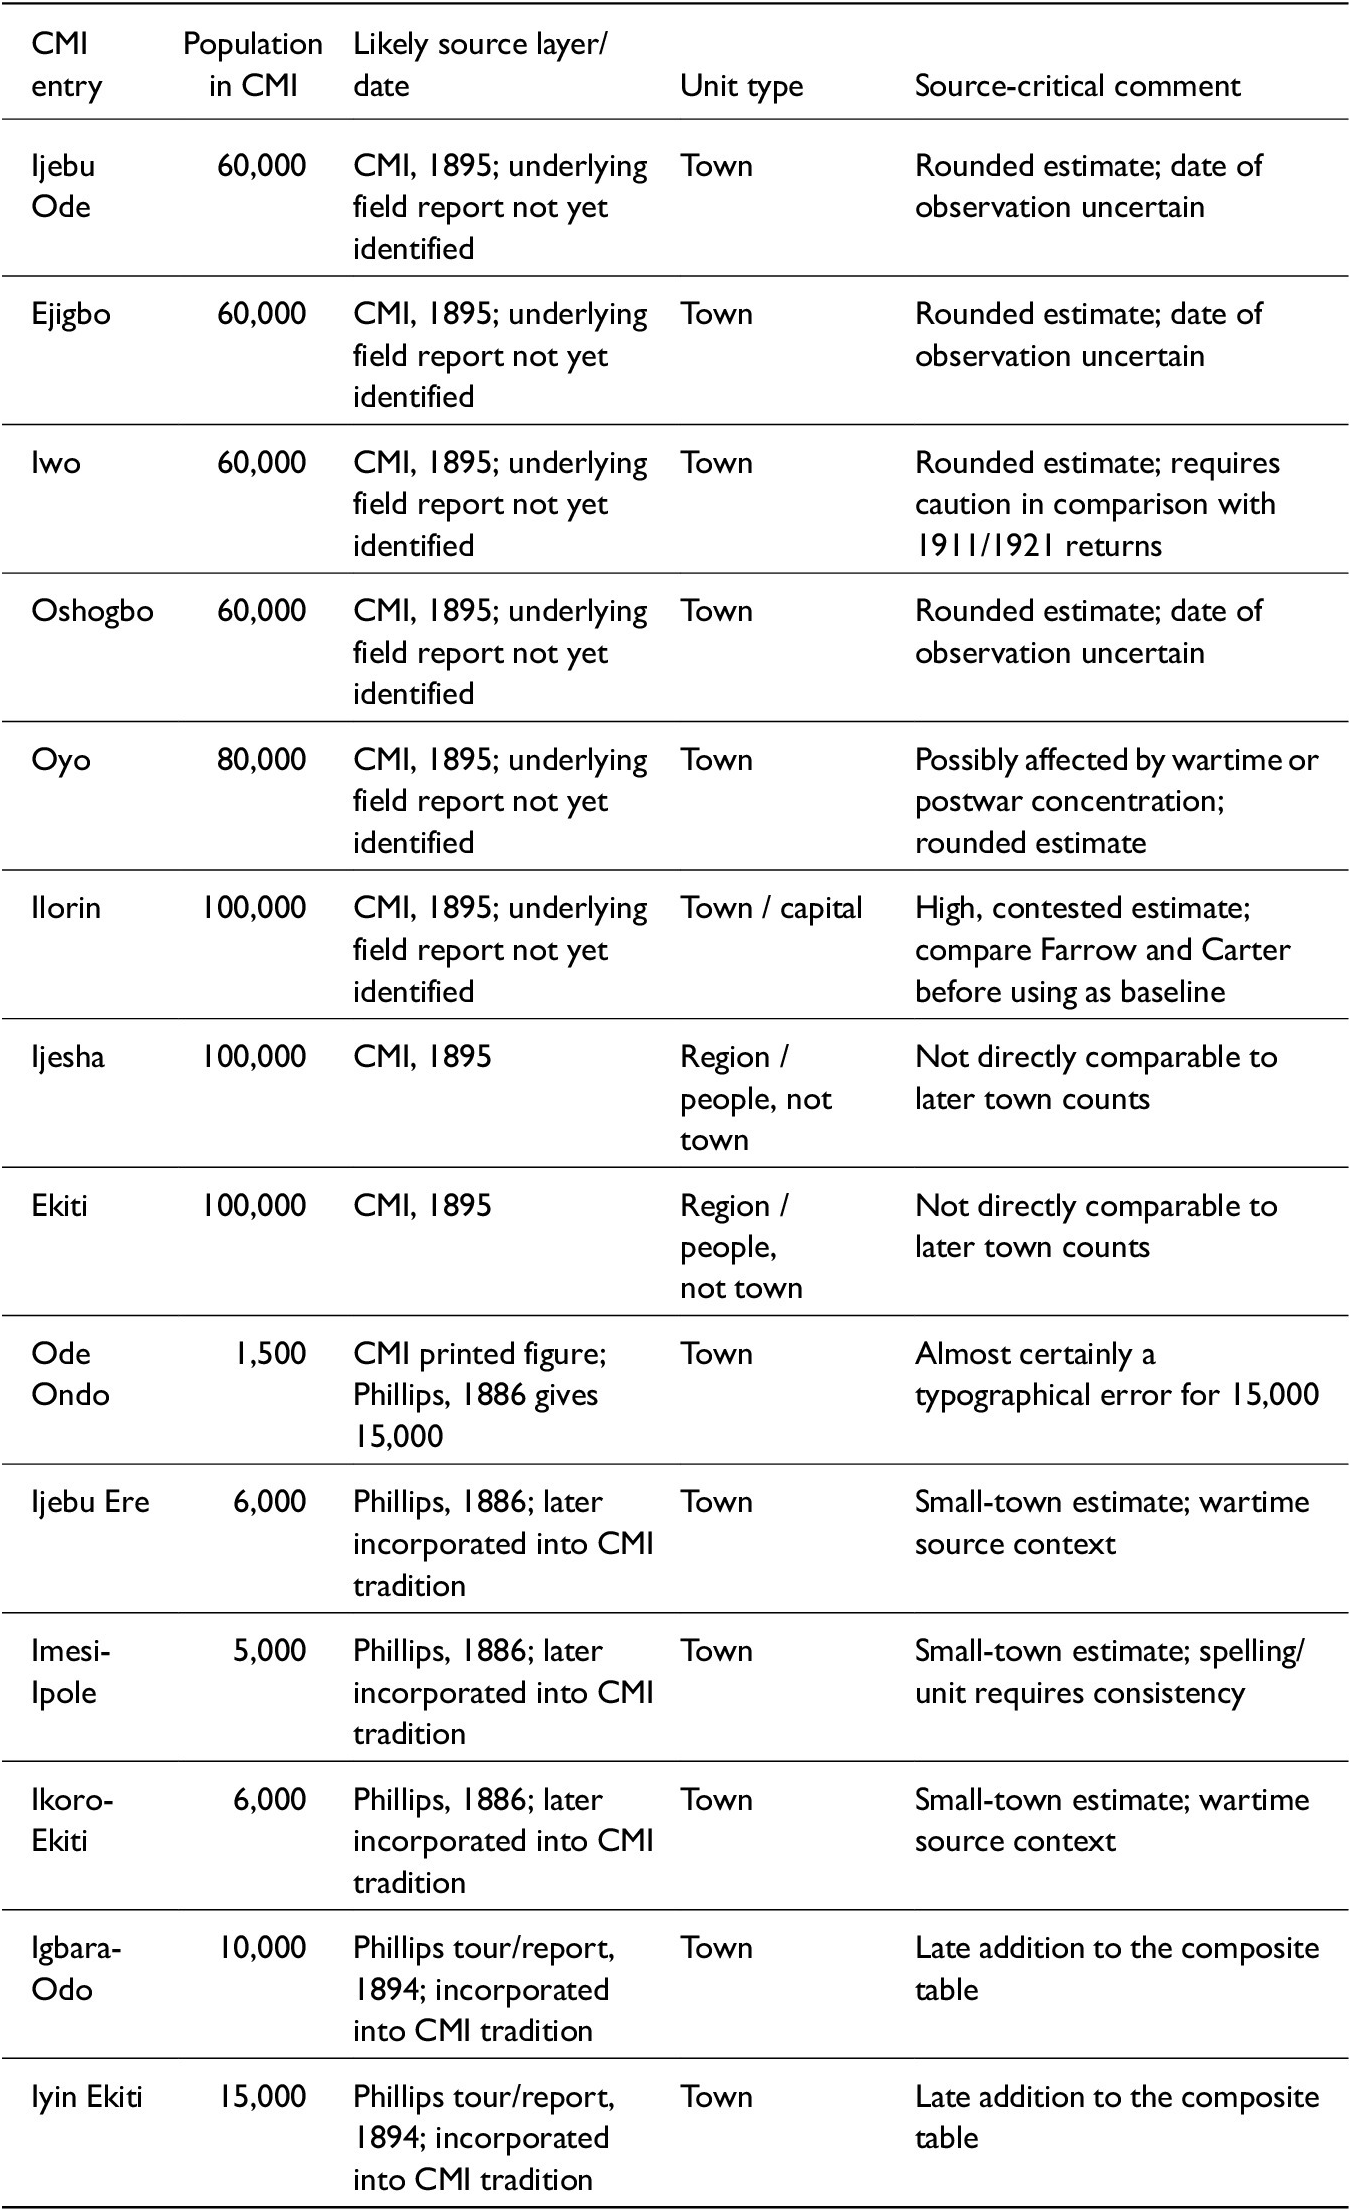
These distinctions are summarized in Table 1 below, which identifies the principal CMI entries, their likely source layers, their unit types, and the limits of their comparability with later colonial census returns.
Source layers and comparability of the principal CMI population figures

Table 1. Long description
The table contains 14 rows of data across five columns.
* Ijebu Ode: 60,000 population; C M I, 1895; Town; Rounded estimate with uncertain date.
* Ejigbo: 60,000 population; C M I, 1895; Town; Rounded estimate with uncertain date.
* Iwo: 60,000 population; C M I, 1895; Town; Rounded estimate requiring caution in comparison with 1911 or 1921 returns.
* Oshogbo: 60,000 population; C M I, 1895; Town; Rounded estimate with uncertain date.
* Oyo: 80,000 population; C M I, 1895; Town; Possibly affected by wartime or postwar concentration.
* Ilorin: 100,000 population; C M I, 1895; Town / capital; High, contested estimate.
* Ijesha: 100,000 population; C M I, 1895; Region / people; Not directly comparable to later town counts.
* Ekiti: 100,000 population; C M I, 1895; Region / people; Not directly comparable to later town counts.
* Ode Ondo: 1,500 population; C M I printed figure; Town; Likely a typographical error for 15,000.
* Ijebu Ere: 6,000 population; Phillips, 1886; Town; Small-town estimate in wartime context.
* Imesi-Ipole: 5,000 population; Phillips, 1886; Town; Small-town estimate.
* Ikoro-Ekiti: 6,000 population; Phillips, 1886; Town; Small-town estimate in wartime context.
* Igbara-Odo: 10,000 population; Phillips report, 1894; Town; Late addition to the composite table.
* Iyin Ekiti: 15,000 population; Phillips report, 1894; Town; Late addition to the composite table.
Note: The table distinguishes the date of CMI publication from the likely date or source layer of observation. “CMI, 1895” refers to the printed missionary compilation, not necessarily to a fresh 1895 enumeration. Entries associated with Phillips’s 1886 report should be treated analytically as late-war estimates, while the 1894 Phillips-tour entries appear to belong to a later layer of missionary intelligence. “Ijesha” and “Ekiti” are retained because they appeared in the missionary table, but they are excluded from direct town-to-town comparison with colonial census returns.
Sources: Church Missionary Intelligencer 46 (1895), 214; “Correspondence Respecting the War in the Interior,” British Parliamentary Papers, Command 4957 (1887), esp. 12-18.Footnote 10
The table’s internal pattern reinforces the provenance problem. Four towns are each assigned 60,000; Ilorin, Ijesha, and Ekiti are each assigned 100,000; Oyo receives 80,000. Such clustering makes best sense if missionaries were working with broad size categories. Earlier European descriptions of African towns often moved in exactly this way, inferring population from settlement extent or from analogies to known European cities. Bowen, for example, compared the extent of Abeokuta to New York, while much older travel literature had done something similar for Benin. The point here is not that Phillips or the CMI simply copied those precedents, but that rough visual estimation had an established place in European writing about African settlements.Footnote 11
Ilorin shows why this distinction matters. The round figure of 100,000 did not stand alone in the 1890s. Farrow’s 1893 visit, printed in the CMI in 1895, explicitly challenged inflated estimates of the town. After walking through Ilorin and viewing it from Sobi, Farrow judged that its population was not more than about 20,000 to 30,000. Other contemporary observers offered different impressions, but Farrow’s sharply lower estimate is sufficient to show that Ilorin’s population was already a matter of disagreement in the 1890s. Such variation is itself evidence. It shows that late nineteenth-century observers were not transmitting the result of a shared enumerative procedure; they were producing estimates under different conditions of travel, political access, informant mediation, visual approximation, and expectation about what a major Yoruba or frontier city ought to look like.
The consequence is methodological rather than merely corrective. A document constructed in this way cannot bear the weight of fine-grained demographic argument. It can indicate missionary perceptions of relative scale; it can register that some places struck observers as very large; it can reveal the categories through which missionaries translated Yoruba settlement patterns to British readers. What it cannot do, without further corroboration, is furnish an exact baseline for the stable population of Yoruba towns in the 1890s.
From missionary table to historiographical fact
The reason this source problem matters is that the CMI figures did not remain confined to missionary print culture. They migrated into scholarship and hardened into fact through repetition. Samuel Johnson’s History of the Yorubas did not reproduce the 1895 table mechanically, but Johnson moved within the same CMS documentary world and described urban scale in terms that closely paralleled the missionary estimates. Oyo appears as a large and populous capital; Ilorin as a city of very great size and consequence.Footnote 12 Johnson’s narrative authority helped stabilize a language of magnitude that later scholars sometimes read numerically rather than rhetorically.
By the 1920s the migration of these numbers into scholarly and administrative prose became easier to trace, although not always as simple as direct quotation. Meek’s Northern Tribes of Nigeria worked with the 1921 census and with ethnographic classifications in which Yoruba-speaking populations in the Northern Provinces appeared as a substantial political and demographic category. Talbot’s Peoples of Southern Nigeria similarly placed ethnological description beside official census abstraction. The historiographical danger lay in the subsequent juxtaposition of these official or quasi-official registers with older missionary estimates, often without sufficient attention to the different procedures by which each had been produced. Later writers could therefore move from missionary impressions to colonial census tables as if all belonged to a single numerical series.Footnote 13 Later historians of warfare and state formation likewise used the CMI’s figures as if they were serviceable benchmarks for the scale of displacement or the size of urban centers. In the influential volume War and Peace in Yorubaland, 1793–1893, G. I. O. Olomola’s chapter on the demographic effects of war treated the CMI table as a usable index of late nineteenth-century size, even while discussing the mobility and insecurity that should have warned against reading wartime concentrations as ordinary populations.Footnote 14
The distortion introduced by this reuse was subtle but important. The problem was not simply that later writers quoted numbers that were too high. It was that the CMI’s composite and wartime figures encouraged a particular chronology of Yoruba urbanization. If Ilorin, Oyo, Iwo, and Oshogbo already stood at 60,000 to 100,000 in the 1890s, then the dramatic urban growth recorded in the colonial period appears less like a historical transformation and more like a continuation of an already mature demographic landscape. That picture could coexist quite comfortably with a broader historiographical emphasis on the antiquity of Yoruba urbanism.Footnote 15 But the antiquity of Yoruba urbanism and the exact numerical size of late nineteenth-century towns are not the same claim. The first can remain true even if the second requires substantial revision. That distinction is worth underlining because it protects what is strongest in the older literature while correcting what is weakest in its numerical inheritance. The best scholarship on Yoruba political organization, settlement nucleation, and urban culture did not stand or fall on one missionary table. Yet once the CMI totals were folded into broader arguments about large, dense, permanent, and highly organized communities, the prestige of the larger interpretive claim could spill over into unwarranted confidence in the figures themselves.Footnote 16 Source criticism is needed precisely at that point where persuasive qualitative interpretation begins to naturalize fragile quantitative evidence.
For that reason, the critique advanced here is not a polemic against earlier Yoruba historiography. It is a narrower intervention into the evidentiary status of one particular numerical tradition. The issue is not whether historians were wrong to regard Yorubaland as one of the most urbanized zones in West Africa. The issue is whether the specific CMI figures should continue to function as the unquestioned quantitative baseline for that judgment. Once the provenance of the table is reconstructed, the answer must be no. That conclusion has consequences beyond the narrow question of numbers. It affects how historians model the scale of wartime concentration, the demographic basis of Yoruba political power, and the speed with which colonial-era urban growth should be understood. A town imagined at 100,000 in the 1890s invites one kind of historical narrative; a town treated more cautiously, as a place whose printed total may combine wartime aggregation, rough estimation, and later repetition, invites another. The historiographical gain is not to diminish Yoruba urban achievement, but to anchor it more securely in the logic of the sources.
Colonial censuses as comparators, not arbiters
Rejecting the CMI as a census does not license a naive reversal in which colonial enumerations become the court of final appeal. Scholars of Nigeria have long emphasized that colonial census-making was also historically constructed, politically interested, and methodologically uneven. Margery Perham’s contemporary assessment of the 1931 census remains useful precisely because it saw the problem early: administration in Africa frequently moved within a vicious circle in which inadequate knowledge impeded good administration, while weak administration impeded the production of adequate knowledge.Footnote 17 More recently, Dmitri van den Bersselaar has shown in detail that the 1921 census was a political and epistemic project in which administrative categories, local intermediaries, and colonial ambitions shaped the “facts” that emerged.Footnote 18 Morten Jerven’s broader critique of African statistics underscores the larger lesson: dubious numbers often become powerful precisely because they are repeated, aggregated, and institutionalized.Footnote 19
A brief chronology is useful at this point. Lagos had earlier counts beginning in 1871 and repeated at roughly decennial intervals, but the first enumeration intended to cover the wider Nigerian territory was the 1911 census.Footnote 20 Even that operation fell well short of a modern headcount. The 1921 census was more ambitious, the 1931 census improved some procedures while openly conceding defects, and the 1952–53 census was by far the most systematic colonial operation. What matters for the present article is not that one of these exercises finally delivered exact truth, but that together they provide a better-documented sequence against which missionary totals can be stress-tested.
The 1911 census was especially weak as a direct comparator. Outside Lagos, it did not proceed through a full modern headcount. In large measure it relied on information supplied by chiefs, local officials, and tax structures, with estimates of household composition used to move from countable adult males to total population.Footnote 21 That procedure did not simply introduce random error. It built undercounting into the logic of enumeration, especially where women, children, mobile dependents, or persons anxious about taxation and labor demands were less visible to enumerators. If one were looking for a final, exact answer to Yoruba population size, 1911 would plainly not provide it. The method also assumed household ratios that sat uneasily with Yoruba social realities. In large towns, polygynous compounds could contain multiple dependent families, clients, apprentices, and attached laborers; a simple multiplier from taxable adult males to total household population therefore risked serious distortion.
The report itself acknowledged that the so-called “native census” was not based on actual enumeration but on information secured from chiefs and related local sources.Footnote 22
The 1921 census was more ambitious, but its own report recognized uneven quality. Towns were counted differently from many rural areas; enumeration schedules varied; and the authorities themselves discussed margins of error and the need for post-enumeration correction.Footnote 23 Van den Bersselaar’s account of P. A. Talbot and the 1921 operation helps explain why: the census was not merely a neutral technical instrument but an administrative campaign in which African intermediaries, district officers, and central officials negotiated both method and meaning.Footnote 24
This is also why the distinction between town, district, and province matters so much for the present article. Colonial reports did not always preserve perfectly equivalent units across censuses, and later compilations sometimes collapsed urban centers into their wider administrative surroundings or, conversely, detached a town from a district that had previously framed it. Some of the apparent mismatch between missionary and colonial figures is therefore a problem of unit definition before it is a problem of demographic change. The article’s matched-comparison rule is meant to reduce exactly that error.Footnote 25
The 1921 operation deserves emphasis because its practical arrangement helps explain both its greater value and its continuing weakness. In towns, counting was often compressed into a short interval approaching a census day, whereas in the countryside enumeration could stretch over weeks. That asymmetry created room for both double counting and omission as people moved between town and village, market and farm, or workplace and home. The report also distinguished between towns judged relatively accurate and rural districts thought to require larger correction, suggesting additions of roughly 5 percent in the former and 10 percent in the latter.Footnote 26 The results were not immediately published: they were submitted to government only after further checking and appeared publicly only in 1926, a delay that itself suggests official awareness of the sensitivity and uncertainty of the figures.
The 1931 and 1952–53 censuses also came with their own limitations. The 1931 report explicitly conceded that figures for the South were defective, even if urban returns were generally more secure than countryside estimates.Footnote 27 The 1952–53 census was by far the most systematic colonial exercise, and it remains indispensable for long-run comparison, but it unfolded in a political environment in which census totals had obvious administrative and representational consequences. For northern Nigeria in particular, R. Mansell Prothero emphasized both the technical achievements of the 1952 operation and the stubborn difficulties of enumerating mobile and scattered populations.Footnote 28 In 1931 the official report conceded that the figures were “slightly defective” in the north and “much in defect” in the south, a phrasing that should permanently caution historians against treating any single return as self-validating.Footnote 29 The 1952–53 census, for all its improvements, was conducted over an extended field period and in an atmosphere of mounting political competition. Enumerators were trained and schedules standardized, but the very scale and duration of the exercise meant that duplication and omission could not be eliminated. The crises that later engulfed the 1962 and 1963 censuses only underscore a broader point already visible in the colonial period: counting population in Nigeria was always entangled with administration, revenue, representation, and distrust.
These defects matter, but they do not render the colonial censuses unusable. Rather, they tell us how to use them. First, the censuses are more persuasive when they show trends over time than when any single return is treated as a precise count. Second, urban figures are generally more valuable than rural aggregates, since towns were easier to delimit and enumerate. Third, the census reports’ own stated margins of error can be incorporated into analysis. Most importantly, the colonial series can test the CMI not because it provides perfect truth, but because it provides a different and better-documented mode of approximation. Once both archives are treated critically, their discrepancies become historically meaningful rather than simply embarrassing.
If neither missionaries nor colonial officials gave historians transparent truth, then the task is to ask what kinds of historical process could have produced the gap between them, and whether that gap is demographically plausible.
Formalizing the comparison: Matched units and plausibility tests
A first requirement of comparison is unit discipline. The CMI table cannot be compared wholesale with colonial returns because not all of its entries describe the same sort of entity. “Ijesha” and “Ekiti” are region-like entries and must be excluded from any town-to-town exercise. “Ondo” requires correction because the printed CMI figure is almost certainly a typo. “Iwo” presents another problem: the 1911 figure sometimes repeated in secondary compilations appears to echo the missionary estimate rather than an independent enumeration. For Iwo, therefore, the first more credible comparator is 1921, not 1911. Once these points are observed, a more defensible set of matched comparisons can be drawn. The selectivity of the CMI table matters here as much as its inaccuracy. The omission of Lagos and Ibadan indicates that the printed list was not even trying to offer a complete census of Yoruba urban hierarchy. It was a digest of missionary intelligence about places that entered the reporting stream. That is one reason the colonial series, for all its defects, remains indispensable: it gives a broader and more regular sequence against which to test the missionary totals.
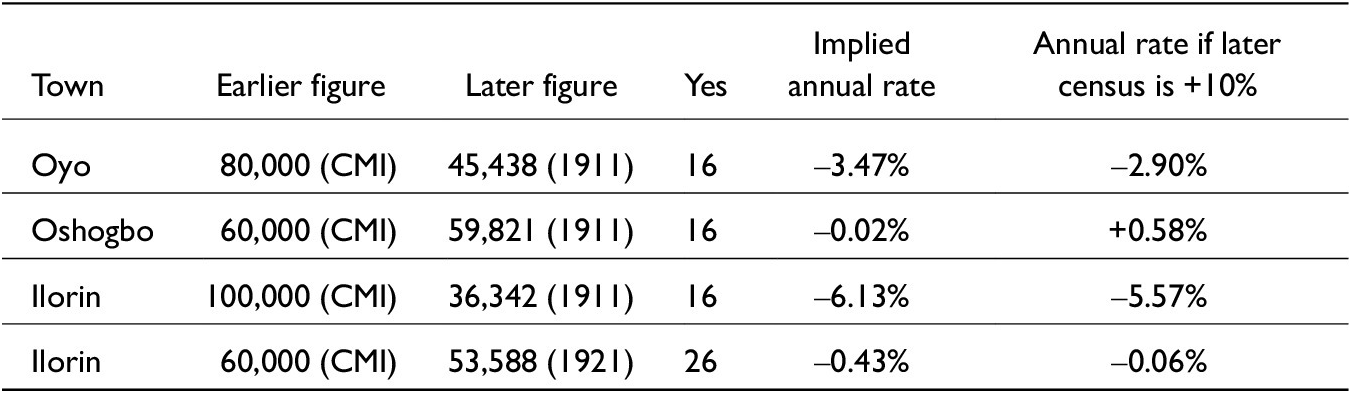
The comparison that follows therefore does not use the CMI publication date mechanically. Where a figure can be associated with the Phillips 1886 source layer, it is treated analytically as an 1886 estimate. Where the date of observation cannot be established, the table retains 1895 as the date of publication but marks the observational date as uncertain. This distinction matters because the chronological interval affects the plausibility test: a figure observed in 1886 and compared with 1911 implies a different rate of change from a figure first observed in 1895 and compared with 1911. The exercise is therefore not a census reconstruction but a test of what each inherited figure would require demographically if treated as a population baseline.
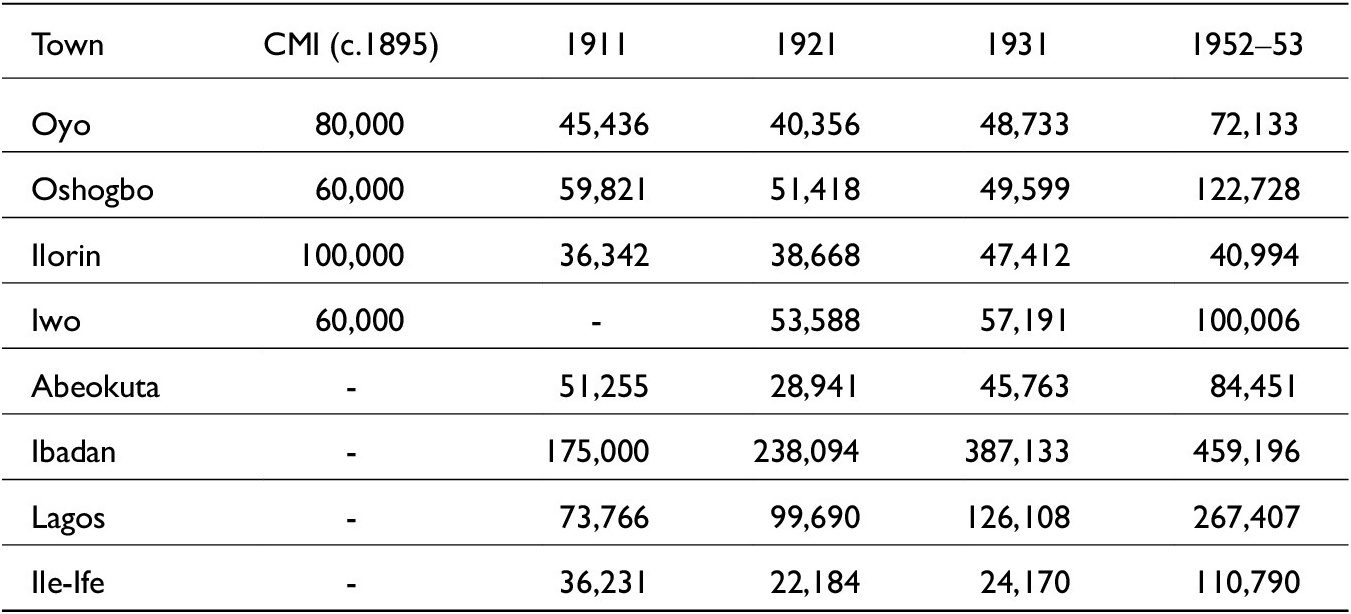
Two points stand out immediately. First, where the CMI and the earliest census can be directly compared, the missionary figures are frequently much larger. Oyo’s CMI total exceeds the 1911 count by roughly 43 percent; Ilorin’s exceeds it by roughly 64 percent. Second, the colonial series is itself uneven. Abeokuta and Ile-Ife decline sharply between 1911 and 1921, while Lagos and Ibadan grow. That pattern warns against any assumption that post-1893 peace automatically produced smooth urban increase everywhere.
Ilorin is the clearest example of why the CMI figure cannot be treated as a stable census baseline. If the round figure of 100,000 is treated as a late nineteenth-century population total and compared with the 1911 return of 36,342, the implied contraction is severe and demographically difficult to sustain without assuming extraordinary mortality, dispersal, or boundary change. Farrow’s lower estimate from 1893, however, changes the interpretation. If Ilorin was closer to 20,000–30,000 in the early 1890s, the 1911 figure does not represent collapse at all; it suggests either growth, boundary variation, or differences in what observers counted as “Ilorin.” A securely sourced Carter estimate of about 70,000 would imply an intermediate case. Ilorin therefore demonstrates the central source-critical point: the problem is not simply that one number was too high or too low, but that different observers were counting, seeing, or imagining different urban units.
This exercise yields the core demographic inference of the article. The discrepancy between the CMI and the colonial returns cannot be explained by a single factor. Census undercount alone is not enough, especially in cases such as Ilorin. Nor is it persuasive to say simply that the missionaries invented large figures out of thin air. The more plausible reading is mixed: some CMI figures reflected wartime concentration and postwar dispersal; some were rounded upward by rough estimation; some entries are not directly comparable; and the early colonial censuses, while still imperfect, moved closer to a count than the missionary table ever did.
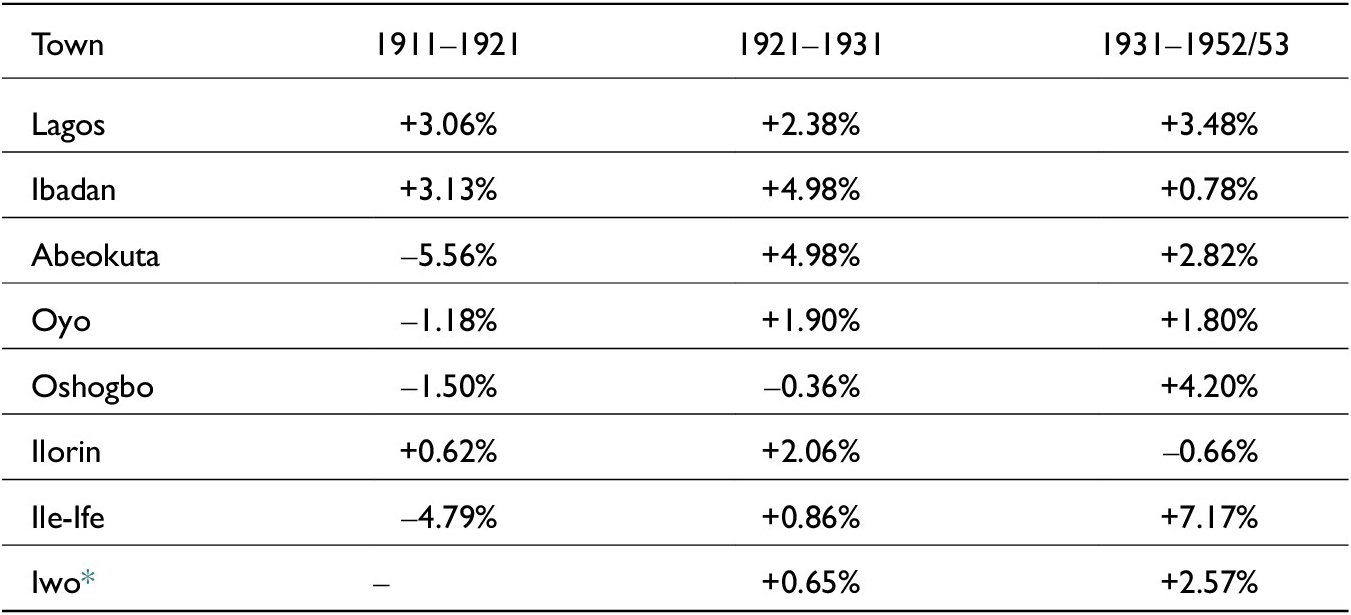
A second exercise brings out the article’s other key demographic point: the colonial series records differentiated urban histories rather than a single regional trajectory. Table 4 presents intercensal annual growth rates for selected towns using the 1911–1921, 1921–1931, and 1931–1952/53 intervals. The purpose, again, is not to treat the censuses as exact truth, but to make clear that the colonial sequence itself is uneven.
CMI figures and colonial census returns for selected Yoruba towns

Table 2. Long description
The table contains six columns: Town, C M I (circa 1895), 1911, 1921, 1931, and 1952–53.
* Oyo: 80,000 (1895); 45,436 (1911); 40,356 (1921); 48,733 (1931); 72,133 (1952–53).
* Oshogbo: 60,000 (1895); 59,821 (1911); 51,418 (1921); 49,599 (1931); 122,728 (1952–53).
* Ilorin: 100,000 (1895); 36,342 (1911); 38,668 (1921); 47,412 (1931); 40,994 (1952–53).
* Iwo: 60,000 (1895); no data (1911); 53,588 (1921); 57,191 (1931); 100,006 (1952–53).
* Abeokuta: no data (1895); 51,255 (1911); 28,941 (1921); 45,763 (1931); 84,451 (1952–53).
* Ibadan: no data (1895); 175,000 (1911); 238,094 (1921); 387,133 (1931); 459,196 (1952–53).
* Lagos: no data (1895); 73,766 (1911); 99,690 (1921); 126,108 (1931); 267,407 (1952–53).
* Ile-Ife: no data (1895); 36,231 (1911); 22,184 (1921); 24,170 (1931); 110,790 (1952–53).
Sources: Church Missionary Intelligencer 46 (1895), 214; Government of Nigeria, Census of Nigeria, 1911: Report; Census of Nigeria, 1921: Report; Census of Nigeria, 1931: Report; Government of Nigeria, Report on the Census of Nigeria, 1952–53; James S. Coleman, Nigeria: Background to Nationalism (University of California Press, 1963), 74.
Implied annual change if the CMI totals are treated as 1895 baselines

Table 3. Long description
The table consists of six columns: Town, Earlier figure, Later figure, Yes (representing years elapsed), Implied annual rate, and Annual rate if later census is plus 10 percent.
* Row 1: Oyo. Earlier figure 80,000 (C M I). Later figure 45,438 (1911). Years: 16. Implied annual rate: minus 3.47 percent. Adjusted rate: minus 2.90 percent.
* Row 2: Oshogbo. Earlier figure 60,000 (C M I). Later figure 59,821 (1911). Years: 16. Implied annual rate: minus 0.02 percent. Adjusted rate: plus 0.58 percent.
* Row 3: Ilorin. Earlier figure 100,000 (C M I). Later figure 36,342 (1911). Years: 16. Implied annual rate: minus 6.13 percent. Adjusted rate: minus 5.57 percent.
* Row 4: Ilorin. Earlier figure 60,000 (C M I). Later figure 53,588 (1921). Years: 26. Implied annual rate: minus 0.43 percent. Adjusted rate: minus 0.06 percent.
A note below the table explains that the 10 percent adjustment is a robustness test for colonial census undercounts and not a new population estimate.
Note: The 10 percent adjustment is not a revised estimate; it is only a robustness test using the order of undercount conceded in colonial census discussion. Compare the discussion of undercount and correction in Government of Nigeria, Census of Nigeria, 1921: Report, 1:14–16, and Government of Nigeria, Census of Nigeria, 1931: Report, 1:9–11. The 10 percent adjustment shown in Table 3 is only a stress test; it is not offered as a new population estimate.
Sources: Calculated from Table 2.
Intercensal annual growth rates for selected Yoruba towns

Table 4. Long description
The table consists of four columns: Town, 1911–1921, 1921–1931, and 1931–1952/53.
* Lagos: +3.06 percent, +2.38 percent, +3.48 percent.
* Ibadan: +3.13 percent, +4.98 percent, +0.78 percent.
* Abeokuta: minus 5.56 percent, +4.98 percent, +2.82 percent.
* Oyo: minus 1.18 percent, +1.90 percent, +1.80 percent.
* Oshogbo: minus 1.50 percent, minus 0.36 percent, +4.20 percent.
* Ilorin: +0.62 percent, +2.06 percent, minus 0.66 percent.
* Ile-Ife: minus 4.79 percent, +0.86 percent, +7.17 percent.
* Iwo: No data for 1911–1921, +0.65 percent, +2.57 percent.
A footnote indicates that for Iwo, the first comparable colonial figure used is 1921 rather than 1911.
* For Iwo, the first comparable colonial figure used here is 1921 rather than 1911.
Sources: Calculated from the census returns reported in Table 2.
No alternative 1890s population table is offered here. The evidence does not justify substituting one set of plausible-looking numbers for another. The purpose of the growth-rate exercise is more limited: to identify which inherited figures generate implausible demographic requirements, which figures remain within a plausible range once census error and redistribution are considered, and which entries must be excluded because their units are not comparable.
From war concentration to colonial redistribution, 1886–1911
Beginning in 1886 changes the interpretation of the evidence. The figures associated with Phillips belong to the late-war world of camp towns, defensive concentration, blocked routes, slave raiding, and refugee aggregation, not to a settled postwar urban order. By 1895 some of those estimates had acquired the authority of print, but the social geography that produced them had already begun to shift. The analysis must therefore move from a late nineteenth-century wartime field of concentration to an early twentieth-century colonial field of redistribution.
If the formal comparison suggests that the CMI often captured something other than stable town population, the historical question becomes what that “something” was. The answer lies in the social geography of the Yoruba wars and their aftermath.
The nineteenth-century Yoruba wars profoundly reworked settlement patterns. Warfare, raiding, the collapse of the Old Oyo order, and the militarization of regional politics pushed populations into defensible and politically significant centers. Refugees clustered in walled towns and military camps; chiefs and war leaders concentrated dependents; routes of insecurity reshaped ordinary movement. Ibadan itself was a product of this violence: a city established by war refugees in the 1820s, it became the major military power of the interior and one of the principal receivers of people displaced by conflict.Footnote 30 Abeokuta likewise functioned as a refuge city, while Oyo’s old metropolitan authority had to be reconstituted after prolonged disruption.Footnote 31
In such a context, unusually large urban concentrations are entirely plausible. But plausibility must be specified correctly. Wartime concentration is not the same thing as stable civic population, and a city swollen by refugees at one moment cannot automatically be treated as the normal baseline for the next generation. That distinction matters greatly for a source such as the CMI, whose 1895 table was assembled in the immediate aftermath of the conflicts and from reports, some of which predated final pacification.
The transition to British rule intensified this movement. Treaties, military intervention, road security, and the weakening of coerced dependency altered the conditions under which people could leave towns, compounds, and patrons. Former slaves, pawns, war captives, refugees, and junior dependents did not all move in the same direction, but peace widened the menu of movement.Footnote 32 Some returned to older home areas; others sought farming land, market access, mission education, wage opportunities, or protection under new administrative arrangements. A town that appeared very large during the late-war or immediate postwar moment could therefore appear smaller in an early colonial return without implying catastrophic mortality.Footnote 33
This is the point at which the qualitative third arm of the triangle becomes indispensable. The discrepancy between missionary and colonial numbers is historically intelligible only when one recognizes that the late nineteenth and early twentieth centuries did not merely witness “growth” or “decline,” rather they witnessed redistribution. Refugee towns lost some of the populations that war had piled into them. New colonial transport routes and commercial frontiers attracted movement elsewhere. The population history of Yorubaland after 1893 was therefore less a single upward curve than a series of reallocations across towns, countryside, and emerging corridors of production.
Transport infrastructure was one mechanism of that redistribution. Railway construction from Lagos reached Ibadan by 1901 and linked further interior nodes in the following decade.Footnote 34 Road construction was likewise central to colonial policy, as both official reports and administrative correspondence make clear.Footnote 35 Better communications did not automatically enlarge every town. They changed the terms of mobility. A person no longer had to remain in a wartime refuge to pursue security or subsistence. Movement toward railway towns, markets, administrative centers, and cocoa-producing zones became easier. Young men could seek wage employment or apprenticeship beyond their immediate home districts; traders and carriers could work emerging road and rail corridors; and towns with railway stations or improved roads acquired new significance as nodal points in colonial exchange. Movement was therefore no longer organized primarily by wartime security. It was increasingly organized by access to markets, transport, administration, and education.Footnote 36
So did agrarian relocation. The expansion of cocoa cultivation in southwestern Nigeria shifted the geography of opportunity. Studies of Yoruba and Nigerian cocoa farming have long emphasized the importance of frontier settlement, labor movement, and the attraction of new producing zones.Footnote 37 Some populations moved not toward the biggest old cities but toward agrarian districts where land and cash-crop prospects mattered more than inherited status in wartime centers.Footnote 38 That process helps explain why a crude contrast between “urban growth” and “rural stagnation” cannot capture the early colonial demographic picture.
None of this means that every decline between 1895 and 1911 reflects only redistribution. Census error remains part of the story. But redistribution gives historical shape to the numbers. It explains why some places later counted by colonial authorities could be markedly smaller than the missionary table had suggested without requiring us to believe that missionaries simply fabricated the existence of large populations. Wartime aggregation, emancipation, return migration, and commercial reorientation together offer a much more satisfying explanation.
Urban change after 1911: Trends, not exact counts
The distinction is chronological as well as numerical. Nineteenth-century urban concentration was often produced by insecurity: people gathered where walls, warriors, chiefs, patrons, or refugee communities offered protection. Twentieth-century urban growth increasingly followed a different logic: railway access, administrative employment, mission schooling, wage labor, commercial farming, cocoa wealth, and colonial markets. A single language of “urbanization” therefore obscures two different mechanisms of concentration. The large late nineteenth-century town and the expanding twentieth-century colonial city were not always products of the same demographic process.
Once the analysis moves past the immediate postwar transition, the colonial series becomes more useful. Here the key is again not exactitude but trend. The census figures for Lagos and Ibadan, despite all caveats, show sustained long-run increase. Lagos rose from 73,766 in 1911 to 267,407 in 1952-53; Ibadan from 175,000 to 459,196 over the same period.Footnote 39 Those trajectories are difficult to dismiss as mere statistical noise. They reflect a deepening concentration of administrative, commercial, educational, and transport functions in a limited number of urban centers. The later colonial city was not simply a larger version of the wartime refuge town; it was a node in a changing regional economy.
Understood in this way, the migration picture can be specified more clearly. By the 1920s and 1930s three broad streams are visible: rural-to-urban movement into major commercial and administrative centers; rural-to-rural movement toward cocoa-producing frontiers and other agrarian opportunity zones; and smaller urban-to-rural or town-to-home return flows associated with retirement, unstable employment, or agrarian investment.Footnote 40 The labor reports of the 1940s capture the official perception of this shift. In 1943 the Department of Labour noted that movement toward towns had become a pressing administrative concern; by 1950 officials were linking urban attraction to labor shortages elsewhere and to the uneven regional distribution of young adults.Footnote 41
The rural-to-rural component of this story deserves emphasis because it complicates any simple city-versus-countryside model. Cocoa expansion drew labour, capital, and household relocation into forest and frontier zones rather than only into the largest cities. Some migrants moved seasonally; others established new farming households in producing districts while maintaining ties to older home communities.Footnote 42 At the same time, a smaller but important urban-to-rural stream remained visible as returned clerks, ex-soldiers, retired employees, and town-dwellers invested in farming or reattached themselves to home localities.Footnote 43
The same is not true of every Yoruba town. Abeokuta, Oyo, Oshogbo, and Ile-Ife all exhibit more uneven paths. Abeokuta’s drop between 1911 and 1921 is too large to be read simply as natural decrease; it likely combines census inconsistency with the unwinding of earlier concentration. Oshogbo’s figures remain fairly flat until the mid-twentieth century, when the town’s railway and commercial significance become more visible. Oyo fluctuates and only approaches the missionary figure again in 1952–53. Ilorin, despite its later postcolonial expansion, remains far below the CMI’s 100,000 through the whole colonial sequence presented here.Footnote 44
Education also mattered. Mission schools, teacher-training institutions, and the clerical opportunities attached to government and commercial offices concentrated disproportionately in larger towns. The attraction of Lagos and Ibadan was therefore not only economic in the narrow sense of wages and markets; it was also social and aspirational. To move to such towns was to pursue literacy, new occupational identities, and access to colonial institutions.Footnote 45
These differences matter historiographically. They show that it is misleading to flatten Yoruba urban history into a single story of continuous large-city growth from the nineteenth century onward. What the best available evidence supports instead is a more differentiated chronology. Yoruba society had a long and important tradition of nucleated settlement and urban political culture. But the especially rapid and sustained growth of a few major centers – above all Lagos and Ibadan – was a twentieth-century process, tied to colonial state formation, wage labor, mission education, commercialization, and changing regional mobility.Footnote 46
That conclusion is consistent with the major literature on Nigerian urbanization. Mabogunje’s classic analysis stressed precisely the interplay among transport, migration, commercial opportunity, and administrative centrality.Footnote 47 Falola’s study of Ibadan showed how colonial political economy deepened the city’s gravitational pull rather than merely preserving an older equilibrium.Footnote 48 In this sense, the colonial censuses are most valuable when they are read as indices of transformation. They do not settle every numerical dispute, but they make it difficult to retain the CMI’s late nineteenth-century figures as an uncomplicated baseline.
Historiographical consequences
What, then, follows for Yoruba historiography? First, the article supports a narrower and more defensible claim. The article does not argue that earlier scholarship on Yoruba history is invalid because some authors used missionary numbers. Nor does it argue that the Yoruba wars produced no large urban concentrations. The claim is instead that one influential numerical tradition – the 1895 CMI table – has been used with too little attention to genre, provenance, and comparability.
Second, the article suggests a specific correction to the chronology of urban scale. Historians should be cautious about treating the CMI totals as evidence that multiple Yoruba towns stably contained 60,000 to 100,000 inhabitants in the mid-1890s. The table certainly testifies to large settlements and to a region in which urban political forms were deeply rooted. But because it was a composite missionary intelligence document rather than a formal count, it cannot securely ground fine numerical claims about ordinary town populations. Where later scholarship has moved from those figures to an image of extraordinarily large and settled nineteenth-century urban totals, that image should be qualified.Footnote 49
Third, the article sharpens the methodological lesson for using the CMI as an archive for historical reconstruction. Missionary print culture and colonial census culture were not simply rival archives; they were distinct regimes of knowledge production. The CMI converted field impressions into metropolitan intelligence under evangelical imperatives. Colonial censuses converted administrative need into numerical approximation under fiscal and political constraints. Both are usable, but only after historians identify their production contexts, internal units, and likely errors. The question is not whether one archive is ideological and the other empirical. Both are historical artifacts. What differs is the form of their approximation.
Beyond Yorubaland: A broader African demographic method
The method proposed here is not confined to southwestern Nigeria. Similar source constellations appear across African history: missionary estimates preceding formal enumeration; colonial statistics produced for administrative rather than analytical ends; and later historiography treating both as if they were transparent data. John Iliffe’s work on Tanzania, Marcia Wright’s reflections on missionary archives, and the critical literature on Gold Coast and Ghanaian census-taking all point toward the same methodological imperative: numbers must be read in relation to how they were made.Footnote 50
That broader relevance is important because the temptation to replace one problematic archive with another is a recurring one in African demographic history. Where missionary numbers are weak, historians often rush to colonial statistics; where colonial counts are defective, they may retreat into unexamined missionary observation. The alternative modeled here is more modest and, for that reason, more powerful. One begins by disaggregating the source, matching comparable units, and using demographic calculation not to manufacture precision but to test plausibility. Such a method does not solve every problem. It does, however, prevent the easy naturalization of inherited figures.
Recent work on census politics beyond colonial Nigeria reinforces the point. Studies of Ghana’s census history, for example, show how counting practices were entangled with political imagination, publicity, and distrust, even when the technical apparatus of enumeration appeared more modern than earlier colonial exercises.Footnote 51 The lesson is not that numbers are useless. It is that they become historically useful only when their production contexts are made part of the analysis.
The same method also points toward a practical research agenda. In the Yoruba case, future work could profitably link the CMI table to surviving CMS annual letters, station correspondence, district notebooks, cartographic materials, and archaeological work on settlement extent. Such sources will not yield a magical definitive count for the 1890s, but they may clarify how particular estimates were generated, repeated, and transformed as they moved between field stations, mission headquarters, print culture, and colonial administration.Footnote 52
Conclusion
This article has argued that the population figures printed in the CMI in 1895 should be read as a composite missionary intelligence artifact, not as a census of Yoruba towns and not even as a single 1895 snapshot. Some entries drew on report layers reaching back to 1886; others reflected later missionary travel or uncertain editorial compilation; several were rounded; and at least one appears to contain a typographical error. The issue is therefore not merely accuracy, but archival temporality: publication date, observation date, and later citation history cannot be collapsed into one.
At the same time, the article has rejected the easy remedy of treating colonial census returns as self-evident truth. The Nigerian censuses of 1911, 1921, 1931, and 1952–53 were themselves historically situated approximations. Yet once their limitations are acknowledged, they remain valuable comparators – especially for trends and for urban places more amenable to enumeration. When matched carefully against the CMI, and when read together with the historical evidence for war, emancipation, migration, transport, and agrarian reorientation, they support a restrained but significant conclusion: the CMI’s larger numbers often captured wartime or postwar concentration and missionary perception rather than stable peacetime populations.
The broader implication is historiographical rather than merely numerical. Yoruba urbanism does not need inflated missionary figures in order to remain historically important. What needs revision is not the existence of Yoruba cities, but the numerical confidence with which late nineteenth-century urban scale has sometimes been described. A more defensible chronology sees a region with deep urban traditions, substantial wartime concentrations in the nineteenth century, and especially powerful urban acceleration in selected centers during the colonial twentieth century.
That is also this article’s methodological claim. Source criticism in African demographic history should not aim prematurely at exact replacement figures when the archive will not sustain them. It should begin with provenance, comparability, and plausibility. In that sense, the Yoruba case is not merely a local correction. It is an example of how historians can work rigorously with bad numbers without either surrendering to them or discarding them altogether.
A final implication follows for archival practice. Missionary tables, colonial censuses, district reports, labor memoranda, transport files, and local histories should not be mined in isolation and then combined only at the point of citation. They should be read against one another from the start, with close attention to genre, audience, chronology, and unit of observation. Where exact reconstruction is impossible – as it often is in African historical demography – the task is not to retreat into impressionism. It is to make uncertainty explicit, to bound inference formally where possible, and to let the archive determine the scale of one’s claims. That, ultimately, is the lesson of the Yoruba case: rigorous historical method does not eliminate imperfect evidence, but it can prevent imperfect evidence from hardening into orthodoxy.