




No CrossRef data available.
Article contents
FMRI correlates of the WAIS–III Symbol Search subtest
Published online by Cambridge University Press: 01 July 2005
Abstract
Functional magnetic resonance imaging (FMRI) experiments frequently administer substantially adapted cognitive tests. This study was designed to identify FMRI correlates of a well-standardized clinical measure presented with minor adaptations. We administered the WAIS–III Symbol Search (SS) and a visuospatial control task to fifteen adults during FMRI. SS-related brain activity was identified, followed by analyses of activity related to performance level. Compared to the control task, SS was associated with greater activity in bilateral medial occipital, occipitoparietal, occipitotemporal, parietal, and dorsolateral prefrontal cortices (DLPFC). Across both tasks, slower processing speed was also related to greater activity in these areas, except right DLPFC. Greater activity in left DLPFC was specifically related to slower processing speed during SS. Performance was consistent with education levels. Findings suggest that SS performance involves regions associated with executive and visual processing. Furthermore, slower SS performance was related to greater recruitment of left hemisphere regions associated with executive function in other studies. (JINS, 2005, 11, 471–476.)
Keywords
Information
- Type
- BRIEF COMMUNICATION
- Information
- Journal of the International Neuropsychological Society , Volume 11 , Issue 4 , July 2005 , pp. 471 - 476
- Copyright
- © 2005 The International Neuropsychological Society
INTRODUCTION
FMRI is an exciting research tool that has proven a very useful method for testing models of cognition. For instance, studies have supported Ungerleider and Mishkin's (1982) ventral “what” and dorsal “where” model of visual processing streams (Shen et al., 1999; Sugio et al., 1999). Clinical applications for FMRI are also emerging. For instance, FMRI has been used to discriminate functional from dysfunctional cortices in presurgical epilepsy cases (Lundquist et al., 1997; Tomczak et al., 2000). While imaging of patients is likely to directly aid in diagnostics and treatment, another area of clinical utility is in the validation of assumptions of localization associated with neuropsychological measures.
Several FMRI studies have used traditional neuropsychological measures, such as the Stroop Interference Task (Langenecker et al., 2004), verbal fluency (Phelps et al., 1997), and finger tapping (Bandettini et al., 1993). Unfortunately, substantial adaptations are typically made to make them feasible in the FMRI environment. Limitations to FMRI stimulus presentation and response collection include scanner noise, a strong magnetic field, confined space, and head restraint. Typical major alterations to tasks include nonverbal responding during a verbal task (Langenecker et al., 2004), visual presentation of an auditory task (Staffen et al., 2002), or pacing of a self-paced test (Langenecker et al., 2004). Occasionally researchers do not collect behavioral data during the scan (Staffen et al., 2002). Each of these solutions raises questions about generalizability, if imaging and behavioral results are assumed to be associated with the cognitive domain assessed by the original measure. Another frequent approach is administration of proxy measures to assess the same cognitive domain as traditional neuropsychological measures, such as the n-Back Task instead of the Paced Auditory Serial Addition Test (Sweet et al., 2004) or the Levine Task instead of the Wisconsin Card Sorting Task (Rao et al., 1997). Unfortunately, normative data are not available for such proxy measures.
It should be noted that the majority of published FMRI studies are conducted with healthy participants and test validation is not the aim. Nevertheless, when traditional neuropsychological domains are assessed with FMRI, such adaptations and substitutions do not take advantage of available normative data. In addition to reliably testing hypotheses about performance in clinical samples, a good set of norms would be helpful in establishing external validity of FMRI-identified activity and performance findings. Ideally normative FMRI studies should be performed. In the meantime, a more feasible alternative is to administer neuropsychological measures during FMRI acquisition as closely as possible to standard administration in the clinical setting.
The purpose of this study was to identify FMRI correlates of a frequently administered cognitive measure, the Wechsler Adult Intelligence Scales–Third Edition Symbol Search subtest (WAIS–III SS; The Psychological Corporation, 1997). It was expected that FMRI during the performance of this test would contribute to existing neuroimaging literature on visuospatial processing and provide evidence of its neural correlates. Specifically, compared to the control task we expected greater dorsolateral prefrontal (DLPFC), occipitoparietal, temporooccipital, and occipital activity to be associated with executive/attentional, visuospatial, visual identification, and matching, and primary visual processing demands, respectively.
METHODS
Research Participants
Fifteen healthy right-handed adults (ten women and five men) age 20–56 (M = 33.46, SD = 11.18) years were recruited for the study. Mean level of education was 15.84 (SD = 1.72) years. Potential participants were excluded if they had a history of psychiatric or neurological disorder, or contraindications for MR scanning (e.g., metal implants, claustrophobia). Written informed consent was obtained prior to the experiment.
Cognitive Task
The SS subtest was chosen to measure visuospatial processing. This is a self-paced task during which examinees are allotted two minutes to complete as many symbol discrimination items as possible. Specifically, for each item, they are asked to determine if a set of five geometric symbols includes one of two exemplar geometric symbols. SS was administered with minor adaptations according to the instructions in the WAIS–III manual (The Psychological Corporation, 1997). The task consisted of two four-cycle imaging runs of 6 minutes each. Each of the eight cycles consisted of a 30-s control task block followed by a 45-s SS task block. During the SS task participants were shown actual SS items in the order presented on the original form.
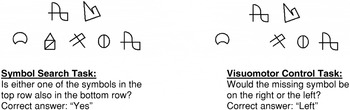
To avoid laterality effects due to visual presentation, the exemplar figures were placed directly above the five target figures (Figure 1). Participants responded using a two-button response box instead of checking the “yes” or “no” box on the standard test form. A new item appeared immediately after either button was pressed. The control task consisted of the same stimuli, except one of the seven symbols was missing. The participant responded by pressing the left button if a symbol was missing from left of midline and the right button if a symbol was missing right of midline. The control task was also self-paced. The number of correct items during each block was noted. Since each run included 180 s of SS performance, the number of items correct during the first 120 s was used to classify performance according to the test norms.

Sample Symbol Search and control task Items. (Note: simulated symbols are presented to avoid publication of actual test items.)
FUNCTIONAL MR IMAGING
Echo-planar functional imaging was performed with a 1.5 Tesla GE Signa LX scanner using a gradient-echo blood-oxygen-level-dependent sequence (BOLD; TR = 3000 ms, TE = 60 ms, flip angle = 90°, FOV = 240 × 240 mm, matrix size = 64 × 64). A sufficient number of 5-mm-thick contiguous axial slices were acquired to obtain whole-brain coverage. High-resolution structural imaging was performed using a spoiled gradient-recalled acquisition (SPGR; TR = 22 ms, FOV = 240 × 240 mm, matrix size = 256 × 256). A sufficient number of 1.5-mm-thick contiguous sagittal slices were acquired to obtain whole-brain coverage. Two 6-minute runs of 120 echo-planar volume acquisitions were obtained following the SPGR sequence. All preprocessing and statistical analyses were performed using Analysis of Functional NeuroImages (AFNI; Cox, 1996). Preprocessing steps included registration of all volumes to the fourth volume of the first run for motion correction, concatenation of the two runs, linear detrending, a linear three-point filter for temporal smoothing, transformation into standard stereotaxic space, linear resampling into 1-mm3 voxels, and coregistration with high-resolution SPGR anatomical images.
Volumes of SS-related activity were identified using a cross-correlation method described by Bandettini et al. (1993). For each voxel, the concatenated echo-planar signal time course was compared to a reference wave, which represented the eight cycles of the stimulus presentation paradigm. Phase-shifted iterations of the reference wave were used due to differing hemodynamic response lags noted in different brain regions (Bandettini et al., 1993). Thus, each voxel was assigned the greatest r-value from among phase shifted reference waves. This cross-correlation method yielded a whole-brain statistical parametric map (SPM) of r-values for each individual. Individual SPMs were combined into a group summary SPM by tallying the number of subjects who exhibited significant (two-tailed p < .005) positive correlations within each voxel. Thus, each voxel was attributed a number representing how many participants exhibited significant activity in that voxel compared to the visuospatial control task. Voxels were included in the summary SPM if they exceeded this significance threshold in more than 50% of the participants (8 or more). Individual datasets were not spatially blurred before combining in order to provide a conservative estimate of volumes of activity associated with the SS test.
Between-task differences in BOLD signal intensity were quantified for each voxel by subtracting averaged local baseline signal from the averaged signal during each experimental block. After blurring with a 3-mm Gaussian kernel and stereotaxic standardization, difference scores were compared on a voxel-wise basis across participants to a hypothetical mean of zero using a one-sample t test. A relatively strict threshold of p < .005 (two-tailed) and 200 microliter cluster size were applied to the resulting t-map to avoid Type I error associated with multiple comparisons.
To examine the contribution of behavioral performance level to the observed increases in brain activity, we performed multiple regression analyses. In these analyses preprocessed BOLD signal from individual datasets was the dependent variable, average reaction time (by block) was the independent variable, and SS stimulus presentation sequence, observed movement, and linear trends were covariates. Inspection of these individual SPMs revealed patterns of significant activity similar to our group summary SPMs of volume and intensity; however, clusters did not substantially overlap when combined (i.e., voxels were not active among more than half of participants). Therefore, an exploratory group summary SPM was created by transforming individual SPMs to z-values, thresholding at z > 1.3 (p < .10), blurring with a 3-mm Gaussian kernel, and averaging positive values across the group. A lenient threshold was applied in these exploratory analyses and results were considered trends.
In order to examine contributions of SS performance level (i.e., without variance introduced by the baseline control task), this multiple regression procedure was repeated using BOLD signal during only SS blocks as the dependent variable. Other methods were identical to our correlational analyses of SS-related volume.
RESULTS
All participants performed within the average range or better on the SS according to age corrected norms in the WAIS–III test manual. Mean performance was high average (number correct: M = 44.08, SD = 12.15; age-corrected scaled scores: M = 13.62, SD = 3.57), which is consistent with mean educational achievement for the group (M = 15.84, SD = 1.72).
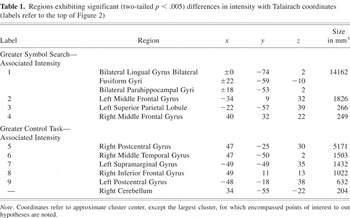
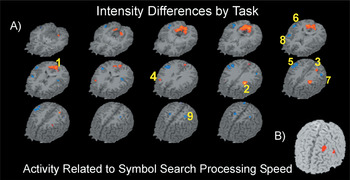
Analyses of SS-related signal (i.e., cross-correlation/SPM method) and intensity changes (i.e., subtraction/t-test method) yielded similar activation patterns. Both revealed significant bilateral activity in medial occipital, dorsal occipitoparietal, ventral occipitotemporal, DLPFC, and lateral parietal cortices. Results of the analyses of BOLD signal intensity are shown in Table 1 and Figure 2. Two differences were noted compared to SS-related activity (not shown). A right parietal cluster of significant SS-related activity was observed (x = 33, y = −54, z = 42), while right DLPFC activity was observed only in our test of intensity change. Across both methods, volumes of activation appeared larger and more intense in the left hemisphere association cortices. In contrast, large bilateral pericentral and lateral temporoparietal regions exhibited significant intensity changes during the control task (Table 1, Figure 2).
Regions exhibiting significant (two-tailed p < .005) differences in intensity with Talairach coordinates (labels refer to the top of Figure 2)


Brain regions associated with Symbol Search and processing speed. A) Warm colors indicate greater Symbol Search-related activity (two-tailed p < .005). Cool colors indicate greater control task-related intensity (two tailed p < .005). Right-anterior is oriented down and to the left of the figure. Number labels correspond to Table 1. B) Right-anterior is oriented down and to the left of the figure and p < .005 (two-tailed). (labels refer to Figure 2).
When SS and processing speed were considered separately for trends in unique contributions to BOLD signal across all blocks, slower processing speed was associated with greater activity in the same bilateral occipital, left DLPFC, and left parietal cortices. Unique SS-related activity was associated with bilateral DLPFC activity. Thus, increased activity across this system was related to slower cognitive processing, right DLPFC activity was related to other SS demands, and activity in adjacent portions of the left DLPFC was related to both.
Two regions of significant activity were specifically related to speed of processing during only the SS blocks (Figure 2, section B). Increased left DLPFC (middle: x = −36, y = 26, z = 45; and inferior: x = −54, y = 5, z = 25) frontal gyri activity was significantly related to slower cognitive processing among the majority of participants (i.e., more than 8; range 8–14).
DISCUSSION
We examined brain function associated with the WAIS–III SS subtest using FMRI and found that medial occipital, occipitoparietal, occipitotemporal, parietal, and DLPFC regions were associated with successful performance. Based upon models of cognition (Smith & Jonides, 1997; Stuss & Benson, 1984; Ungerleider & Mishkin, 1982) and previous neuroimaging research (Smith & Jonides, 1997; Shen et al., 1999; Sugio et al., 1999), these patterns suggest that SS performance is associated with primary visual, visuospatial, visual identification, and executive processing. Thus, we observed brain activity in all regions hypothesized to be associated with SS. We also found that activity in bilateral visual and left association cortices, particularly the DLPFC, increased as performance level decreased.
Robust SS-related activity within the primary and secondary visual cortices was attributed to greater demands for analyses of visual details. This conclusion is supported by our finding that activity in this area was inversely related to processing speed (i.e., difficulty). By contrast, the control task required more global visuospatial processing, associated with bilateral parietal activity and left/right discrimination, associated with dominant parietal activity (e.g., Gerstmann, 1958; Grafman & Rickard, 1997).
Lateralization is an important finding because it suggests that the left DLPFC and the left dorsal visuospatial processing stream are more involved in visual discrimination of details compared to the global visual search needed for the control task. Differences in left parietal activity are especially noteworthy given this region's role in right/left discrimination (e.g., Gerstmann, 1958; Grafman and Rickard, 1997). Since greater left supramarginal gyrus activity was observed during the control task, it might be associated with external left/right discrimination and more extensive visuospatial processing. In contrast, greater superior parietal lobule activity during SS might be related to the internal left/right discrimination necessary to convert yes/no responding to left/right button press. We concluded that the lack of between-task intensity differences in the right parietal lobe was due to similar intensity during both tasks, since SS-related activity was evident there.
Bilateral portions of the dorsal visuospatial and ventral visual identification processing streams were associated with SS performance. Although small following conservative thresholding, these clusters of significant activity are consistent with the demands of this task. Specifically, visual identification is a crucial aspect of symbol matching, as are maintaining spatial references to symbol details and location.
Although the largest volumes of recruitment were located in primary visual areas, DLPFC activity also increased bilaterally in intensity. In fact, the left DLPFC exhibited as much intensity as primary visual cortices. Several FMRI studies have identified the DLPFC as an important region for executive processing (Paskavitz et al., 2003; Postle et al., 1999; Rao et al., 1997). Executive demands during this task include decision-making, directed and sustained attention, and coordination of component processes, such as matching, responding, searching, and buffering working memory.
Since SS is frequently administered as a measure of cognitive processing speed, it is important to note that increases in brain activity across this network are consistent as performance speed decreased. The exception was DLPFC, where the left was significantly related to SS processing speed, while the right was not.
Our design allowed us to identify SS-related activity compared to a simple visuospatial control task, and to parcel out contributions of processing speed. However, SS is a complex cognitive task involving many components. Future studies may identify additional elements of the task through carefully constructed control tasks. For instance, increased primary visual and left DLPFC activity was related to slower processing. It is possible that the former was related to increased visual analysis demands, while the latter was related to decision-making and responding.
Although several steps were taken to improve generalizability of our SS task to the original WAIS–III version, some important test characteristics differ. These differences include placement of the target stimuli above the other stimuli, responding with button presses, and a longer task duration, with an interruption every 45 s. The scanning environment also differs from the typical neuropsychological testing environment because echo-planar imaging is loud and requires participants to lay supine in a narrow space. A formal validation study would address these concerns and more clearly demonstrate generalizability.
References
REFERENCES
Bandettini, P.A.,
Jesmanowicz, A.,
Wong, E.C., &
Hyde, J.S.
(1993).
Processing strategies for time-course data sets in functional MRI of
the human brain.
Magnetic Resonance in Medicine,
30,
161–173.CrossRefGoogle Scholar
Cox, R.W.
(1996).
AFNI: Software for analysis and visualization of functional magnetic
resonance neuroimages.
Computers and Biomedical Research,
29,
162–173.CrossRefGoogle Scholar
Grafman, J. &
Rickard, T.
(1997).
Acalculia. In
T.E. Feinberg &
M.J. Farah (Eds.),
Behavioral neurology and neuropsychology. pp.
219–226.
New York:
McGraw-Hill.
Gerstmann, J.
(1958).
Psychological and phenomenological aspects of disorders of the body
image.
Journal of Nervous and Mental Disease,
126,
499–512.CrossRefGoogle Scholar
Langenecker, S.A.,
Nielson, K.A., &
Rao, S.M.
(2004).
fMRI of healthy older adults during Stroop interference.
Neuroimage,
21,
192–200.CrossRefGoogle Scholar
Lundquist, P.,
Backlund, E.O.,
Sjoqvist, L.,
Thoumas, K.A.,
Wigstrom, L., &
Brismar, T.
(1997).
Clinical application of functional magnetic resonance imaging (fMRI)
to surgery in the brain.
Journal of Neuroimaging,
7,
131–133.CrossRefGoogle Scholar
Paskavitz, J.,
Sweet, L.,
Wellen, J.,
Helmer, K., &
Cohen, R.
(2003).
The role of the medial thalamus in working memory: An fMRI
study. NeuroImage,
19,
S497.Google Scholar
Phelps, E.A.,
Hyder, F.,
Blamire, A.M., &
Schulman, R.G.
(1997).
FMRI of the prefrontal cortex during overt verbal fluency.
Neuroreport,
8,
561–565.CrossRefGoogle Scholar
Postle, B.R.,
Berger, J.S., &
D'Esposito, M.
(1999).
Functional neuroanatomical dissociation of mnemonic and executive
control processes contributing to working memory performance.
Proceedings of the National Academy of Science USA,
96,
12959–12964.CrossRefGoogle Scholar
Psychological Corporation.
(1997).
WAIS III manual.
San Antonio, TX:
Harcourt Brace Jovanovich.
Rao, S.M.,
Bobholz, J.A.,
Hammeke, T.A.,
Rosen, A.C.,
Woodley, S.J.,
Cunningham, J.M.,
Cox, R.W.,
Stein, E.A., &
Binder, J.R.
(1997).
Functional MRI evidence for subcortical participation in conceptual
reasoning skills.
Neuroreport,
8,
1987–1993.CrossRefGoogle Scholar
Shen, L.,
Hu, X.,
Yacoub, E., &
Ugurbil, K.
(1999).
Neural correlates of visual form and visual spatial
processing.
Human Brain Mapping,
8,
60–71.3.0.CO;2-6>CrossRefGoogle Scholar
Smith, E.E. &
Jonides, J.
(1997).
Working memory: A view from neuroimaging.
Cognitive Psychology,
33,
5–42.CrossRefGoogle Scholar
Staffen, W.,
Mair, A.,
Zauner, H.,
Unterrainer, J.,
Niederhofer, H.,
Kutzelnigg, A.,
Ritter, S.,
Golaszewski, S.,
Iglseder, B., &
Ladurner, G.
(2002).
Cognitive function and fMRI in patients with multiple sclerosis:
Evidence for compensatory cortical activation during an attention
task.
Brain,
125,
1275–1282.CrossRefGoogle Scholar
Stuss, D.T. &
Benson, D.F.
(1984).
Neuropsychological studies of the frontal lobes
Psychological Bulletin,
95,
3–28.Google Scholar
Sugio, T.,
Inui, T.,
Matsuo, K.,
Matsuzawa, M.,
Glover, G.H., &
Nakai, T.
(1999).
The role of the posterior parietal cortex in human object
recognition: A functional magnetic resonance imaging study.
Neuroscience Letters,
276,
45–48.CrossRefGoogle Scholar
Sweet, L.H.,
Rao, S.M.,
Primeau, P.,
Mayer, A.R., &
Cohen, R.A.
(2004).
A FMRI study of verbal working memory among MS patients.
Journal of Neuroimaging,
14,
150–157.CrossRefGoogle Scholar
Tomczak, R.J.,
Wunderlich, A.P.,
Wang, Y.,
Braun, V.,
Antoniadis, G.,
Gorich, J.,
Richter, H.P., &
Brambs, H.J.
(2000).
fMRI for preoperative neurosurgical mapping of motor cortex and
language in a clinical setting.
Journal of Computer Assisted Tomography,
24,
927–934.CrossRefGoogle Scholar
Ungerleider, L.G. &
Mishkin, M.
(1982).
Two cortical visual systems. In
D.J. Ingle,
M.A. Goodale, &
R.J.W. Mansfield (Eds.),
Analysis of visual behavior (pp.
549–586).
Boston:
MIT Press.
Sample Symbol Search and control task Items. (Note: simulated symbols are presented to avoid publication of actual test items.)
Regions exhibiting significant (two-tailed p < .005) differences in intensity with Talairach coordinates (labels refer to the top of Figure 2)
Brain regions associated with Symbol Search and processing speed. A) Warm colors indicate greater Symbol Search-related activity (two-tailed p < .005). Cool colors indicate greater control task-related intensity (two tailed p < .005). Right-anterior is oriented down and to the left of the figure. Number labels correspond to Table 1. B) Right-anterior is oriented down and to the left of the figure and p < .005 (two-tailed). (labels refer to Figure 2).
 You have
Access
- 22
- Cited by