The methylammonium lead iodide perovskite (CH3NH3PbI3 or MAI) family of materials has revolutionized solar energy conversion, generating power conversion efficiencies as high as 22.7% for perovskite solar cells.[Reference Kojima, Teshima, Shirai and Miyasaka1–Reference Li, Bi, Yi, Décoppet, Luo, Zakeeruddin, Hagfeldt and Grätzel9] These high efficiencies have challenged mature silicon solar cell technology. High-efficiency perovskite p-i-n solar cells on glass frequently utilize ITO and PEDOT:PSS as the hole-transport and PCBM as the electron-transport layers.[Reference Docampo, Ball, Darwich, Eperon and Snaith10] Alternatively, n-i-p cells on glass/FTO use TiO2 as an electron-transport layer and P3HT as the hole-transport layer.[Reference Abbas, Kottokkaran, Samiee, Zhang, Ganapathy, Kitahara, Noack and Dalal11] The success of MAI is attributed to the extremely high optical absorption, the ability to synthesize heterojunctions, and the transport of electrons/holes over large lengths.[Reference Stranks and Snaith12–Reference Dong, Fang, Shao, Mulligan, Qiu, Cao and Huang16] A challenge in perovskite solar cells is the instability in the presence of light, moisture, and oxygen. Instability with light is frequently due to ion migration within the cell. The hysteresis in current–voltage characteristics, especially for p-i-n cells, due to the migration of methylammonium ions[Reference Li, Tscheuschner, Paulus, Hopkinson, Kießling, Köhler, Vaynzof and Huettner17, Reference Meloni, Moehl, Tress, Franckevičius, Saliba, Lee, Cao, Nazeeruddin, Zakeeruddin, Rothlisberger and Graetzel18] is intensively studied. While much research is performed in the fabrication and optimization of solar cells, the perovskite family has in parallel led to many fundamental studies of the electronic and optical material properties.[Reference Wang, Gould, Dobson, Zhang, Yang, Yaob and Zhao19–Reference Lai, Kong, Bischak, Yu, Dou, Eaton, Ginsberg and Yang30] The first step in the photovoltaic operation is the absorption of solar photons leading to excitons in the perovskite. A critical feature is that the excitons are very weakly bound, similar to the excitons in inorganic semiconductors with large dielectric constants (ε), but unlike the tightly bound excitons of organic semiconductors, which have small ε. In spite of the large body of research in obtaining record solar cell efficiencies, there is relatively much less established on the nature of these excitons, the dynamical evolution of exciton populations, the complex interplay between excitons and unbound e/h carriers, and the direct observation of these excitonic states. It is of great interest to compare the excitonic states in perovskites to those of the intensively studied direct band gap semiconductors (e.g., GaAs). Additionally, local heterogeneity and domains are common in perovskites, and the electronic/mechanical properties of perovskite films are largely dependent on these microstructures. In particular, these defects are recently revealed to be responsible for the low mobility and photoluminescence (PL) quenching in the highest quality perovskite films with the longest lifetimes.[Reference deQuilettes, Vorpahl, Stranks, Nagaoka, Eperson, Ziffer, Snaith and Ginger31] Understanding these aspects ultimately identifies the limiting factors for the device performance. There have been very limited research efforts to provide both spatially resolved PL from microstructures, intrinsic charge transport parameters, and their fs dynamics, e.g., mobility, density, and charge transfer/separation times.
Here, we perform comprehensive spatial–temporal spectroscopy characterization of the MAI samples using laser-scanning confocal microscopy, and ultrafast optical pump and THz probe spectroscopy to study fs transport and the effects of the microstructure. These provide strong evidence for hydrogen-like Rydberg systems and PL heterogeneity, with decreased lifetime and efficiency, near the crystal boundaries. For quantitative insights, we further utilize ab-initio electronic structure calculations to simulate the excitonic spectrum and the underlying electronic band structure of MAI, to gain a fundamental understanding of why the excitons are weakly bound. We first describe the experimental synthesis of MAI films and the temperature-dependent PL, and photo-induced absorption at THz frequencies with pump–probe experiments that provide clear evidence for excitons. We perform ab-initio band structure calculations to obtain the electronic densities of states (DOS), electron and hole effective masses, and the low-frequency dielectric function. Capacitance–voltage (C–V) measurements also provide independent estimates for the low-frequency dielectric constant. We calculate the excitonic binding and compare with the measured excitonic levels.
Results
We synthesized free-standing perovskite films in which MAI micro-crystals were embedded in a matrix of poly(methyl methacrylate) (PMMA). This is a convenient platform for measurements and our expectation is that the light absorption and exciton formation in such films are similar to photovoltaic devices. MAI micro-crystals were fabricated with wet synthetic chemistry methods, by adding hydro-iodic acid (10 mL, 0.075 mol) to a solution of methylamine (24 mL, 0.192 mol) in ethanol (100 mL) at 0 °C. Stirring for ~2 h was followed by concentration under vacuum, first in a rotary evaporator at 70 °C, and then under dynamic vacuum at 60 °C for 12 h. The solution of methylammonium iodide CH3NH3I (9.2 mg, 0.06 mmol) was combined with PbI2 (9.6 mg, 0.02 mmol) in γ-butyrolactone (4 mL) and then injected into toluene (15 mL), maintaining stirring, and was then left at room temperature for 2 h. The remaining solid was recrystallized from the ethanol. The product was isolated by centrifugation (5 min at 4500 rpm) and washing with toluene (5 mL). The resulting CH3NH3PbI3 (6 mg, 0.01 mmol) was dispersed in a PMMA (0.13 g, 0.8 µmol) solution in toluene (3 mL), while sonicating and agitating until the mixture became homogeneous. A homogeneous solution of CH3NH3PbI3 and PMMA in toluene was prepared, cast into a mold and allowed to dry forming a 550 µm thick optical quality film under ambient conditions. Further details of the sample preparation can be found in Ref. Reference Luo, Men, Liu, Mudryk, Zhao, Yao, Park, Shinar, Shinar, Ho, Perakis, Vela and Wang32. One advantage of perovskite–PMMA composites is that the embedded perovskites are isolated from the atmosphere, ensuring minimum degradation and repeatability of the experiment.
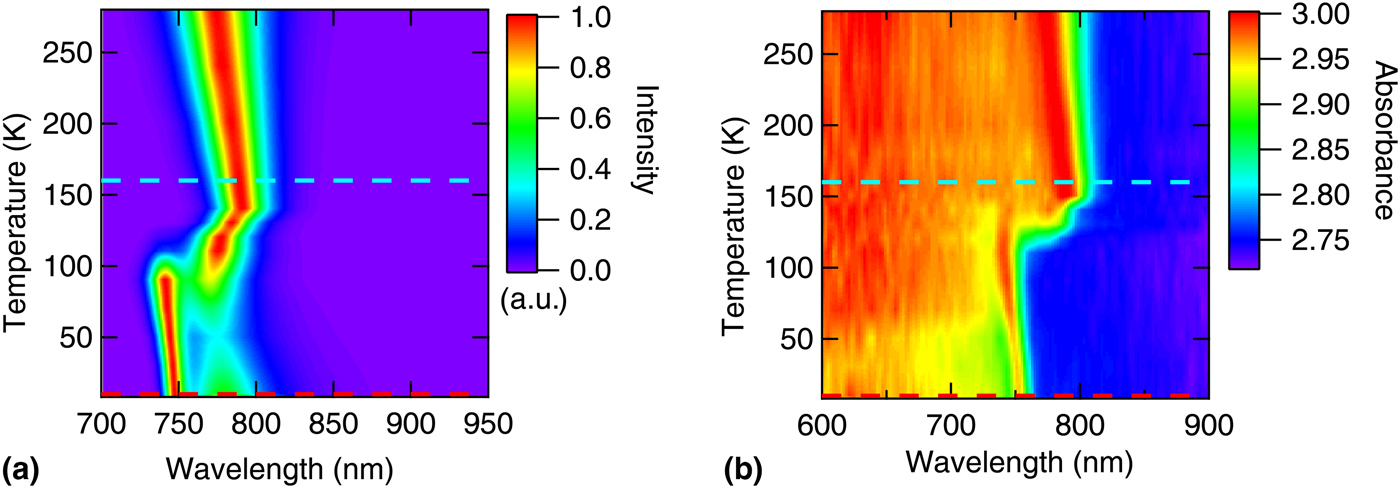
We employ two complementary methods to study excited electronic states: (i) PL and (ii) ultrafast optical pump THz probe spectroscopy. We measured the temperature-dependent PL spectra of the perovskite–PMMA samples in Fig. 1(a), and the corresponding absorbance spectra in Fig. 1(b). These are qualitatively consistent with prior studies of high-quality perovskite materials,[Reference D'Innocenzo, Grancini, Alcocer, Khandada, Stranks, Lee, Lanzani, Snaith and Petrozza33–Reference Fan, Gu, Liang, Luo, Chen, Zheng and Zhang35] confirming the high quality of our samples. The two linear regions, T > 150 K and T < 100 K, where the PL and absorbance wavelengths increase with decreasing temperature can be identified with the high-temperature tetragonal phase above 140–150 K, and the lower temperature orthorhombic phase below 100 K. The intermediate region (100–150 K) represents a mixed phase region where the room temperature tetragonal phase starts to transform to the orthorhombic phase when the temperature is lowered to below ~150 K. The orthorhombic phase fully forms at ~100–120 K.
(a) A two-dimensional (2D) color plot of temperature-dependent PL spectra of MAI/PMMA film from 8 to 280 K. The sample is excited by 632.8 nm He–Ne laser. (b) A 2D false color plot of absorbance spectra of MAI/PMMA film plotted in a similar way as in (a). The dashed red and cyan lines indicate T = 8 and 160 K, respectively, where the THz conductivities are measured and to be shown in Fig. 3.

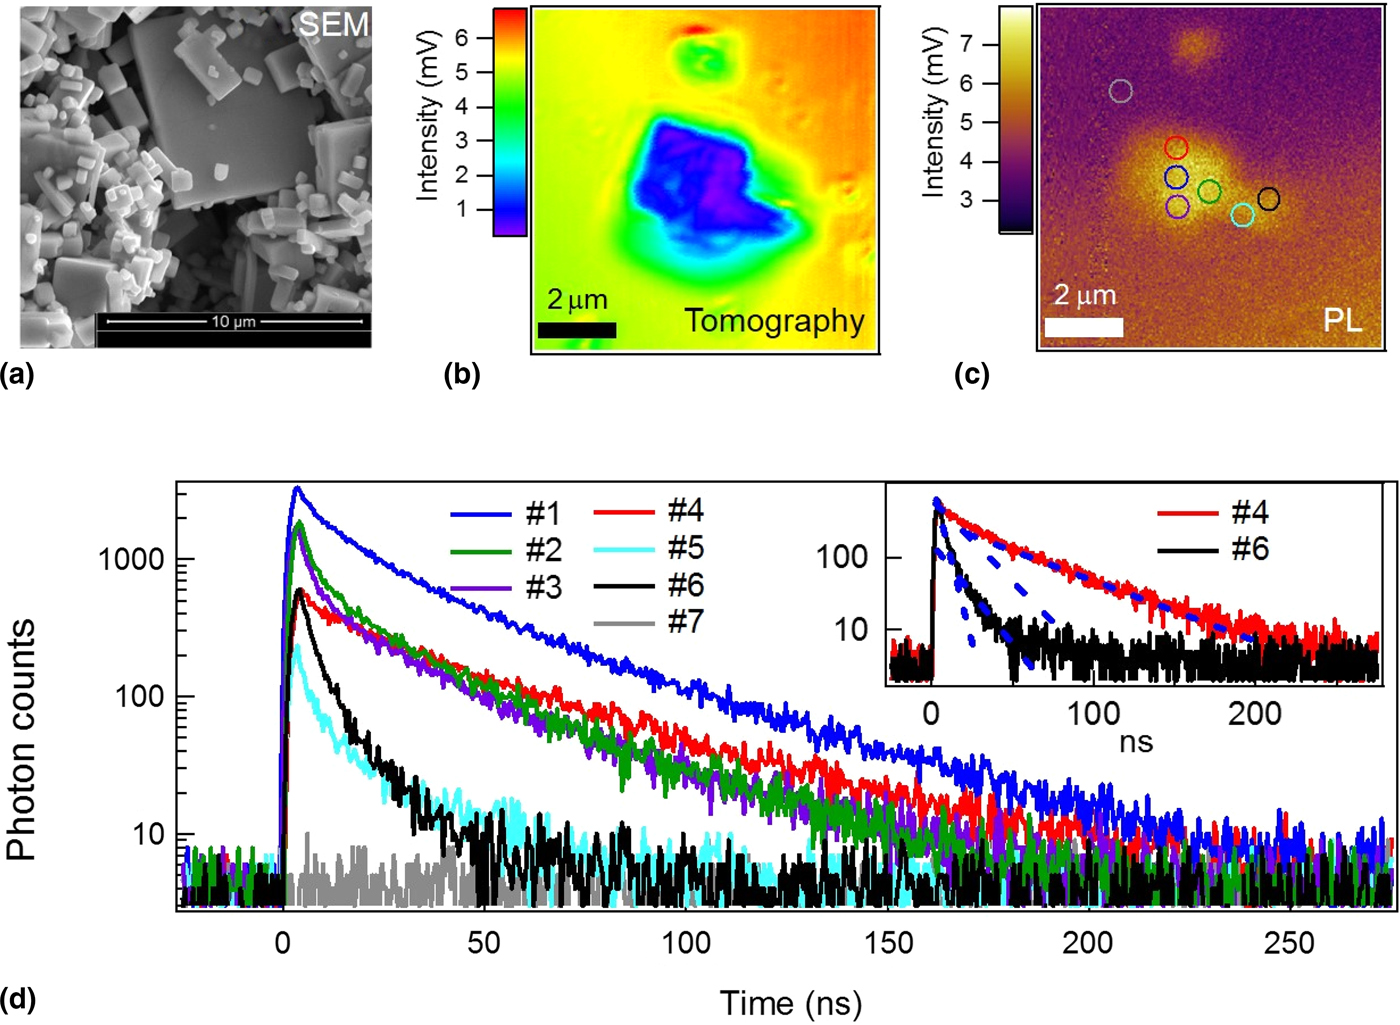
The PL [Fig. 1(a)] and the absorbance [Fig. 1(b)] measurements represent an average over many MAI micrometer-sized micro-crystals. To characterize the spatially resolved PL from individual MAI crystallites, first, we imaged the MAI microcrystals with scanning electron microscopy (SEM), which shows aggregated, rectangular crystals of micrometer size [Fig. 2(a)]. Then we isolated a few crystals by diluting and drop-casting them on a glass substrate. As shown in Fig. 2(b), the tomography image identifies a small aggregate of mostly two crystals that are well-separated from others. The corresponding PL image [Fig. 2(c)] confirms the basic crystallite shape of the two crystallites and displays the spatial variation of PL intensity with some extra quenching near the interface between the two crystals and at the crystal boundaries.
(a) SEM image of microcrystals. (b) Tomography and (c) PL images of the same micrometer-size crystals isolated from (a) using confocal laser scanning microscopy. (d) Time-resolved PL lifetimes for various crystal positions after excitation, marked in (c), with a pulsed diode laser at 405 nm. Inset shows the bi-exponential decays used for the position #4 (inside the micro-crystal), and position #6 (at the boundary of the micro-crystal).

In order to underpin the origin of PL variation, Fig. 2(d) shows time-resolved PL lifetimes for various positions marked in Fig. 2(c), indicating a strong spatial variation of PL lifetimes. In all the examined positions, we see complex decay profiles with multiple exponential decay components [inset of Fig. 2(d) with multiple blue lines]. To illustrate the variation of PL decay times, we compare a slow PL decay (position #4, red) with a fast PL decay (position #6, black). The fitted results for the two bi-exponential PL decay lifetimes are τ 1 = 5.65 ns, τ 2 = 43.25 ns for position #4, and τ 1 = 2.98 ns, τ 2 = 12.16 ns for position #6. The positions with stronger PL emission generally exhibit longer lifetimes. Intriguingly, longer PL lifetimes increasingly prevail inside the crystal (positions #1–#4), while shorter ones become more dominant near the crystallite boundary and interface (positions #5–#6). Although more systematic study and analysis are needed to reveal the exact correlation, these results indicate that the microstructures strongly influence the PL quenching process and could be responsible for the carrier collection/energy conversion efficiency in the perovskite-based solar cells devices.
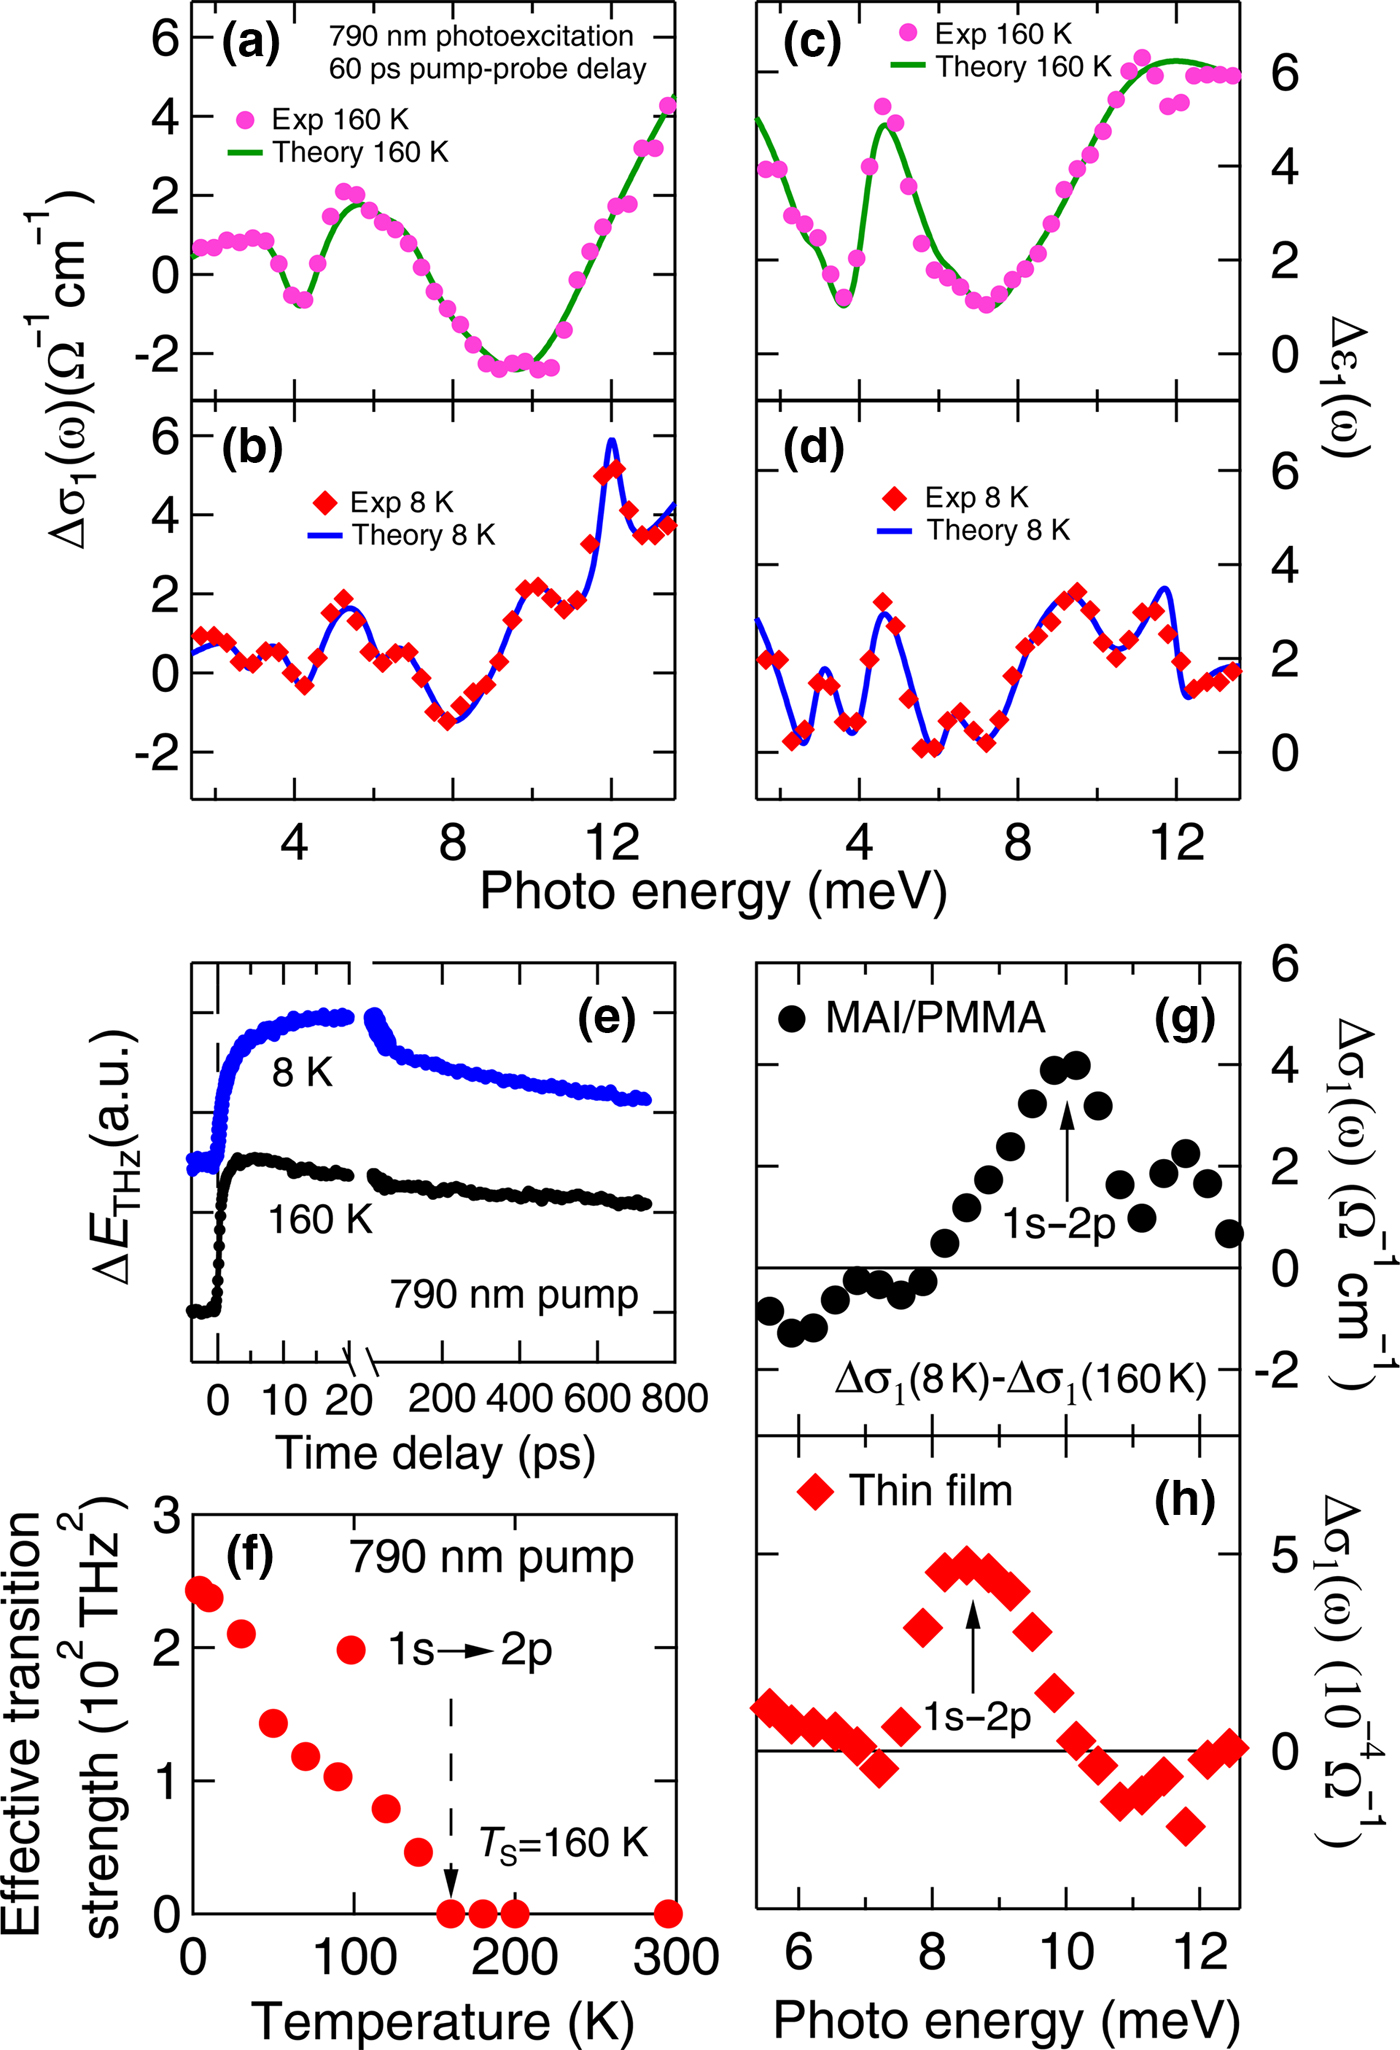
Although spatially and time-resolved PL provides decay kinetics of the lowest excited state, it does not yield information on the higher excitonic levels. To quantitatively characterize the excitonic transitions, we performed optical pump and THz probe spectroscopy of the MAI/PMMA sample using a 790 nm pump beam with a 40 fs pulse duration. Figures 3(a)–3(d) show our experimental observations of the correlated THz resonances from excitonic Rydberg states, as manifested by the simultaneously obtained photo-induced real parts of THz conductivity Δσ 1(ω) and dielectric function Δε1(ω), associated with dissipative and inductive responses of the sample, respectively.
Photo-induced THz conductivity Δσ 1(ω) for MAI/PMMA under 790 nm photoexcitation, 550 µJ/cm2 fluence, and 60 ps pump–probe delay for (a) T = 160 K and (b) 8 K. Both experimental results (dots) and theoretical fitting (lines) are shown. Photo-induced THz dielectric function Δε1(ω) for MAI/PMMA under 790 nm photoexcitation, 550 µJ/cm2 fluence, and 60 ps pump–probe delay for (c) T = 160 K and (d) 8 K. The experimental results (dots) and theoretical fitting (lines) are plotted. (e) Photo-induced transmitted THz field change for MAI/PMMA under 790 nm pump and 550 µJ/cm2 fluence for T = 8 K (blue) and 160 K (black). (f) Temperature-dependent effective transition strength of the excitonic transition 1s–2p. (g) Difference of THz conductivity Δσ 1(ω) of the MAI/PMMA sample (black dots) between 8 and 160 K, i.e.,  $\Delta \sigma _1(8 {\rm K}) - \Delta \sigma _1(160{\kern 1pt} {\rm K})$. (h) Difference of THz sheet conductivity Δσ 1(ω) of a 500 nm thick MAI thin film on a 1 mm thick MgO substrate, plotted in the same way as (g).

As is well-established, the frequency-dependent Δσ 1(ω) and Δε1(ω) are due to internal electronic transitions. Shown in Figs. 3(a) and 3(b) are the measured Δσ 1(ω) at 160 and 8 K, respectively. As the temperature is reduced from 160 to 8 K, the sample undergoes a symmetry-lowering structural phase transition from tetragonal to orthogonal. One of the principal temperature-dependent changes between the two spectra occurs in the higher energy range with the appearance of two photo-induced absorptive resonant maxima at ~10.1 and 12.1 meV, which are not observed at higher temperature T = 160 K. We interpret these as due to internal quantum transitions between excitonic Rydberg states 1s–2p and 1s–3p in the orthorhombic phase, with transition energies E 21 ~ 10.1 meV and E 31 ~ 12.1 meV, yielding the measured ratio of 0.835 (E 21/E 31). This correlates very well with the predictions of a hydrogenic model of Rydberg states (E n = E 0/n 2), where the ratio of transition energies between the 1s to 2p and 1s to 3p transitions are E 21/E 31 = (1–1/4)/(1–1/9) = 27/32 = 0.844. Furthermore, from the measured transition energies, we extract the exciton binding energy E b = 13.5–13.6 meV. Similar to inorganic semiconductors, the weak exciton binding energy is associated with high dielectric screening coupled with smaller carrier effective masses. We accordingly understand the physical origins of the weak excitonic binding with first-principles electronic structure calculations in the following section.
At relatively high temperature T = 160 K, there are significant photo-induced bleaching features in the THz conductivity at ~4 and ~10 meV [Fig. 3(a)]. These features arise from the softening of (i) a 4 meV perovskite phonon modes and (ii) a second perovskite phonon mode at 8 meV that combines with a PMMA mode at 10 meV to provide a broad minimum. The new bleaching modes at ~3 and ~6 meV that appear only at low temperature [Fig. 3(b)] are also observed in previous THz studies.[Reference La-o-vorakiat, Xia, Kadro, Salim, Zhao, Ahmed, Lam, Zhu, Marcus and Michel-Beyerle36, Reference La-o-vorakiat, Slim, Kadro, Khuc, Haselsberger, Cheng, Xia, Gurzadyan, Su, Lam, Marcus, Michel-Beyerle and Chia37]
The photo-induced THz transmission change at T = 8 K in Fig. 3(e) exhibits a delayed two-step rise until ~17 ps, which is attributed to (1) the loss of exciton coherence at a time scale of ~1 ps and (2) the cooling of 1s excitons from higher energy at a time scale of ~11 ps. At T = 160 K, the previously delayed formation becomes faster, indicating enhanced dephasing and phonon scattering.[Reference Park3Reference Im, Jang, Pellet, Gratzel and Park6] In addition, as shown in Fig. 3(f), the temperature-dependent effective transition strength of 1s–2p, proportional to the exciton population at the 1s state, gradually disappears when the temperature is increased to above the structural phase transition temperature ~160 K. These temperature-dependent results are fully consistent with our previous observation, in which the dielectric environment is significantly changed as we cross the structural phase transition, so that excitonic correlations are suppressed and no exciton resonance is observed above ~160 K.
To extract excitonic transitions, we plot the difference of the THz conductivity between 8 and 160 K [black dots in Fig. 3(g)], i.e., Δσ 1 (8K)−Δσ 1 (160K), in which the free e–h pairs and phonon contributions to the THz conductivity that are insensitive to temperature, are greatly subtracted out. This isolates the contribution of the excitonic transitions in the orthorhombic phase. The peak in Δσ 1(ω) at 10.1 meV [Fig. 3(g)] is ascribed to the 1s–2p internal excitonic transition. Additionally, we performed a similar analysis of Δσ 1(ω) for a MAI thin film with 500 nm thickness that was deposited by spin coating on a 1 mm thick MgO substrate in order to ensure that our observation of excitonic transitions from MAI/PMMA film can be universally applied to MAI materials in other forms and to examine the sample-dependent THz conductivity. We find the peak of the conductivity difference for the thin film sample shifts downward to ~8.5 meV [Fig. 3(h)], which we assign to the 1s–2p internal transition for excitons in the MAI thin film on MgO. These suggest that the exciton binding energy depends on the substrate and the dielectric screening.
Computational results and discussion
The exciton binding energy depends on the effective mass m* and ε through
 $$E_{\rm b} = \left( {\displaystyle{{m^\ast} \over {\varepsilon ^2}}} \right)(13.6\; {\rm eV}).$$
The experimental data measure a weak exciton binding energy E b ~ 13.5 meV, which suggest the ratio of (m*/ε2) < 10−3. Thus for such a weak binding energy, the dielectric constant is expected to be large as in other inorganic semiconductors (e.g., ε ~ 12–14 for GaAs), and in addition m* << 1, to achieve the factor of (m*/ε 2) <10−3. To get a handle on the values of the effective mass m* and the dielectric screening ε, we utilize to ab-initio electronic structure simulations. The simulations also provide important support for whether the simple exciton picture is valid in perovskites. To understand the underlying excitonic physics, and the measured excitonic spectra, ab-initio electronic band structure, and optical properties are computed to characterize the nature of bands around the Fermi energy and the dielectric screening.
We used the full potential linearized augmented plane wave (FP-LAPW) scheme within the Wu–Cohen form of the generalized gradient approximation (WC-GGA)[Reference Wu and Cohen38] Perdew–Burke–Ernzerhof (PBE) parametrizations.[Reference Perdew, Burke and Ernzerhof39]
Relativistic effects in the band structure are significant for Pb and I, and these were simulated by including spin–orbit (SO) coupling within the WIEN2k scheme[Reference Blaha, Schwarz, Madsen, Kvasnicka and Luitz40] followed by modified Becke–Johnson (mBJ)[Reference Tran and Blaha41] exchange-correlation potential (PBE + SO + mBJ).
FP-LAPW uses the full crystal potential of the unit cell and hence is an accurate method for simulating the electronic band structure of the material. This scheme divides the unit cell into two regions, the interstitial region and the non-overlapping atomic spheres. Electronic wave functions are expanded in spherical harmonics within the MT spheres, and plane waves in the interstitial region. The optimized orthorhombic lattice parameters were taken from Refs. Reference Zhu, Su, Marcus and Michel-Beyerle42 and Reference Feng and Xiao43.
For the ab initio FP-LAPW density functional theory (DFT) simulations, the radius of MT spheres in MAI are taken as 2.5, 2.25, 0.63, 1.24, and 1.18 for Pb, I, H, C, and N, respectively, in 62_Pnma space group. The self-consistent field (SCF) calculations were performed keeping energy, charge, and force convergence parameters at 10−5 Ry, 10−4 a.u., and 2.0 mRy/a.u., respectively. Parameters deciding the size of the matrix, R mt × K max, and plane wave expansion cutoff, G max, were taken as 3 and 20/Bohr, respectively. When utilizing the PBE + SO + mBJ method, the force optimization technique is not implemented with SO and mBJ in the present Wien2k version. For the PBE + SO + mBJ, the convergence criterion for total energy and charge were the same as used for SCF calculations with a non-shifted 5 × 3 × 5 Monkhorst–Pack mesh in the irreducible Brillouin zone. A finer k-point mesh, 11 × 7 × 11, was used for band structure calculations.
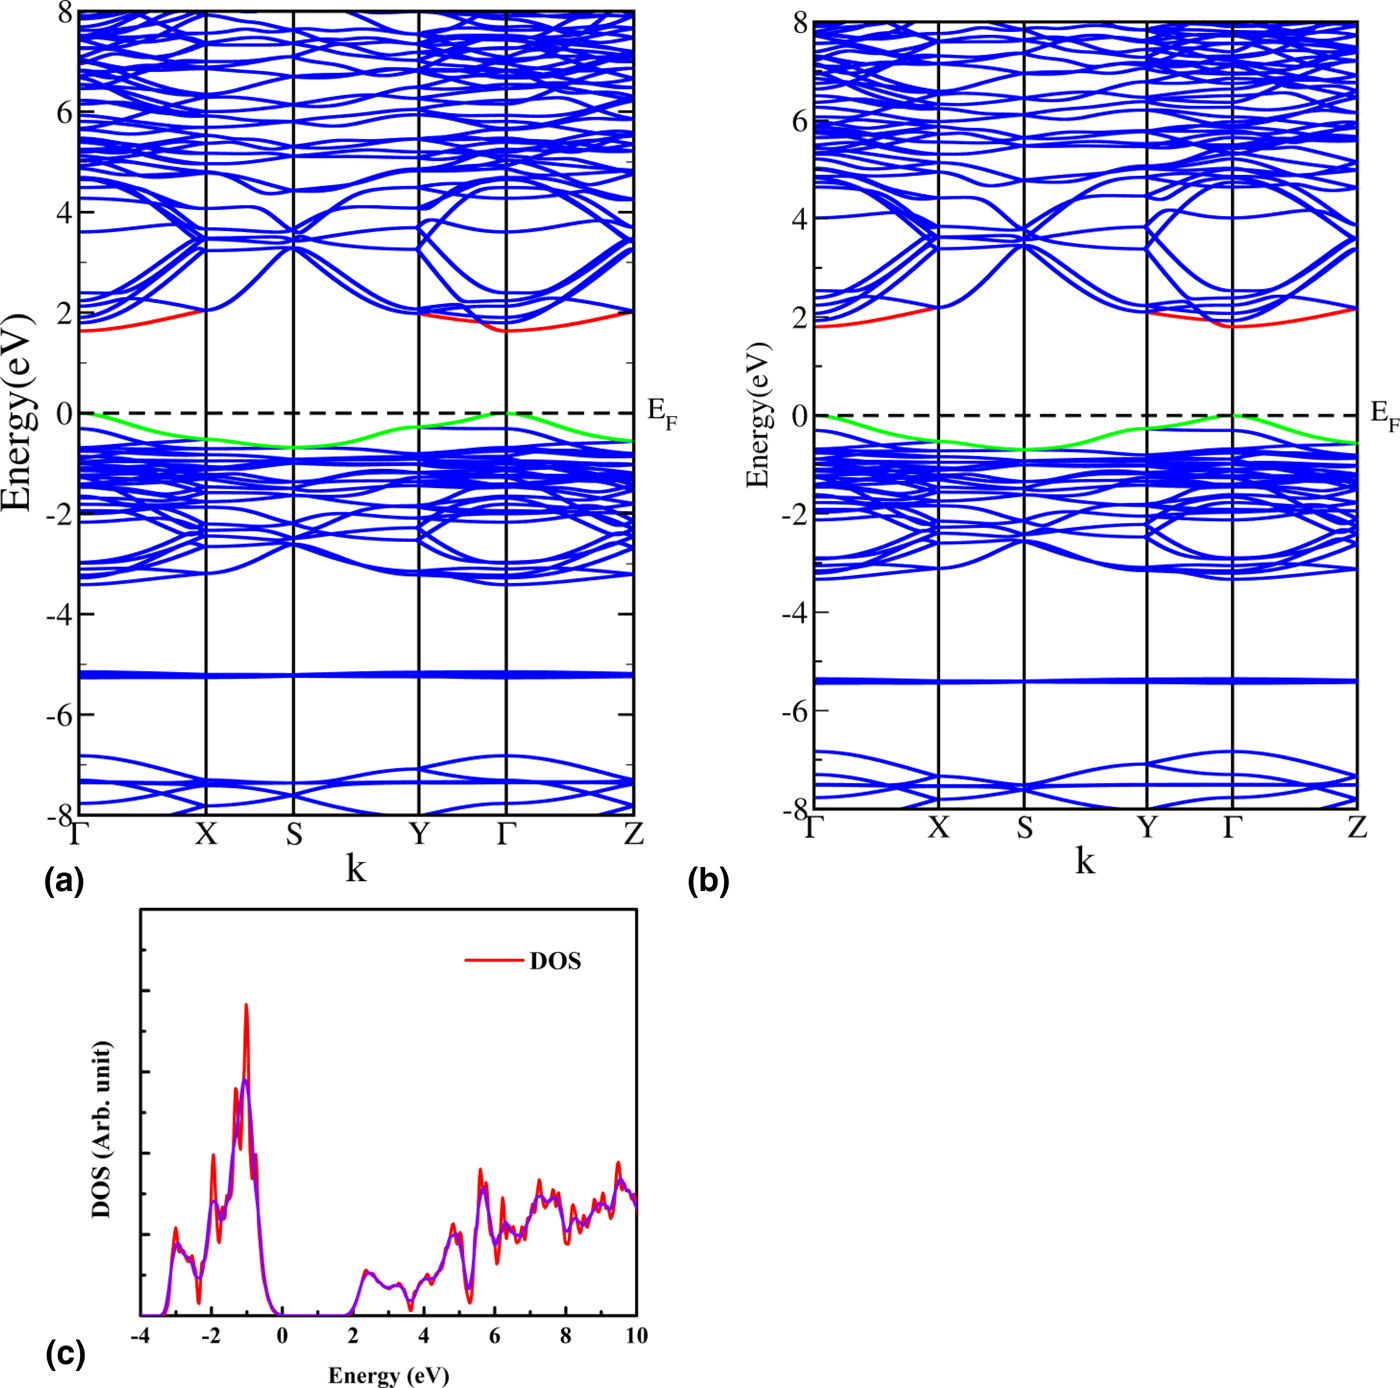
The computed first-principles band structure from PBE and PBE + SO + mBJ is in Figs. 4(a) and 4(b), for the low-temperature orthorhombic MAI phase. There is a well-defined direct gap at the zone center (Γ) of ~1.64 eV (1.8 eV) for PBE (PBE + SO + mBJ). The calculated band gap compares well with the experimental band gap 1.63 eV,[Reference Kojima, Teshima, Shirai and Miyasaka1] in spite of inaccuracies of the DFT energy gap. We found that adding the SO coupling to PBE (PBE + SO) decouples the bands into a manifold of heavy (J = 3/2) and light bands (J = 1/2) but provides much lower bandgap (0.6 eV) than experiment.[Reference Kojima, Teshima, Shirai and Miyasaka1] As in other band structure calculations, it was necessary to add the mBJ exchange-correlation potential (PBE + SO + mBJ) to achieve reasonable band structure [Fig. 4(b)], with the overall features in good agreement with bands reported by Geng et al.[Reference Geng, Zhang, Zhang and Lau44]
Ab-initio electronic band structures of MAI along the high symmetry directions of the Brillouin zone using (a) PBE parametrization and (b) relativistic band structure with spin–orbit (SO) coupling and the modified Becke–Johnson (mBJ) exchange-correlation potential. The top of the valence band and bottom of the conduction band are shown in green and red, respectively. (c) Electronic densities of states (DOS) of MAI perovskite calculated from PBE + SO + mBJ, showing the unsmoothed (red) and smoothed (blue) calculations.

The electronic DOS [Fig. 4(c)] show narrow valence bands (width ~4 eV), below which are the localized electronic levels. The conduction bands are far broader and plane wave-like. The parabolic dispersions of the conduction and valence bands provide carrier effective masses. In the DOS [Fig. 4(c)], the valence band maximum states are composed of I-5p orbitals with small contributions from Pb-6s orbitals. The conduction band minimum is dominated by Pb-6p orbitals, in agreement with previous simulations.[Reference Geng, Zhang, Zhang and Lau44] These contributions from Pb and I lead to the Pb–I bond formation, which strongly affects the band dispersions, evident in the partial DOS projected on the different ions (not presented here). Our DOS indicates that organic cations do not contribute to the valence or conduction bands but are responsible for charge neutrality.
A bound electron–hole (e–h) pair can form excitonic levels below the semiconductor band gap. Excitons are expected to be weakly bound, similar to other inorganic semiconductors with large ε (e.g., ε ~ 12–14 in Si, GaAs), but unlike organic semiconductors which have larger exciton binding energies and small ε (ε ~ 3–4). The exciton binding energy depends on the effective mass m* and ε through  $E_{\rm b} = (m^{\ast} /\varepsilon^2)\,(13.6 {\rm eV})$.
The exciton effective mass m* is expressed in terms of the electron and hole effective masses  $m_{\rm e}^{\ast}, \,\; m_{\rm h}^{\ast} $:
 $$\displaystyle{1 \over m^{\ast}} = \displaystyle{1 \over m_{\rm e}^{\ast}} + \displaystyle{1 \over m_{\rm h}^{\ast}}.$$
The long-wavelength dielectric constant ε can be approximated by the well-known relation[Reference Ziman45]
 $$\varepsilon = \varepsilon \left( {q \to 0} \right) \cong 1 + \displaystyle{{{(h\omega _{\rm p})}^2} \over {E_{{\rm gap}}^2}} = 1 + \displaystyle{{4\pi N_{\rm e}^2 /m} \over {E_{{\rm gap}}^2}}. $$
The density of valence electrons is N e, with plasma frequency ω p. E gap is the direct band gap averaged over the entire Brillouin zone. From the first-principles band structure, we estimate E gap ~ 2.58 eV. E gap considerably exceeds the direct band gap (E g ~ 1.8 eV in PBE + SO + mBE), since the average vertical energy separation of bands in the Brillouin zone is much larger than E g (Fig. 4). Since the unit cell has 80 electrons and a volume of 1005.54 A3, the plasma frequency is 1.59 × 10¹⁶/s or 10.47 eV. These facts leads (3) to the large ε ~ 17.97, which is in good agreement with recent C–V measurements[Reference Saimee, Konduri, Ganapathy, Kottokkaran, Abbas, Kitahara, Joshi, Zhang, Noack and Dalal46] that estimate ε ~ 18. The strong dielectric screening generates weakly bound excitons that rapidly dissociate to free electrons and holes at room temperature.
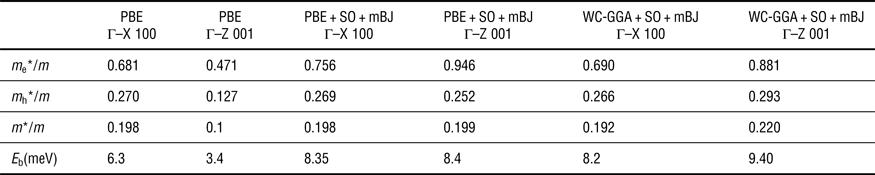
The curvature of the valence and conduction bands at Γ controls m*. The band structure [Figs. 4(a) and 4(b)] indicates a high anisotropy along the different directions, especially for the conduction band. The non-relativistic PBE band structure leads to reasonable effective masses (m e*/m = 0.2) along (Γ−X) but low values (0.12) along (ΓZ), generating unacceptably low exciton binding energies of 6.4 and 3.4 meV. The conduction band is highly dispersed along the 010 (Γ−Y) direction resulting in much smaller m e*/m of ~0.1.
We tested the incorporation of relativistic effects that are significant for Pb and I, by including SO coupling. SO coupling decouples the bands into a manifold of heavy (J = 3/2) and light band (J = 1/2) with the heavier e- or h-bands increasing m* that may provide more accurate effective masses.[Reference Chin, Cortecchia, Yin, Bruno and Soci47] Addition of SO coupling leads to smaller band gaps as has been reported in other DFT calculations.[Reference Umari, Mosconi and De Angelis48] Thus, it is necessary to include the mBJ exchange-correlation potential[Reference Blaha, Schwarz, Madsen, Kvasnicka and Luitz40] in the band structure. There are flat conduction bands and large electron effective masses along 100 (ΓX) and 001 (ΓZ) of 0.75 and 0.94, respectively (Table I). The valence band dispersion is stronger leading to m h/m* ~ 0.25–0.26 along the (ΓX) and (ΓZ) directions, and effective masses m*/m ~ 0.2 along (ΓX) and (ΓZ). We compute E gap and find a large dielectric constant ε ~ 17.97 that results in exciton binding energies of 8.4 meV (Table I) for the relativistic PBE + SO + mBE calculation, which is similar along the 100 and 001 directions. The conduction band is highly dispersed along the 010 (Γ−Y) direction with much smaller m e*/m of ~0.1. The exciton binding in the 010 direction is much weaker (3.4 meV) and may not support an excitonic state, which is similar to the findings of other ab-initio band structure simulations.[Reference Zhu, Su, Marcus and Michel-Beyerle42] It is likely that experimental measurements may pick up the excitonic states along the 100 and 001 directions. For photons with incident momentum ki along 001, the excitons are also excited in the 001 direction, since the photon momentum transfer q = ki–k f is along 001.
The effective masses, and exciton binding energies (E b), along the principal symmetry directions of the Brillouin zone.

The three calculations utilize (i) the PBE form for the generalized gradient approximation (GGA); (ii) relativistic calculations incorporating spin–orbit (SO) coupling and the modified Becke–Johnson (mBJ) exchange-correlation potential and (iii) the Wu–Cohen (WC) form for the GGA in the relativistic scheme with SO coupling and the mBJ potential.
Although the PBE[Reference Perdew, Burke and Ernzerhof39] is the widely utilized form of the exchange-correlation potential in the GGA, we also tested the WC-GGA[Reference Wu and Cohen38, Reference Chin, Cortecchia, Yin, Bruno and Soci47] within this relativistic framework of SO coupling and the MBJ potential. We obtain (Table I) slightly smaller electron effective mass ratios (0.69, 0.88), similar hole effective mass ratios (0.27, 0.29), and exciton binding energies of 8.2 and 9.4 meV, which also show some anisotropy.
It is encouraging that both relativistic methods yield exciton binding energies in the same range. The computed exciton binding energy is significantly lower than the experimental value (~13.5 meV), although is closer to the value measured in MAI films on MgO. This could partly be due to problems with the band gap in DFT methods. A small change of the b lattice parameter may also affect the binding energy. Excitonic states should include a many-body description incorporating the e–h Coulombic interaction. Relativistic DFT simulations[Reference Umari, Mosconi and De Angelis48] incorporating many-body interactions and solution of the Bethe–Saltpeter equation may provide a better representation of the excited state wavefunction, although much higher exciton binding energies (40 meV) were found using such formalisms.[Reference Zhu, Su, Marcus and Michel-Beyerle42] Two-dimensional excitons are predicted to have stronger Coulomb interaction and higher binding energy than in bulk,[Reference Keldysh49] which may also account for the lower simulated values in the present work.
A critical feature is the large dielectric constant, ε ~ 18, from simulations. To independently confirm the ε, we performed C–V measurements (see online Supplementary Fig. S1) on MAI solution processed devices (glass/ITO/NiO/MAI PVSK/PCBM60/Al). At low frequency and small forward-bias voltage, the capacitance C(V) can be reliably described by C = εA/d. The capacitance of the MAI layer is in series with the electron-transport and the hole-transport layers, resulting in an equivalent capacitance dominated by the smallest capacitance. Since charge depletion occurs in MAI, the capacitance is dominated by the MAI layer. From the measurements (area A = 0.106 cm2 and a thickness d ~ 400 nm), we obtain ε ~ 20 that independently supports the value inferred from the band structure calculations.
Conclusion
We perform a comprehensive, spatial–temporal spectroscopy characterization of methylammonium perovskite using laser-scanning confocal microscopy and ultrafast optical pump and THz probe spectroscopy. The ultrafast pump–probe spectroscopy for the 550 µm thick free-standing MAI/PMMA film measures the internal quantum transition of Rydberg states. The observed absorptive resonances at ~10.1 and 12.1 meV are assigned to the internal quantum transitions of Rydberg states 1s–2p and 1s–3p, which gives an exciton binding energy of 13.5 meV. THz measurements on the 500 nm thick MAI films on a MgO substrate show an absorptive resonance at ~8.5 meV, assigned to 1s–2p Rydberg state, suggesting that the binding energy depends upon the dielectric environment. Our experimental PL demonstrates an orthorhombic phase at low temperature, which stabilizes to the tetragonal structure at room temperature. Spatially resolved PL measured with a confocal microscope shows strong PL quenching at boundaries and interfaces of the micro-crystals. To obtain a fundamental understanding of excitonic physics, we computed the ab-initio electronic band structure and optical properties using DFT. The simulated direct energy band gap and dielectric constant are 1.64 eV and ~18, respectively. The high dielectric constant screens the internal quantum states leaving excitons weakly bound. Relativistic ab-initio electronic structure calculations incorporating SO coupling obtain heavier electron effective mass ratios (0.69–0.94), lighter hole effective mass ratios (0.25–0.29), and exciton binding energies of 8.2–9.4 meV. The electronic DOS provides insight into the role of organic cations and inorganic elements in MAI. Our studies provide fundamental insights into excitonic Rydberg levels and their dynamic pathways in perovskites.
Supplementary material
The supplementary material for this article can be found at https://doi.org/10.1557/mrc.2018.114
Acknowledgments
This paper was supported in part (R.B., L.L., Z.L., D.C., J.M., J.S., J.W.) by the US DOE Office of Science, Basic Energy Sciences, Materials Science and Engineering Division. Ames Laboratory is operated for the US DOE by Iowa State University under Contract No. DE-AC02-07CH11358. The research used resources at the National Energy Research Scientific Computing Center (NERSC), which is supported by the Office of Science of the US DOE under Contract No. DE-AC02-05CH11231. KCB acknowledges DST for providing him financial support through SERB-NPDF through Letter No. PDF/2017/002876. The authors also acknowledge the computing resources provided by the Inter-University Accelerator Center, New Delhi.