Introduction
Climate change may affect dairy production in various ways. The main issues concern the effects of water stress on forage quality and quantity, direct effects of heat stress on animal performance and welfare, and the effects of temperature change on disease incidence (Gauly et al., Reference Gauly, Bollwein, Breves, Brügemann, Dänicke, Daş, Demeler, Hansen, Isselstein, König, Lohölter, Martinsohn, Meyer, Potthoff, Sanker, Schröder, Wrage, Meibaum, von Samson-Himmelstjerna, Stinshoff and Wrenzycki2013; Kipling et al., Reference Kipling, Bannink, Bellocchi, Dalgaard, Fox, Hutchings, Kjeldsen, Lacetera, Sinabell, Topp, van Oijen, Virkajärvi and Scollan2016). All these affect overall nitrogen (N) use efficiency of dairy production. However, most of our tools to analyse N use efficiency have been diet–animal oriented, focussing on milk production and corresponding milk N use efficiency (MNE) rather than overall efficiency, probably because of the major effects of diet on MNE (Huhtanen and Hristov, Reference Huhtanen and Hristov2009). Therefore, our objective was to develop a herd model that includes elements of management, production and disease to evaluate lifetime N use efficiency (LNE) of dairy cattle.
Material and methods
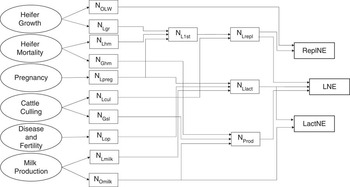
The LNE model consists of six primary compartments, referred to as (i) heifer growth, (ii) heifer mortality, (iii) pregnancy, (iv) cattle culling, (v) disease and fertility, and (vi) milk production. A schematic description of the LNE model and abbreviated entities in the model are presented in Figure 1. The first step is to calculate N loss or gain of each compartment and the second step to calculate lifetime N loss or gain taking into account the replacement rate of the herd and the number of lactating cattle required to achieve a specified annual herd milk yield. Then, N use efficiencies are calculated as follows:
 $$\matrix{ {{\rm ReplNE \,{\equals}\, N}_{{{\rm OLW}}} {\rm / }\left( {{\rm N}_{{{\rm OLW}}} {\rm {\plus} N}_{{{\rm Lrepl}}} } \right)} \cr {{\rm LactNE \,{\equals}\, N}_{{{\rm Omilk}}} {\rm / }\left( {{\rm N}_{{{\rm Omilk}}} {\rm {\plus} N}_{{{\rm Llact}}} } \right)} \cr {{\rm LNE \,{\equals}\, N}_{{{\rm Prod}}} {\rm / }\left( {{\rm N}_{{{\rm Prod}}} {\rm {\plus} N}_{{{\rm Lrepl}}} {\rm {\plus} N}_{{{\rm Llact}}} } \right)} \cr } $$
where, ReplNE is the replacement N use efficiency, NOLW the N retained in replacement heifers, NLrepl the N lost for replacement cattle, LactNE the lactation N use efficiency, NOmilk the milk N output, NLlact the N losses in lactation, NProd productive N outputs (as milk and meat).
Schematic description of lifetime nitrogen (N) use efficiency (LNE) model for dairy cattle. NOLW=N retained in replacement heifer; NLgr=N lost for heifer growth; NLhm=N lost due to heifer mortality; NGhm=N gain due to heifer mortality; NLpreg=N lost in pregnancy; NLcul=N lost due to cattle culling; NGsl=N gain due to cattle slaughter; NLop=Opportunity N losses; NOmilk=Milk N output; NLmilk=N lost during milk production; NL1st=N lost to 1st calving; NLrepl=N lost for replacement cattle; NLlact=N losses in lactation; NProd=produced N; ReplNE=replacement N use efficiency; LactNE=lactation N use efficiency; LNE=lifetime N use efficiency.

The sensitivity of the model to variation in farm and animal-related inputs was evaluated with a Monte Carlo simulation using @Risk version 7 (Palisade, West Drayton, UK). A default farm situation was constructed based on published data related to typical dairy farming in the United Kingdom (Royal et al., Reference Royal, Pryce, Woolliams and Flint2002; Coffey et al., Reference Coffey, Hickey and Brotherstone2006; Brickell et al., Reference Brickell, McGowan, Pfeiffer and Wathes2009a, Reference Brickell, McGowan and Wathes2009b and Reference Brickell, Bourne, McGowan and Wathes2009c; Brickell and Wathes, Reference Brickell and Wathes2011). Diets for growing heifers were formulated using the Cornell Net Carbohydrate and Protein System (CNCPS; Van Amburgh et al., Reference Van Amburgh, Collao-Saenz, Higgs, Ross, Recktenwald, Raffrenato, Chase, Overton, Mills and Foskolos2015) assuming heifers were grazing ryegrass (22% CP). Probability density functions were fit to farm and animal inputs. All variables were described with a normal distribution. Frequency distributions for model outputs were then generated using a Monte Carlo simulation with 10 000 iterations.
Results and discussion
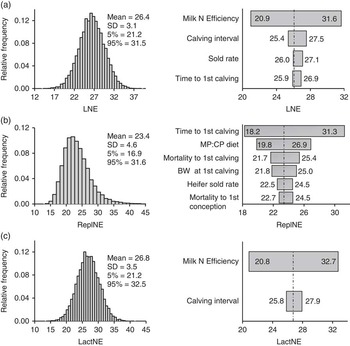
The greatest proportion of lifetime N losses were accounted for by NLmilk (86.1% of total), followed by NLrepl (9.8%). Opportunity losses (NLop) accounted for 2.5% of overall losses. In terms of efficiency, LNE ranged from 21.2% to 31.5%, ReplNE from 16.9% to 31.6% and LactNE from 21.2% to 32.5% (Figure 2), reflecting the high variability in the data set.
Frequency distributions and tornado diagrams showing the change in means outputs for (a) lifetime N use efficiency (LNE), (b) replacement N use efficiency (ReplNE) and (c) lactation N use efficiency (LactNE). MP=metabolisable protein.

The current study verified the dominant effect of MNE on overall LNE. Nitrogen in milk is the principal productive output of dairy cattle and is mainly driven by dry matter intake (Huhtanen and Hristov, Reference Huhtanen and Hristov2009). Therefore, NLmilk becomes the major determinant of total N losses and consequently its utilisation efficiency is the major determinant of LNE. However, we detected specific non-diet-related variables that also affect LNE. In particular, calving interval, an indicator of herd fertility, affected both LactNE and LNE, and cattle sold rate, a herd health indicator, affected LNE. Moreover, NLrepl seems to have a significant contribution to total N losses and LNE with its primary variable, time to first calving, affecting LNE. Replacement cattle are not only an important source of N losses but also contribute to overall cost and profitability of dairy production. Therefore, we included ReplNE to specifically detect variables of importance. Our analyses suggest that variation in time to first calving led to a change in ReplNE from 18.2% to 31.3% and this change was greater than that caused by diet variation under grazing feeding systems (dietary ratio of metabolisable protein to CP, as calculated by CNCPS). We modelled heifer mortality in five stages (perinatal, neonatal, calf up to 6 months old, heifer from 6 months to first conception, and heifer from first conception to first calving; Brickell et al., Reference Brickell, Bourne, McGowan and Wathes2009c). Early-stage calf mortality did not affect ReplNE, but those of heifers did. Moreover, variation in mortality to first calving caused greater changes in ReplNE than variation in mortality to first conception, probably because this stage included heifers that failed to conceive.
With the current study, we provided a herd model that is sensitive in elements of diet, fertility and health. These elements may be directly affected by climate change, and increasing LNE can help mitigate the outputs of greenhouse gases. Therefore, the LNE model may be useful in assessing the impact of climate change on N use efficiency of dairy cattle.
Acknowledgements
Financial support was provided by the Welsh Government and Higher Education Funding Council for Wales through the Sêr Cymru National Research Network for Low Carbon, Energy and Environment. Project: Consequential Life Cycle Assessment of Environmental and Economic Effects of Dairy and Beef Consolidation and Intensification Pathways – ‘Cleaner Cows’.