Aggression occurs quite frequently among adolescents, especially those living in urban impoverished communities. For instance, almost one-third of adolescents are involved in aggression and victimization (Nansel et al., Reference Nansel, Overpeck, Pilla, Ruan, Simons-Morton and Scheidt2001; Robers, Kemp, Truman, & Snyder, Reference Robers, Kemp, Truman and Snyder2013), which are associated with a myriad of negative outcomes, including peer relationship difficulties, academic deficiencies, internalizing problems, and social problem-solving deficits (Martino, Ellickson, Klein, McCaffrey, & Edelen, Reference Martino, Ellickson, Klein, McCaffrey and Edelen2008). Further, peer aggressors who do not receive early intervention and support have higher rates of conduct problems, antisocial behaviors, and subsequent mental health difficulties (Schaeffer, Petras, Ialongo, Poduska, & Kellam, Reference Schaeffer, Petras, Ialongo, Poduska and Kellam2003; Thompson et al., Reference Thompson, Tabone, Litrownik, Briggs, Hussey and English2011), while also experiencing challenges in their interpersonal relationships as they reach adulthood (Wolke, Copeland, Angold, & Costello, Reference Wolke, Copeland, Angold and Costello2013). These at-risk youth often experience high levels of both overtFootnote 1 and relational (manipulating other's social standing or peer reputation through rumors and social exclusion; Crick & Grotpeter, Reference Crick and Grotpeter1995) aggression. As such, it is crucially important to better understand factors that are associated with aggression and violence.
In the next sections, we will provide the theoretical rationale for why we expect three different domains of variables to be related to aggressive behavior. The first domain consists of three social–cognitive variables including the hostile attributional bias, knowledge of social information processing (SIP) steps, and general beliefs about aggression. The second domain includes feelings of distress and perceptions of victimization, whereas the third domain includes prosocial factors such as leadership efficacy, perceptions of community involvement, and self-esteem.
SIP and the Hostile Attributional Bias
There is a large body of literature indicating that a range of social–cognitive variables, and especially deficits in these areas, are associated with aggression (e.g., Bradshaw, Rodgers, Ghandour, & Garbarino, Reference Bradshaw, Rodgers, Ghandour and Garbarino2009; Calvete & Orue, Reference Calvete and Orue2011; Pettit & Mize, Reference Pettit, Mize, Flannery, Vazsonyi and Waldman2007). For example, SIP theory suggests that aggressive youth demonstrate SIP deficits in encoding social cues, interpreting these cues (often misinterpreting others’ intentions as being hostile and on purpose, termed a hostile attributional bias), selecting social goals (e.g., they are more likely to have goals of being dominant or seeking revenge), generating alternative solutions within social conflict situations, evaluating potential alternative solutions, and enacting behaviors (Crick & Dodge, Reference Crick and Dodge1994; Vasey, Dalgleish, & Silverman, Reference Vasey, Dalgleish and Silverman2003). Of the social processing steps mentioned above, the hostile attributional bias (Step 2, interpretations) has received the most attention, possibly owing to research suggesting that it is associated with the development and maintenance of aggression and violence (de Castro, Veerman, Koops, Bosch, & Monshouwer, Reference de Castro, Veerman, Koops, Bosch and Monshouwer2002). As a result, the development of interventions to address aggression among youth have often focused on social–cognitive retraining, especially emphasizing the importance of helping these at-risk youth more accurately interpret others’ intentions (Second Step: Frey, Nolen, Van Schoiack Edstrom, & Hirschstein, Reference Frey, Nolen, Van Schoiack Edstrom and Hirschstein2005; Friend to Friend: Leff et al., Reference Leff, Angelucci, Goldstein, Cardaciotto, Paskewich, Grossman, Zins, Elias and Maher2007, Reference Leff, Gullan, Paskewich, Abdul-Kabir, Jawad and Grossman2009; Preventing Relational Aggression in Schools Everyday: Leff, Waasdorp, et al., Reference Leff, Waasdorp, Paskewich, Gullan, Jawad and MacEvoy2010; Coping Power Program: Lochman & Wells, Reference Lochman and Wells2003, Reference Lochman and Wells2004). Further, a recent study demonstrated that a more general knowledge of SIP steps and anger management is also associated with decreases in aggression (Leff, Cassano, MacEvoy, & Costigan, Reference Leff, Cassano, MacEvoy and Costigan2010). Although the relationships between social cognitions and aggression have been heavily researched (e.g., Bradshaw et al., Reference Bradshaw, Rodgers, Ghandour and Garbarino2009; Calvete & Orue, Reference Calvete and Orue2011; Pettit & Mize, Reference Pettit, Mize, Flannery, Vazsonyi and Waldman2007), the majority of studies have not been conducted in the context of an urban, impoverished community composed of minority youth. Thus, this is one of the main goals for the present manuscript.
Expanding the Consideration of Social–Cognitive Factors to Include More General Beliefs About Violence
Children's general beliefs about aggression and violence is another critical social–cognitive variable to examine, especially among urban ethnic minority youth. These high-risk individuals are often exposed to high rates of violence within these neighborhoods, combined with a high percentage of single-parent homes, poverty, and limited resources, resulting in minority children being especially vulnerable to further violence, drug use, and gang involvement as they get older (Stoddard, Henly, Sieving, & Bolland, Reference Stoddard, Henly, Sieving and Bolland2011; Teitelman et al., Reference Teitelman, McDonald, Wiebe, Thomas, Guerra and Kassam-Adams2010). In addition, many researchers have described urban violence among African American males as being related to a combination of complex factors including attitudes and behaviors that are part of their sociocultural context (Bennett & Fraser, Reference Bennett and Fraser2000). For instance, Bennett and Fraser indicate that perceived violations of respect like making eye contact for a split second too long and/or appearing to be scared or afraid within urban high-risk communities can reinforce a belief structure that values aggression and appearing tough in front of one's peer group. Many factors may contribute to urban adolescent minority youth developing beliefs in the importance of responding with aggression when faced with conflict, in order to prevent others from thinking they are “soft” or “cowardly.” These include being reinforced by peers and parents who strongly value standing up for oneself and may not value as much more traditionally appropriate social participation (Fraser, Reference Fraser1996). In addition, children exposed to urban high-risk neighborhoods and schools may have peers who reinforce their aggressive responding toward others. In the current study, we wished to better understand whether youths’ general beliefs about the use of aggression and violence would be related to aggressive behavior, above and beyond the previously demonstrated relationships between hostile attributional bias and general knowledge of SIP steps and aggression.
Peer Victimization and Distress: Associations With Aggression and Violence
Another set of important variables that have been shown to be associated with aggression and violence include indices of emotional distress and peer victimization. At a conceptual level, SIP theory posits not only that aggressive youth experience deficits at each SIP step but also that emotional processing is involved at each decision making step. Research also suggests that victims of peer aggression and violence experience a host of short- and long-term negative consequences. For instance, victims often exhibit a range of internalizing difficulties, including depression (Arseneault et al., Reference Arseneault, Walsh, Trzesniewski, Newcombe, Caspi and Moffitt2006; Reijntjes, Kamphuis, Prinzie, Boelen, & Telch, Reference Reijntjes, Kamphuis, Prinzie, Boelen and Telch2011), loneliness and social anxiety (Juvonen & Graham, Reference Juvonen and Graham2001), peer relationship difficulties (Hodges & Perry, Reference Hodges and Perry1999), and later psychological maladjustment and school problems (Graham, Bellmore, & Mize, Reference Graham, Bellmore and Mize2006). In addition, peer victimization has also been related to increased rates of aggression and delinquency (e.g., Khatri, Kupersmidt, & Patterson, Reference Khatri, Kupersmidt and Patterson2000; Kochenderfer-Ladd, Reference Kochenderfer-Ladd2003). While the majority of these studies have examined the effects of being a victim of overt aggression, more recent studies also suggest that being a victim of relational aggression is associated with a range of negative comorbidities, including an increased risk for exhibiting relationally aggressive behaviors (Sullivan, Farrell, & Kliewer, Reference Sullivan, Farrell and Kliewer2006). Specifically, Sullivan et al. found that being the victim of overt aggression was associated with high levels of overtly and relationally aggressive behaviors and delinquency for urban predominately African American eighth graders. Further, being the victim of relational aggression was associated with high levels of overt aggression and drug use for girls and high levels of relational aggression among boys. Some have speculated that peer victims may have limited and largely unproductive peer interactions, making them more likely to retaliate against their peers (Hanish & Guerra, Reference Hanish and Guerra2002).
The level of distress one feels when faced with a peer conflict could influence the likelihood of displaying aggressive behaviors and may also be associated with the form (e.g., relational or overt) of conflict. Preliminary research has supported this. Crick et al. (Reference Crick, Grotpeter and Bigbee2002) found that youth who frequently perpetrate relational aggression (e.g., excluding peers) demonstrate more emotional distress in relational as opposed to instrumental conflicts (e.g., being bumped from behind). In contrast, those frequently involved in overt/instrumental conflict situations demonstrate greater distress in overt conflict as compared to relational conflict situations. Despite this potential link between emotional distress and aggressive responding, additional research is needed to better understand the association between emotional distress and peer conflict and aggression. As such, this is one of the goals of the current paper.
Self-Esteem, Community Engagement, and Leadership
The association between social–cognitive variables and aggression, and between feelings of distress/victimization and aggression can be explained by the SIP theoretical framework, but there are additional malleable positive variables that are also associated with aggression. Although there is not as strong of a theoretical rationale for these variables’ association with aggression, prior research has demonstrated that these types of positive factors, often thought of as being protective and resilient features, are important in interventions addressing aggression. In addition, given that community stakeholders involved in our recent research indicated that they felt that many of the traditional aggression prevention programs did not adequately address leadership and community involvement, we thought that this set of prosocial variables may address a relative gap in the literature base.
Numerous studies have examined the association between overall self-esteem and a range of both positive and negative characteristics, generally finding that high self-esteem is related to positive physical and mental health, whereas low-esteem is related to delinquency, oppositional behavior, and substance abuse (e.g., Donnellan, Trzesniewski, & Robins, Reference Donnellan, Trzesniewski and Robins2005, Reference Donnellan, Trzesniewski, Robins, Chamorro-Premuzic, von Stumm and Furnham2011; Fergusson & Horwood, Reference Fergusson and Horwood2002; Greenberg, Reference Greenberg2008; Weber & Robinson Kurpius, Reference Weber and Robinson Kurpius2011). For example, a series of studies using multiple-method, multiple-informant measures of self-esteem and externalizing problems (aggressive behavior, delinquency, and antisocial behavior) concluded that low self-esteem and a range of externalizing behaviors were associated at a small to moderate effect size (Donnellan et al., Reference Donnellan, Trzesniewski and Robins2005), even after controlling for a range of potential confounding variables, including socioeconomic status, IQ, parent–child relationship, and peer relationships. Another study found that adolescents with lower self-esteem were at increased risk for physical and mental health difficulties, economic hardship, and being convicted of a crime as an adult (Trzesniewski, Donnellan, & Moffitt, Reference Trzesniewski, Donnellan and Moffitt2006). Thus, the literature suggests that self-esteem may also be associated with aggressive behavior. At the same time, there are other areas that influence self-esteem that require examination, especially among minority youth. Specifically, community engagement and leadership self-efficacy have been shown to be an important aspect of positive social development among minority youth (e.g., Hull, Kilbourne, Reece, & Husaini, Reference Hull, Kilbourne, Reece and Husaini2008), though few studies have simultaneously examined whether indices of community engagement and leadership self-efficacy are associated with reduced aggression.
Moreover, although programming to reduce aggressive youth behaviors often includes modules to improve self-esteem (Allen-Meares, Montgomery, & Kim, Reference Allen-Meares, Montgomery and Kim2013), it often lacks explicit mechanisms for increasing community engagement and enhancing self-efficacy in leadership (Edwards, Reference Edwards2001). This is somewhat surprising given research suggesting positive associations between youth empowerment and positive social and emotional development (Linnenbrink & Pintrich, Reference Linnenbrink and Pintrich2002). The lack of emphasis on constructs such as community involvement and leadership in traditional aggression prevention programs has led some researchers to speculate that aggression prevention programs may be less than optimally effective, in part because they are not directly addressing mechanisms for helping youth become more accountable leaders within their schools and neighborhoods (Edwards, Reference Edwards2001). This may be especially relevant for urban minority youth given research showing that in order for aggression programs to be most effective, they should emphasize the promotion of community involvement and leadership (Leff, Thomas, et al., Reference Leff, Thomas, Vaughn, Thomas, MacEvoy and Freedman2010). Although additional research supports these general findings by indicating that one's feelings of empowerment and sense of responsibility are related to positive youth outcomes (Gullan, Power, & Leff, Reference Gullan, Power and Leff2013), the relationship between these prosocial predictors and youth aggression has not been examined in the context of aggression prevention programming, especially for urban ethnic minority youth. As such, in the current study, we wished to better understand whether youths’ perspective of their own community involvement and leadership effectiveness were related to aggressive behavior, and whether these relationships contributed to the prediction of aggression above and beyond self-esteem. If so, these relationships have important implications for the development and adaptation of aggression prevention programs to support minority youth living in impoverished community settings.
Study Goals
In the current study, we wished to examine several areas that have largely been understudied in the context of African American adolescents within urban community settings. We first hypothesized an association between the social–cognitive variables and a composite score of aggression (combined subscales of youth- and parent-reported overt aggression, externalizing behaviors, and relational aggression),Footnote 2 in which we expected more hostile attributional bias, less general knowledge of SIP and anger management, and more broad beliefs about aggression and violence to be associated with more aggressive behavior. Further, we explored the hypothesis that general knowledge of SIP and beliefs about aggression and violence would add significantly to the prediction of aggression, above and beyond the contributions of a hostile attributional bias. Second, we hypothesized that rates of overt and relational victimization and feelings of distress in social situations would be positively related to rates of aggression. We also conducted post hoc analyses to investigate whether victimization and distress contributed separately and uniquely to the model. Third, we hypothesized that a range of prosocial factors (self-esteem, community involvement, and leadership efficacy) would be negatively associated with aggression. We also wished to explore follow-up analyses to determine whether perceptions of community involvement and leadership efficacy significantly added to the prediction of aggressive behavior after accounting for self-esteem.
Following SIP theory and also given that much prior research has examined social–cognitive factors and their association with aggression, we wished to introduce the social–cognitive set of variables prior to the other domains (i.e., victimization/emotional distress and prosocial factors) in our hierarchical regression analyses. Next, we chose to include the victimization and distress variables because emotional distress/processing is often closely related to the social–cognitive variables. For example, the SIP steps include emotional processing at each step; therefore, we thought conceptually that this set of variables should be entered next in the model. Finally, we wished to examine whether a set of protective and resilience factors were associated with aggression. We predicted that the victimization/emotional distress domain and the prosocial and resilience factors domain would each explain significant variability in the prediction of aggressive behavior when entered as the second and third steps within the hierarchical regression analyses.
Method
This study is part of a larger research project involving the evaluation of a community-based youth violence prevention and leadership promotion program for 10- to 14-year-old youth in a range of after-school settings, including summer camps (Leff, Thomas, et al., Reference Leff, Thomas, Vaughn, Thomas, MacEvoy and Freedman2010). The study received approval from the authors’ university institutional review board. After-school sites were identified as eligible to participate if they were located within one of the target urban neighborhoods, were not currently implementing any type of violence prevention programming, and served at least 20 youth regularly. Eligible sites then participated in an organizational assessment structured interview, which was designed by the study team of researchers and community partners in order to evaluate the match between sites and the violence prevention research program (Baker, Vaughan, Barnhart-Wilson, & Leff, Reference Baker, Vaughan, Barnhart-Wilson and Leff2012). The information gathered during the organizational assessment structured interview is converted to a 13-item Likert scale with a theoretical range of 13 to 39. Scores of at least 30 on the organizational assessment rating scale generally indicate an overall program structure and clear mission, a stable leadership structure, an interest in forming partnerships to prevent youth violence, and a designated point person who could serve as the on-site leader for the program.
Six eligible sites deemed good matches by scores of at least 30 on the organizational assessment were enrolled, and the violence prevention and leadership promotion program was implemented in a systematic stepped-wedge cluster randomized trial (e.g., Brown & Lilford, Reference Brown and Lilford2006). Once partnered with a site, all eligible 10- to 14-year-old youthFootnote 3 who consistently attended the after-school program within the site were invited to enroll in the program. Youth who were outside the eligible age range, who did not speak English, or who had a developmental/physical disability making it difficult to complete assessment measures were excluded. The study, including details about the intervention, has been elaborated elsewhere (Leff, Thomas, et al., Reference Leff, Thomas, Vaughn, Thomas, MacEvoy and Freedman2010).
Participants
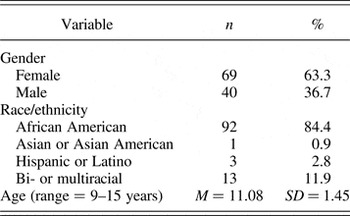
Participants in the current study include 109 9- to 15-year-old youth who participated in the pretest portion of the larger research project, along with their parents or caregivers. Most youth (36.7% male) identified as African American (84.4%) or biracial or multiracial (11.9%) and were on average 11 years old. See Table 1 for youth demographic information. Caregivers of participating youth were mothers (n = 69), fathers (n = 11), both mothers and fathers (n = 3), grandmothers (n = 5), a grandfather (n = 1), aunts (n = 6), a foster mother (n = 1), or caregiver unspecified (n = 13). Although we were not able to collect specific family information from a portion of our sample,Footnote 4 caregivers completing this information were primarily female (86.9%), identified as African American (93.1%) or biracial or multiracial (5.2%), and were on average 44 years old. Most caregivers reported being single (48.3%), married (29.3%), or divorced/separated (19.0%). With regard to educational level, most caregivers were high school graduates (18.6%), had some college (32.2%), or had graduated from college (35.6%).
Participant demographics (n = 109)

Procedure
Youth data collection
Parents consented for their children to participate in the research project. Data collection occurred at the after-school site and lasted approximately 40–50 min. Youth completed a packet of measures in small groups facilitated by trained project staff. Project staff worked with youth to determine if they were comfortable reading and responding to the items independently or if they preferred to have the items read out loud. Youth were provided with verbal praise and snacks for their participation. Pretest assessments typically occurred 1 week before the start of the intervention.
Caregiver data collection
Measure packets were sent home to caregivers via their children. Caregivers completed the measures independently either on-site or at home, depending on their preference. Caregivers received a $15 gift card to a local grocery store in appreciation for each evaluation packet they completed.
Measurement of aggression
Youth-report measures of aggressive behavior
Youth completed three self-report measures of aggression. First, they completed the 15-item Children's Social Behavior Scale—Self-Report (Crick & Grotpeter, Reference Crick and Grotpeter1995). This measure assesses youths’ perceptions of their relationships with their peers and includes 5 relational and 3 overt aggression items (e.g., “When they are mad at someone, some kids get back at the person by not letting the person be in their group anymore. How often do you do this?” and “Some kids hit other kids at school. How often do you do this?”). Items are rated from 1 (never) to 5 (all the time). Relational and overt aggression subscales are created by averaging the corresponding items, with higher scores indicating more aggressive behavior. Internal consistency and construct validity have been demonstrated for this measure (see Crick & Grotpeter, Reference Crick and Grotpeter1995).
Second, youth completed a version of the five-item oppositional/defiant subscale of the IOWA Conners Teacher Rating Scale (IOWA CTRS; Loney & Milich, Reference Loney, Milich, Wolraich and Routh1982) adapted for youth self-report. The scale is rated on a scale from 1 (not at all) to 4 (very much) and includes items such as “Lose my temper.” Items are averaged, and higher scores on the IOWA CTRS indicate more aggression. The IOWA CTRS is widely used and has been associated with strong reliability and validity (Casat, Norton, & Boyle-Whitesel, Reference Casat, Norton and Boyle-Whitesel1999; Loney & Milich, Reference Loney, Milich, Wolraich and Routh1982; Pelham, Milich, Murphy, & Murphy, Reference Pelham, Milich, Murphy and Murphy1989). In addition, construct equivalence appears to exist between children from different ethnic groups (Reid, Casat, Norton, Anastopoulos, & Temple, Reference Reid, Casat, Norton, Anastopoulos and Temple2001).
Third, youth completed the Youth Self-Report (YSR; Achenbach, Reference Achenbach1991; Achenbach & Rescorla, Reference Achenbach and Rescorla2001) aggressive behavior subscale. This 17-item subscale includes items such as “I get in many fights” that are rated on a 3-point Likert scale ranging from 0 (not true) to 2 (very true or always true). Raw scores on items were averaged to create the aggressive behavior subscale score, with higher scores indicating more aggressive behavior. Excellent reliability and validity has been demonstrated for the YSR (Achenbach, Reference Achenbach1991; Achenbach & Rescorla, Reference Achenbach and Rescorla2001), including in samples of diverse youth (Ivanova et al., Reference Ivanova, Achenbach, Rescorla, Dumenci, Almqvist and Bilenberg2007).
Caregiver-report measures of aggressive behavior
Parents also completed three measures evaluating youth aggressive behavior. First, they completed the Children's Social Behavior Scale—Parent Report (CSBS-Parent; Crick, Reference Crick2006). This scale was developed based upon similar peer- and teacher-report measures (Crick & Grotpeter, Reference Crick and Grotpeter1995) and was subsequently adapted for parent report (Casas et al., Reference Casas, Weigel, Crick, Ostrov, Woods and Jansen Yeh2006; Ostrov & Bishop, Reference Ostrov and Bishop2008; Tackett & Ostrov, Reference Tackett and Ostrov2010). Prior studies have demonstrated that the subscales of the CSBS have adequate internal consistency (Ostrov & Bishop, Reference Ostrov and Bishop2008; Tackett & Ostrov, Reference Tackett and Ostrov2010) and convergent and divergent validity (Tackett & Ostrov, Reference Tackett and Ostrov2010). The five-item relational aggression (e.g., “Your child spreads rumors or gossips about other kids”) and four-item overt aggression (e.g., “Your child hits or kicks other kids”) subscales utilized in this study mirror those of the youth report (Crick & Grotpeter, Reference Crick and Grotpeter1995). Items were averaged to create subscale scores, and higher scores indicate more aggressive behavior.
Second, parents completed the five-item oppositional/defiant subscale of the IOWA CTRS (Loney & Milich, Reference Loney, Milich, Wolraich and Routh1982). The items are highly similar to those completed by youth and described above (e.g., “Has temper outbursts [explodes and has unpredictable behavior]”), and the scoring is identical.
Third, parents completed the Eyberg Child Behavior Inventory (ECBI; Eyberg & Pincus, Reference Eyberg and Pincus1999). The 36-item ECBI problem intensity subscale was used in this study. The problem intensity subscale evaluates a variety of problem behaviors, including “Argues with parents about rules” and “Sasses or talks back to adults.” Items are rated on a 7-point Likert scale ranging from 1 (never) to 7 (always). Scores were averaged to protect against missing data, with higher scores indicating more problem behavior. The ECBI has been used with samples including low-income urban African American youth, has demonstrated extremely strong reliability and validity, and shows moderate effect sizes in intervention studies (Kacir & Gordon, Reference Kacir and Gordon1999; Webster-Stratton, Hollinsworth, & Kolpacoff, Reference Webster-Stratton, Hollinsworth and Kolpacoff1989).
Creation of the aggression composite
An aggression composite score was created from the youth-report Children's Social Behavior Scale relational and overt aggression subscales, the IOWA CTRS oppositional/defiant subscale, and the YSR aggressive behavior subscale along with the parent-report CSBS relational and overt aggression subscales, the IOWA CTRS oppositional/defiant subscale, and the ECBI problem intensity subscale. Principal axis factoring was used as a data reduction strategy (Jolliffe, Reference Jolliffe2002).Footnote 5 Creating an aggression composite score capitalizes on the multiple measures and informants utilized in this study while managing the risk of Type I error. Listwise deletion was used in the creation of the aggression composite, resulting in a sample of 109 youth.
Measurement of predictors
Social–cognitive measures
In the Cartoon-Based Hostile Attributional Bias Measure (HAB; Leff et al., Reference Leff, Crick, Angelucci, Haye, Jawad and Grossman2006; Leff, Lefler, Khera, Paskewich, & Jawad, Reference Leff, Lefler, Khera, Paskewich and Jawad2011) youth are asked to respond to 10 written and cartoon vignettes, 5 that depict relationally oriented social situations and 5 that illustrate overtly aggressive oriented social situations. For each vignette, youth are asked two questions used to determine a hostile attributional bias in both relationally and overtly aggressive situations. Youths’ intentionality responses, indicated by their responses of “intentional” (score of 1 point) or “unintentional” (score of 0) on two questions per vignette, are then summed across the relationally or overtly provocative vignettes, with scores ranging from 0 to 10. Higher scores indicate higher levels of hostile attributional bias. The HAB has demonstrated strong psychometric properties (Leff, Cassano, et al., Reference Leff, Cassano, MacEvoy and Costigan2010; Leff et al., Reference Leff, Crick, Angelucci, Haye, Jawad and Grossman2006, Reference Leff, Lefler, Khera, Paskewich and Jawad2011); has been utilized in school-based intervention work with urban youth (Leff et al., Reference Leff, Gullan, Paskewich, Abdul-Kabir, Jawad and Grossman2009); and in the current study, is associated with internal consistencies of 0.73 and 0.83 for relational hostile attributional bias and overt hostile attributional bias, respectively.
The Knowledge of Anger Problem-Solving Measure (KAPS; Leff, Cassano, et al., Reference Leff, Cassano, MacEvoy and Costigan2010) is a 15-item multiple-choice test designed to assess youths’ general knowledge of the steps underlying the SIP model of aggression and of anger management techniques (Crick & Dodge, Reference Crick and Dodge1994). Items are scored according to the key (see Leff, Cassano, et al., Reference Leff, Cassano, MacEvoy and Costigan2010). Scored items are summed; summed scores range from 0 to 15, with higher scores associated with more knowledge of SIP and anger management. Example questions include “If you can't tell if someone did something on purpose, what is the best thing to do?” and “Which of the following is the best way to stay calm?” Extensive item analyses of the KAPS have been conducted, and the KAPS has demonstrated strong ecological and convergent validity and adequate test–retest reliability among urban African American girls and boys (Leff, Cassano, et al., Reference Leff, Cassano, MacEvoy and Costigan2010; Leff, Waasdorp, et al., Reference Leff, Waasdorp, Paskewich, Gullan, Jawad and MacEvoy2010).
Finally, the Beliefs Supportive of Violence Scale (Bosworth, Espelage, DuBay, Daytner, & Karageorge, Reference Bosworth, Espelage, DuBay, Daytner and Karageorge2000) was utilized to evaluate youths’ attitudes toward aggression and violence. This six-item scale was originally adapted from the University of Texas Health Science Center Aggression Scale (Dahlberg, Toal, & Behrens, Reference Dahlberg, Toal and Behrens1998; Espelage, Bosworth, & Simon, Reference Espelage, Bosworth and Simon2000, Reference Espelage, Bosworth and Simon2001) and includes items such as “If I walked away from a fight I would be a coward or a chump” and “It's okay to hit someone who hits you first.” Items are rated from 1 (strongly disagree) to 5 (strongly agree), with higher scores associated with stronger beliefs supportive of violence. Previous evaluations have demonstrated reliability and validity of the Beliefs Supportive of Violence Scale (Bosworth et al., Reference Bosworth, Espelage, DuBay, Daytner and Karageorge2000). Principal components analysis with varimax rotation conducted with the current sample revealed two factors (beliefs supportive of violence, beliefs supportive of nonviolent approaches to managing anger and difficult social situations). Four-item factor 1, beliefs supportive of violence, is utilized in this study. The Cronbach α for this factor is 0.54 in the current study.
Victimization and distress measures
Parents reported on youth victimization by completing the relational and overt victimization subscales of the Children's Social Experience Questionnaire (Crick, Reference Crick1998), described above. This measure was adapted from Crick and Grotpeter (Reference Crick and Grotpeter1996). The three-item relational victimization (e.g., “Your child is the target of rumors or gossip in the playgroup”) and three-item overt victimization (e.g., “Your child gets hit or kicked by other kids”) subscales are scored identically to the CSBS subscales discussed above. Both the relational and overt victimization subscales were associated with adequate internal consistency in this study, with Cronbach αs of 0.76 and 0.88, respectively.
Youth reported on their experiences of distress in the context of relationally and overtly aggressive situations using the HAB (Leff et al., Reference Leff, Crick, Angelucci, Haye, Jawad and Grossman2006, Reference Leff, Lefler, Khera, Paskewich and Jawad2011). For each of 10 written and cartoon vignettes, youth are asked two questions (e.g., “How upset would you be if the things in this story really happened to you?” and “How mad would you be if the things in this story really happened to you?”) used to determine their level of distress. Level of distress is measured by youths’ responses on a 3-point Likert scale ranging from 1 (not at all) to 3 (very). Youths’ feelings of distress are summed across the relational or overt vignettes, resulting in scores ranging from 10 to 30. Higher scores indicate greater feelings of distress. Youths’ distress in both the relationally and overtly aggressive situations was associated with adequate internal consistency in this study, with Cronbach αs of 0.87 and 0.74, respectively.
Prosocial measures
The Hare Area Specific Self-Esteem Scale (HSES; Shoemaker, Reference Shoemaker1980) measures self-esteem, or self-perceptions of worth and importance, across peer, home, and school contexts. The global subscale of an abbreviated, 10-item version of the HSES was utilized in this study (e.g., “I am not as popular as other people my age” and “Other people think I am a lot of fun to be with”; α = 0.73). Youth rate all items on a 4-point Likert scale ranging from 1 (strongly disagree) to 4 (strongly agree); the mean is calculated with higher values associated with greater self-esteem. The reliability and validity of the HSES has been supported, including in research with urban, African American adolescents (Hare, Reference Hare1977; Vacek, Coyle, & Vera, Reference Vacek, Coyle and Vera2010).
The Youth Asset Survey (YAS; Oman, Vesely, et al., Reference Oman, Vesely, McLeroy, Harris-Wyatt, Aspy and Rodine2002) evaluates eight youth developmental assets. One asset, evaluated by the six-item community involvement subscale, was utilized in this study (e.g., “You work to make your community [or neighborhood] a better place,” α = 0.81). As a result of community feedback, we added the word “neighborhood” to questions that asked about the “community.” Youth rate items from 1 (not at all like you) to 4 (very much like you) on a 4-point Likert scale. Items are averaged, and higher scores are associated with greater levels of community involvement. The YAS has adequate psychometric properties, including demonstrated associations with youth risk behavior, including fighting, truancy, sexual activity, substance use, and involvement with the police (Oman, McLeroy, et al., Reference Oman, McLeroy, Vesely, Aspy, Smith and Penn2002; Oman, Vesely, et al., Reference Oman, Vesely, McLeroy, Harris-Wyatt, Aspy and Rodine2002).
The Leadership Questionnaire was designed for the current study in partnership with members of the target communities in order to address specific aspects of leadership thought to be of particular relevance (Leff, Thomas, et al., Reference Leff, Thomas, Vaughn, Thomas, MacEvoy and Freedman2010). As such, this measure was iteratively developed with community feedback and is thought to have strong ecological validity. The nine-item leadership efficacy subscale was used in the current study (e.g., “I am able to be a good leader in my neighborhood”; α = 0.88). Youth rate all items on a 4-point Likert scale ranging from 1 (strongly disagree) to 4 (strongly agree); the mean of all items is calculated, and higher values are associated with higher rates of leadership efficacy.
Analytic approach
We first evaluated descriptive statistics. Next, we fit a series of regression models, all of which controlled for gender and age.Footnote 6 In the first regression model, we predicted aggression from the social–cognitive variables. In the second regression model, we predicted aggression from youth victimization and distress. In the third regression model, we predicted aggression from the prosocial variables, including self-esteem, community involvement, and leadership efficacy. Following each regression, we also conducted post hoc analyses to determine the contribution of individual variables or sets of variables. In each case, control variables were entered in Step 1. Specifically, following the first regression model, we conducted a post hoc hierarchical regression to determine if knowledge about SIP and beliefs about violence predicted aggression above and beyond traditional social–cognitive variables like hostile attributional bias. In this case, hostile attribution bias was entered as Step 2, knowledge about SIP was entered as Step 3, and beliefs about violence was entered as Step 4. Following the second regression, we conducted exploratory follow-up analyses to determine whether victimization and distress contributed uniquely to the prediction of aggression. In this case, we first entered victimization as Step 2 and distress as Step 3. Following the third regression, we conducted an exploratory post hoc hierarchical regression in order to determine the unique contributions of community involvement and leadership efficacy above and beyond self-esteem. In this case, we first entered self-esteem as Step 2, followed by community involvement as Step 3 and leadership efficacy as Step 4. Finally, a full regression model was fit with all of the predictors. Standardized regression coefficients are presented throughout.
Results
Descriptive statistics
Means and standard deviations of the variables used to create the aggression composite, and intercorrelations between these variables, are presented in Table 2. Youth-report measures of aggression were strongly interrelated, and these correlations were associated with medium to large effect sizes. Similarly, parent-report measures of aggression covaried; effect sizes were consistently large between parent-report measures. Relationships between youth- and parent-report measures of aggression ranged in effect size from small to medium, with the weakest relationships between the mirrored CSBS-Self and CSBS-Parent measures and the strongest relationships between the youth-report YSR and all parent-report measures. Discrepancies between youth- and parent-report measures of aggression are in line with the literature and support our conclusion to capitalize on information from both reporters when creating the aggression composite (e.g., Verhulst, Ende, & van der Ende, Reference Verhulst, Ende and van der Ende1992).
Descriptive statistics for and intercorrelations between the variables used to create the aggression composite

Note: CPRS, Children's Social Behavior Scale, Self-Report; IOWA, IOWA Conners Teacher Rating Scale; YSR, Youth Self-Report; CSBS, Children's Social Behavior Scale; ECBI, Eyberg Child Behavior Inventory.
*p < .05. **p < .01. ***p < .001.
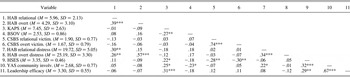
Means and standard deviations of the predictor variables, and the intercorrelations between these variables, are presented in Table 3. The measures evaluating hostile attributional bias, as well as distress related to aggressive situations, tended to cluster together. Similarly, parent reports of relational and overt victimization were also intercorrelated. Knowledge of SIP was negatively associated with beliefs supportive of violence. The prosocial variables were strongly interrelated. The prosocial variables were also predictably related to the other clusters of variables; specifically, higher values on the prosocial variables were associated with more knowledge of SIP. In addition, higher self-esteem was associated with less victimization. More community involvement was associated with fewer beliefs supportive of violence and more distress in the context of relationally aggressive situations. Significant correlations between the predictor variables ranged in size from small–medium to large.
Descriptive statistics for and intercorrelations between the predictor variables

Note: HAB, Hostile Attributional Bias Measure; KAPS, Knowledge of Anger Problem-Solving Measure; BSOV, Beliefs Supportive of Violence Scale; CSBS, Children's Social Behavior Scale; HSES, Hare Area Specific Self-Esteem Scale; YAS, Youth Asset Survey.
*p < .05. **p < .01. ***p < .001.
Predicting aggression from social–cognitive variables
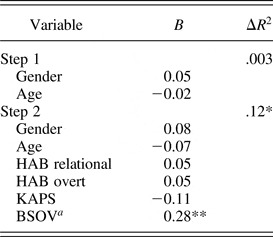
We first fit a regression predicting the aggression composite from hostile attributional bias, knowledge of SIP, and beliefs supportive of violence, controlling for gender and age (see Table 4). Social–cognitive variables explained 12% of the variance in aggression, F (6, 108) = 2.34, p < .05. In order to better understand the unique contributions of beliefs supportive of violence above and beyond the more traditional social–cognitive measures, the associations between these variables and aggression were examined using a hierarchical linear multiple regression in the context of a post hoc analysis. Neither the addition of hostile attributional bias, F (4, 108) = 0.49, p = .74; ΔR 2 = .02, p = .44, nor the addition of knowledge of SIP, F (5, 108) = 1.12, p = .36; ΔR 2 = .05, p = .06, resulted in a significant improvement in fit over the model that included only the control variables. However, the addition of beliefs supportive of violence in the final step did significantly improve the fit of the model (ΔR 2 = .08, p < .01). Thus, contrary to hypotheses, neither hostile attributional bias nor knowledge of SIP was related to youth aggression. However, as predicted, youth who reported having stronger beliefs supportive of violence were more aggressive (b = 0.28, p < .01).
Hierarchical regression predicting aggression from social cognitive variables

Note: HAB, Hostile Attributional Bias Measure; KAPS, Knowledge of Anger Problem-Solving Measure; BSOV, Beliefs Supportive of Violence Scale.
a In post hoc analyses, the hierarchical regression step including BSOV was associated with a significant increase in ΔR 2. Full model R 2 = .12.
*p < .05. **p < .01.
Predicting aggression from victimization and distress
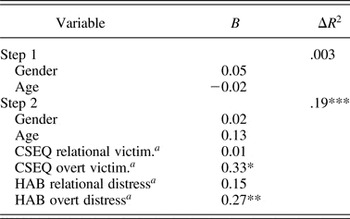
Next, we fit a regression predicting the aggression composite from victimization and experiences of distress in aggressive situations, again controlling for gender and age (see Table 5). Victimization and distress variables explained 20% of the variance in aggression, F (6, 108) = 4.14, p < .001, and significantly improved the fit over the control model (ΔR 2 = .19, p < .001). In order to better understand the unique contributions of victimization and distress to the prediction of aggression, the associations between these two sets of variables and aggression were examined using a hierarchical linear multiple regression in the context of two exploratory post hoc analyses. Due to the exploratory nature of this post hoc analysis, the regression first entered victimization and then distress. The addition of both victimization, F (4, 108) = 2.28, p = .07; ΔR 2 = .08, p < .05, and emotional distress, F (6, 108) = 4.14, p < .001; ΔR 2 = .12, p < .001, resulted in a significant improvements in fit over the model that included only the control variables. In partial support of hypotheses, youth who experienced overt victimization (b = 0.33, p < .05) and distress in overtly aggressive situations (b = 0.27, p < .01) were more aggressive. Contrary to hypotheses, aggression was not associated with youths’ experiences of relational victimization and distress in relationally aggressive situations.
Hierarchical regression predicting aggression from victimization and distress

Note: CSEQ, Children's Social Experience Questionnaire; HAB, Hostile Attributional Bias Measure.
a In post hoc analyses, the hierarchical regression steps including the two victimization variables and the two distress variables were both associated with significant increases in ΔR 2. Full model R 2 = .20.
*p < .05. **p < .01. ***p < .001.
Predicting aggression from prosocial variables
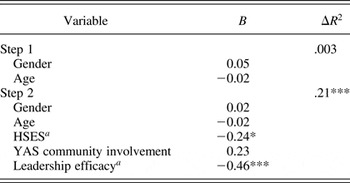
In the next regression, we fit a model predicting the aggression composite from self-esteem, community involvement, and leadership efficacy, controlling for gender and age (see Table 6). Prosocial variables explained 22% of the variance in aggression, F (5, 108) = 5.66, p < .001. In order to better understand the unique contributions of community involvement and leadership efficacy above and beyond self-esteem, the associations between these variables and aggression were examined in a post hoc analysis using a hierarchical linear multiple regression. The addition of self-esteem to the control model significantly improved the fit, F (3, 108) = 3.73, p = .01; ΔR 2 = .09, p = .001. As predicted, youth with higher self-esteem were less aggressive (b = –0.24, p = .01). The addition of community involvement did not significantly improve the fit of the model, F (4, 108) = 2.91, p = .03; ΔR 2 = .004, p = .48. Thus, contrary to the hypothesis, community engagement was not associated with reductions in aggressive behavior. Finally, the addition of leadership efficacy in the final step resulted in a significant improvement in fit over the previous models (ΔR 2 = .12, p < .001). Youth who reported greater leadership efficacy were less aggressive, as hypothesized (b = –0.46, p < .001).
Hierarchical regression predicting aggression from prosocial variables

Note: HSES, Hare Area Specific Self-Esteem Scale; YAS, Youth Asset Survey.
a In post hoc analyses, the hierarchical regression steps including HSES and leadership efficacy were both associated with significant increases in ΔR 2. Full model R 2 = .22.
*p < .05. **p < .01. ***p < .001.
Predicting aggression in the full model
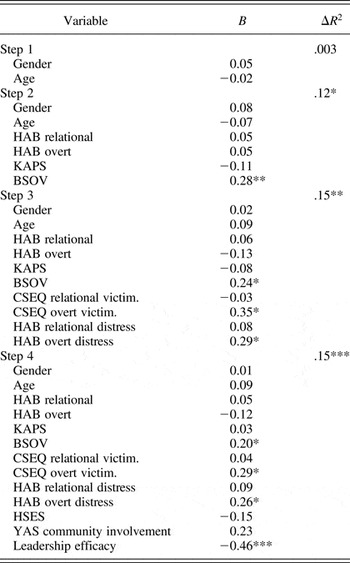
Finally, we fit a hierarchical linear multiple regression predicting aggression from all of the predictors, controlling for gender and age, and entering the social–cognitive variables first, the victimization and distress variables second, and the prosocial variables third (see Table 7). The full model accounted for 41% of the variance in aggression, F (13, 108) = 5.16, p < .001. The addition of the clustered social–cognitive variables, F (6, 108) = 2.34, p = .04; ΔR 2 = .12, p = .01, the victimization and distress variables, F (10, 108) = 3.60, p < .001; ΔR 2 = .15, p = .001, and the prosocial variables (ΔR 2 = .15, p < .001) each resulted in significant improvements of fit. The full model is consistent with the previous three models. Specifically, youth with stronger beliefs supportive of violence (b = 0.20, p = .02), who experience more overt victimization (b = 0.29, p = .03), and who experience greater distress in overtly aggressive situations (b = 0.26, p = .02) are more aggressive. In contrast, youth who endorse greater leadership efficacy are less aggressive (b = –0.46, p < .001). The relationship between aggression and self-esteem became nonsignificant in the full model, though in the direction of the effect remained negative, as predicted (b = –0.15, p = .11).
Hierarchical regression predicting aggression from social cognitive variables, victimization and distress, and prosocial variables

Note: HAB, Hostile Attributional Bias Measure; KAPS, Knowledge of Anger Problem-Solving Measure; BSOV, Beliefs Supportive of Violence Scale; CSEQ, Children's Social Experience Questionnaire; HSES, Hare Area Specific Self-Esteem Scale; YAS, Youth Asset Survey. Full model R 2 = .41.
*p < .05. **p < .01. ***p < .001.
Discussion
A long history of research has demonstrated the importance of using a SIP model to better understand the development and maintenance of aggression (Crick, Grotspeter, & Bigbee, Reference Crick, Grotpeter and Bigbee2002; de Castro et al., Reference de Castro, Veerman, Koops, Bosch and Monshouwer2002; Dodge & Pettit, Reference Dodge and Pettit2003). It is not surprising that many aggression prevention programs, addressing overt and/or relational aggression, have used social–cognitive retraining strategies to help aggressive youth learn to more effectively problem solve in social situations (e.g., Hudley & Graham, Reference Hudley and Graham1993; Leff et al., Reference Leff, Gullan, Paskewich, Abdul-Kabir, Jawad and Grossman2009; Leff, Waasdorp, et al., Reference Leff, Waasdorp, Paskewich, Gullan, Jawad and MacEvoy2010; Lochman & Wells, Reference Lochman and Wells2003). In the current study, we wished to examine whether hostile attributions and other social–cognitive variables would be predictive of aggressive behavior in our sample of urban preadolescent and adolescent youth. As predicted, the social–cognitive domain (hostile attributions, knowledge of SIP steps, and beliefs about aggression and violence) was strongly associated with a composite score of aggression. This is consistent with prior research demonstrating that measures of social problem solving and social–cognitive beliefs are strongly associated with aggression (Crick & Dodge, Reference Crick and Dodge1994; Linder, Werner, & Lyle, Reference Linder, Werner and Lyle2010). However, follow-up testing examining the individual influence of the social–cognitive variables and their association to the composite score of aggression was somewhat surprising, in that hostile attributional biases were not significantly associated with aggression. A closer examination of the literature for urban low-income minority youth may suggest some possible explanations for this. For example, some researchers have suggested that minority youth living in violent urban neighborhoods may learn to be hypervigilant in social situations in order to ensure their safety (Stevenson, Reference Stevenson1997). Thus, a hostile attributional bias may actually serve as a protective factor in some situations that urban, ethnic minority youth may encounter. This is consistent with prior research findings that urban minority youth often experience conflict and violence in their neighborhoods regardless of their own aggression status (Buka, Stichick, Birdthistle, & Earls, Reference Buka, Stichick, Birdthistle and Earls2001).
We also examined whether knowledge of SIP steps and/or beliefs about violence more generally would be positively associated with levels of aggression. One of the strongest findings from the current study was that youth who had stronger beliefs about violence (e.g., beliefs that it is appropriate to use violence to avoid appearing cowardly) were also more likely to exhibit higher levels of aggression. This is consistent with the idea that aggression in urban, violent neighborhoods makes responding to aggression in what is traditionally thought of as more prosocial manner (e.g., ignoring, walking away, or obtaining adult help) less likely and may also place a youth at even higher risk for repeated victimization. Our findings speak to the complexity of youth violence in some urban settings and challenge the widely held premise that violence prevention interventions focused solely on social–cognitive factors will be most sufficient. It appears that, at least in part, there needs to be a greater emphasis on helping to address urban youths’ beliefs about violence. This may speak to the importance of working not only with urban at-risk youth but also with parents, families, and community members who also may share these strong beliefs about the importance of aggression in violence. This is also consistent with a number of aggression prevention programs that have added parental and/or family components to their interventions (e.g., KiVa: Kärnä et al., Reference Kärnä, Voeten, Little, Poskiparta, Kaljonen and Salmivalli2011; Coping Power: Lochman & Wells, Reference Lochman and Wells2004; Olweus Bullying Prevention Program: Olweus & Limber, Reference Olweus, Limber, Jimerson, Swearer and Espelage2010).
The finding on the association between general beliefs of violence and levels of aggression may also be consistent with SIP theory. For instance, it is possible that children's general beliefs about aggression may impact their evaluation of potential responses within social conflict situations (SIP Step 5). It also could be that they represent a particular type of social goal (SIP Step 3) such as one of self-preservation, which may influence subsequent behavioral responding.
The current study suggests that focusing on youths’ emotional responding may be another profitable avenue in aggression prevention and intervention development for urban youth. Our findings suggest that emotional distress in overtly aggressive situations, as well as being a victim of overt aggression, was associated with higher levels of aggression. This finding also speaks to the complexity of aggression in urban underresourced communities and suggests that learning to modulate and regulate one's reaction to difficult social situations should continue to be an important emphasis within aggression intervention programs for urban, low-income minority youth. Although the SIP model features an exploration of how biological vulnerabilities, learning history, and social environment interact with a series of social and emotional processing cues to help determine behavior (Dodge & Pettit, Reference Dodge and Pettit2003), some have articulated that this model does not focus enough attention on emotional processing (see Lemerise & Arsenio, Reference Lemerise and Arsenio2000). Our findings suggest that feelings of distress and experiences of victimization, especially within the context of overtly provocative social situations, may play a critical but currently underemphasized role in aggression prevention programming for urban low-income minority youth.
Given recent research suggesting the importance of empowering youth to feel good about themselves and to become active leaders within their communities (e.g., Gullan et al., Reference Gullan, Power and Leff2013; Leff, Thomas, et al., Reference Leff, Thomas, Vaughn, Thomas, MacEvoy and Freedman2010), we predicted that a range of prosocial behaviors would be associated with less aggressive behavior. As hypothesized, higher levels of global self-esteem were associated with less aggression. It was notable that leadership efficacy beliefs added significantly to predictions of aggression, above and beyond self-esteem. At the same time, we were surprised that higher levels of community involvement were not related to lower levels of aggression. Perhaps, it is more important to view oneself as an effective leader in one's community as opposed to being merely involved in activities within one's neighborhood. When one views oneself as a leader, it may be easier to feel more invested and actively engaged within the neighborhood, and thereby less aggression is exhibited within this context. Although more research in this area is needed, our preliminary results suggest that building youths’ self-confidence and providing supportive opportunities for demonstrating leadership may be extremely important components of aggression prevention programs for urban minority youth. This is consistent with recent qualitative research in which urban community residents suggested that involving youth in leadership roles within their neighborhoods was a key ingredient in violence prevention programming (Hausman et al., Reference Hausman, Hohl, Hanlon, Becker, Branas and Hayden2009).
We were surprised that relational victimization and distress were not associated with our composite measure of aggression. Past research suggested that these relational variables would likely be predictors of aggression (e.g., Hanish & Guerra, Reference Hanish and Guerra2002; Sullivan et al., Reference Sullivan, Farrell and Kliewer2006). It could be that overt forms of victimization and distress are more salient among urban adolescent minority youth than are relational variables, thereby explaining the pattern of findings in our study. However, given the high correlations between overt and relational victimization, it is possible that when both are placed in the model, the strong associations between overt victimization and overall aggression may mask an association between relational victimization/distress and relational aggression. This appears to be the case in the current study, when only examining the relational variables and a relational aggression composite. Replicating findings suggesting the importance of overt victimization and distress in the predictions of aggression among urban African American youth would be extremely important.
We made several methodological choices in the current study that likely impacted study results. We chose to construct an aggression composite score based upon eight different subscales from various youth- and caregiver-report indices of overt aggression, externalizing behaviors, and relational aggression. We chose to use this composite measure because much prior research has focused solely on overt aggression (e.g., Samson, Ojanen, & Hollo, Reference Samson, Ojanen and Hollo2012). We also considered forming two different aggression composite scores, one for overt aggression and externalizing behaviors and another for relational aggression. However, our initial analyses did not demonstrate notable differences on primary outcomes between these two potential dimensions, leading us to utilize an overall aggression composite score. Nevertheless, it is possible that because six of the eight subscales used in the composite were more consistent with overt aggression and externalizing behaviors than with relational aggression, our composite measure may not have been sensitive enough to identify concerns related to relational aggression. In addition, study results may also have differed if we had used peer- or teacher-reported indices of aggression, which are commonly used in school-based research. However, when working within a high-risk after-school and community-based setting there is typically less access to teachers and peers than when carrying out research in the context of the schools. It was for this reason, in part, that we decided to utilize a multiple-informant, multiple-method composite score of aggression that combined youth and parent reports. Nevertheless, future research would benefit from replicating study results across a wider range of informants.
There were several limitations in our study. First, although we are confident that our sample demographics are similar across cohorts, the lack of caregiver demographic data collected on the first cohort makes it difficult to characterize them with certainty. A second limitation was that we found only marginal internal consistency for our index measuring youths’ beliefs about violence. Although our measure was based on a well-known and respected index (e.g., Bosworth et al., Reference Bosworth, Espelage, DuBay, Daytner and Karageorge2000; Dahlsberg et al., Reference Dahlberg, Toal and Behrens1998; Espelage et al., Reference Espelage, Bosworth and Simon2000, Reference Espelage, Bosworth and Simon2001), our findings emphasizing the importance of beliefs about violence over more traditional social–cognitive measures (e.g., hostile attributional bias and knowledge of SIP steps and anger management) should be interpreted with caution and replicated with another sample. Fourth, our sample consisted of urban, African American or biracial youth (greater than 95% of the sample). Although the nature of our sample should be considered a strength for understanding associations with aggression and violence among urban African American youth, it is unclear whether our results would be applicable for settings outside of urban areas and for non-African American youth.
Overall, study results highlight the complexity of aggression when it occurs within urban, underresourced community settings serving a large number of low-income minority youth. Although we did not have data on the functions of aggression in the current study, this complexity may be further explored through an examination of the functions of aggression in future studies. It could be that peer victimization is more strongly associated with reactive aggression, and beliefs about aggression are more strongly associated with proactive aggression. Future studies of urban youth would benefit from a more nuanced exploration aggression, including an examination of the distinct functions of aggression (i.e., reactive vs. proactive) and associations with both beliefs about aggression and peer victimization. This study also emphasizes that aggression prevention programs serving the needs of high-risk urban youth from these settings need to include intervention components beyond traditional SIP, such as discussions or activities addressing youths’ underlying beliefs that support violence. In addition, results suggest that aggression prevention programs serving youth within these settings should also address prosocial behaviors such as self-esteem and opportunities to promote leadership, while at the same time helping youth learn to better modulate their emotions and feelings of distress in challenging social situations. Our study fills a critical gap in the literature base, by carefully examining a range of factors that may be associated with aggressive behavior for urban adolescent youth and by shedding light on several understudied variables (e.g., leadership efficacy) that have not been traditionally focused upon in the development of aggression prevention programs for youth. As our field continues to progress, it will be important to consider the importance of making cultural adaptations to aggression intervention programs for low-income urban minority youth, especially involving opportunities and support to help build the leadership skills of these at-risk and resilient youth.