Introduction
The presence of polycyclic aromatic hydrocarbons (PAHs) in the marine environment is closely related to anthropogenic sources (Soclo et al. Reference Soclo, Garrigues and Ewald2000). Although at present the Antarctic continent can be considered as one of the least polluted areas in the world, the operation of numerous scientific stations has proved to be responsible for the presence of measurable amounts of PAHs (Aislabie et al. Reference Aislabie, Foght and Saul2000, Ferguson et al. Reference Ferguson, Franzmann, Revill, Snape and Rayner2003). Fisheries and the growing tourist industry have also significantly contributed to the pollution by hydrocarbons. In this respect, the 2007 events involving navigation accidents of tourist ships MS Nordkapp (grounded near Deception Island) and MS Explorer (lost at sea in the Bransfield Strait near King George Island) are clear examples of the risks associated with these activities.
Potter Cove in King George Island, South Shetland Islands, is where the Jubany scientific station has been in operation for more than fifty years. During this period, fossil fuels, mainly diesel, were the main energy source for both electricity generation and vehicles. During spring and summer, there is considerable local traffic of small boats (Zodiac-type boats) using an oil and naphtha blend. In addition, Potter Cove is visited by a significant traffic of large ships involved in station logistics and science, tourist activities or simply vessels searching for shelter during storms. Potter Cove is thus exposed to both chronic and acute events of hydrocarbon spillages and contamination (Vodopivez et al. Reference Vodopivez, Mac Cormack, Villaamil, Curtosi, Pelletier and Smichowski2008). For decades, Jubany Station also undertook open garbage incineration which was a common practice then in most Antarctic stations. Although this procedure was banned in 1998, PAHs produced by burning could have accumulated in the surrounding soils and near-shore sediments. Thus, the PAHs at Jubany Station could have petrogenic and/or pyrogenic origins.
It is known that PAHs have a high affinity for the finest soil particles (Kan et al. Reference Kan, Fu and Tomson1994) as well as for organic matter-rich suspended particles in the water column (Countway et al. Reference Countway, Dickhut and Canuel2003). A previous study of the PAH distribution in surface soils and permafrost layer near Jubany Station showed relatively low levels of PAHs in a number of samples obtained close to facilities (Curtosi et al. Reference Curtosi, Pelletier, Vodopivez and Mac Cormack2007). However, PAH concentrations increased with depth and the highest values were associated with the permafrost table. This increase in concentration has been attributed to the impermeability of the permafrost barrier and to the high content of small particles of this subsurface zone of the Antarctic soil. It was also observed that thawing events and some intense periods of rain drained rapidly through this porous soil with low organic content and could, as a consequence, cause the PAHs to be carried out into the marine environment of Potter Cove.
Based on the previous evidence showing the presence of both petrogenic and pyrogenic sources of PAHs in Jubany Station, the aim of this work was to establish the levels of PAHs in the marine environment of Potter Cove looking at the suspended particulate matter (SPM), surface sediment and three marine organisms with different feeding strategies. Such an approach could contribute to the identification of potential biomonitors and provide invaluable environmental information to underpin major Antarctic management decisions.
Materials and methods
Characterization of the sampling site
Jubany Station (62°14′S, 58°40′W) is one of the main Argentinean Antarctic stations and is located on Potter Peninsula, King George Island, South Shetlands Islands. Potter Cove is a small fjord divided into outer and inner basins separated by a 30 m depth transversal sill. Sediments are composed mainly of fine particles (silt and clay fractions, < 63 μm size) which are more abundant in the inner basin (62–93%) than in the outer one (range 38–70%) (Veit-Köhler Reference Veit-Köhler1998). Organic matter content for the outer part of the cove (4.48%) was smaller than that reported for the inner part, where maximum values of 5.06% and 5.50% were recorded for the south and north coasts, respectively (Mercuri et al. Reference Mercuri, Iken, Ledesma and Dubois1998). Organic carbon and nitrogen contents in sediments from both parts of the cove are comparable to those observed in open coastal conditions with C/N ratios ranging between 5.5 and 7.1 (Veit-Köhler Reference Veit-Köhler1998). Potter Cove and Peninsula represent an Antarctic area exhibiting an exceptional biodiversity. This fact led to the designation of the external coastal strip as an Antarctic Specially Protected Area (ASPA 132).
The organisms to be studied were selected for their different feeding strategies and their relevance in this coastal marine environment. The abundance of phytoplankton in Potter Cove in summer allows the growth of a significant zooplanktonic community which is predated by several fish species among which Notothenia coriiceps (Richardson) is the most predominant (Barrera-Oro et al. Reference Barrera-Oro, Marschoff and Casaux2000). The cove is also characterized by an abundant benthic fauna dominated by the suspension feeder bivalve Laternula elliptica (King & Broderip) (Mercuri et al. Reference Mercuri, Iken, Ledesma and Dubois1998) and the grazer gastropod Nacella concinna (Strebel) (Cadée Reference Cadée1999). For this reason N. coriiceps was selected as representative of the pelagic fauna whereas L. elliptica and N. concinna were considered as the main components of the benthic community with two different feeding strategies.
Sampling methods
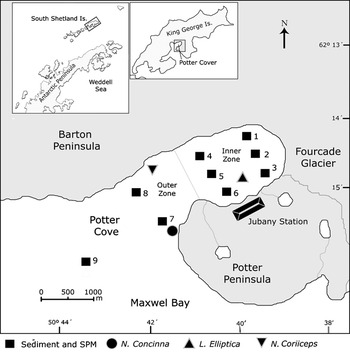
Sampling was performed during the Antarctic summer 2004/05. Figure 1 shows sampling areas for suspended particulate matter (SPM) and sediments as well as the sites for the biological specimens. SPM was obtained from seawater samples taken with Niskin bottles at two different depths: surface, and c. 2 m from the bottom. At each sampling point triplicate, 35 l water samples were obtained and filtered through 14 mm diameter GF/F glass fibre filters (0.7 μm) which were freeze-dried (Finn-Aqua, Lyovac GT2) and stored at -20°C until analysis.
Geographic position of Potter Cove, sampling sites for sediments and suspended particulate matter (SPM) and collecting areas of N. concinna, L. elliptica and N. coriiceps specimens.

Surface sediment samples from nine different sites at Potter Cove were collected with a stainless steel grab. All samples were taken at depths ranging between 20 and 30 m except for sampling site 9 (considered the control site) where the depth was 45 m. All samples were stored in acid-cleaned amber glass flasks until freeze-drying and sieving (1 mm mesh) at Jubany Station. Dry samples were placed in glass vials (20 ml) and stored at -20°C. Freeze-drying had been previously used in analytical studies of PAH adsorption and sequestration and significant biases in the results were not detected (Brion & Pelletier Reference Brion and Pelletier2005). Additional tests on PAHs concentration in tissue samples from different marine organisms previously exposed to these compounds showed no detectable differential loss of the low molecular weight PAHs after freeze-drying (data not shown).
The sampling area (Fig. 1) of L. elliptica was previously reported as having population densities of 300 individuals per m2 (Urban & Mercuri Reference Urban and Mercuri1998). Specimens with a valve longer than 70 mm were collected by scuba divers at a depth of between 5 and 10 m Specimens with a valve longer than 20 mm of N. concinna were collected in the intertidal zone (Fig. 1). For both species ten pooled samples (of five individuals each), were prepared. All specimens were dissected and the digestive gland, gonads and muscles were excised. The organs of the five specimens of each group were pooled, placed in 25 ml glass vials, freeze-dried for 72 h and stored at -20°C. Sampling sites for both mollusc species represented the only areas where these organisms were present in the cove.
Notothenia coriiceps were captured at a depth of 15–20 m in the outer part of Potter Cove using a 30 m long, 1.5 m wide net. Ten specimens (five males and five females) between 30 and 35 cm in length were dissected and tissue samples of liver, gonads and muscles were freeze-dried and stored at -20°C.
Samples processing and analytical methods
Extraction and clean up procedures for surface sediments and SPM samples were carried out as extensively described in a previous study (Curtosi et al. Reference Curtosi, Pelletier, Vodopivez and Mac Cormack2007). PAHs were quantified using gas chromatography-mass spectrometry (Thermo Finigan GC-MS Trace DSQ AS 2000) using a DB-5MS 0.32 mm x 0.25 μm x 30 m column (J&W Scientific), with helium as the carrier gas. The column oven was programmed to operate from 60°C to 310°C at a rate of 15°C min-1 with a final holding time of 13 min. The mass spectrometer was operated in single ion monitoring (SIM) mode in the range of 100 to 450 atomic mass units. Commercially available standard solution (PAH Mix, Supelco 502065) containing a mix of 25 PAHs was used in routine analysis. Working solutions were prepared daily by a serial dilution of the stock solution.
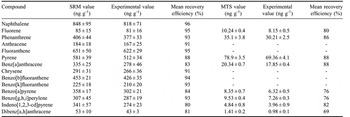
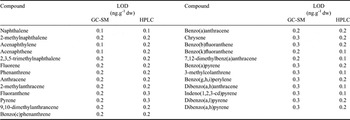
In order to assess the accuracy of the method, certified reference material for PAHs (Marine Sediment SRM 1941b) supplied by the National Institute of Standards and Technology (Gaithersburg, MD, USA), was subjected to the analytical procedure described above. Replicates (n = 3) showed satisfactory results for all the analysed PAHs (more than 80% recovery) and confirmed the adequacy of the extraction protocol (Table I). Limits of detection shown in Table II were calculated on the basis of the 3σ criterion using ten replicate values of blank solution subjected to the same treatment as the samples.
Reference and experimental concentration values of PAH from the Certified Reference Materials for PAHs used in this study. SRM = Marine Sediment SRM 1941b. MTS = Mussel Tissue Standard Reference Material 2977.

Limits of detection (LOD) in ng.g-1 dw for PAH compounds calculated on the basis of the 3σ criterion for GC-MS and HPLC analytical methods applied in this study.
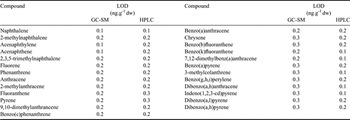
In order to prevent interferences occurring with the lipid content, PAHs contained in biological tissues were analysed by HPLC-fluorescence (Barthe & Pelletier Reference Barthe and Pelletier2007). The equipment consisted of a Rheodyne injector with a 20 μL injection loop, a Shimadzu LC-10AD pump, a Supelcosil LC-PAH column (25 cm x 3 mm), and a Spectra System FL3000 fluorescence detector. Briefly, c. 200 mg of each sample were placed into 50 ml Teflon tubes filled with 10 ml of HPLC grade dichloromethane (DCM) and sonicated using an ultrasonic bath (Branson 5210) for 30 min. Samples were then shaken overnight (Burrell 75 wrist action shaker) and finally sonicated again for an additional 30 min. Solvent was separated from solid material by centrifugation and the supernatant was transferred to a graduated glass conical tube for evaporation. Tubes containing extracts were placed into an ice bath and evaporation was carried out under a nitrogen stream to reach a final volume of 0.5 ml. Hexane (2 ml) was added to extracts and the solvent mix evaporated to a final volume of 1.0 ml. Finally, extracts were cleaned up using a Solid Phase Extraction column Supelclean Envi-18 (Supelco). Elution was made with 5 ml of hexane:DCM (9:1) and the volume was adjusted to 8 ml. A new evaporation step was performed under a nitrogen stream to reach a final volume of about 100 μl. A volume of 40 μl of a solution containing deuterated naphthalene, anthracene and perylene (0.5 μg g-1) used as internal standard was added and the mix diluted to a final volume of 200 μl with hexane:DCM (9:1). Accuracy of the extraction method was assessed using triplicate aliquots of Standard Reference Material 2977 (National Institute of Standards & Technology, USA) consisting of contaminated mussel tissue (Table I). Limits of detection were calculated in the same way as described above for GC-MS analysis (Table II).
Statistical analyses
Comparisons of PAHs concentrations between data pairs were made using student t-test. When more than two datasets were compared, one-way ANOVA and Tukey’s multiple comparison tests were used.
Results
Suspended particulate matter and sediments
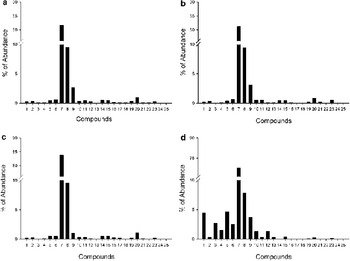
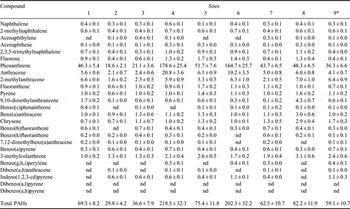
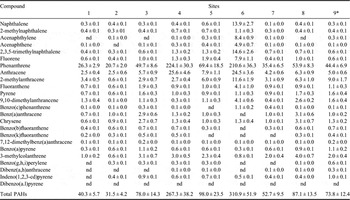
The levels of the 25 analysed PAHs and the sum of all compounds are shown in Tables III and IV, for particles collected near the surface and at 2 m from seabed, respectively. In the surface samples (Table III), SPM showed low levels of total PAHs, from 29.9 to 218.5 ng g-1 dw. Sampling sites 4 and 6 showed significant differences (P < 0.001) compared with all the other sites but with no differences between them. The level of PAHs from sampling site 9 (considered the control site) was significantly different only from sites 4 and 6. Phenanthrene was the dominant compound with levels ranging between 57 and 82% of the total PAHs. Anthracene and its alkyl derivative, 2-methylanthracene were the other relevant compounds, although showing lower levels than phenanthrene. In addition, concentrations of light PAHs (2 and 3 rings) represented 80% or more of total PAHs in all SPM samples from surface waters. In samples obtained near the bottom (Table IV), PAH concentrations were similar to those found at surface level and ranged from 31.5 to 310.9 ng g-1 dw. As in surface samples, only sites 4 and 6 showed statistically higher values (P < 0.001) than the rest of the sites and there were no significant differences between them. The control site was only significantly different from sites 4 and 6. The proportion of 2 or 3 rings PAHs also represented 80% or more of total PAHs and phenanthrene was again the dominant compound (60–84%) followed by anthracene and its alkyl derivative, 2-methylanthracene. An interesting exception was site 6, which showed significantly higher values (P < 0.05) of some other light PAHs such as naphthalene, acenaphthylene, 2,3,5-trimethylnaphthalene and fluorene when compared with any other surface or near-bottom site. The level of these compounds indicated that the incidence of light PAHs in this sampling site near the bottom was as high as 97% of the total PAHs with phenanthrene representing 67%. Figure 2 exemplifies this difference by comparing the pattern of PAHs at surface and 2 m from the bottom for site 6 and for site 4, the latter representing the general pattern found in all other sampling sites.
Pattern of PAHs found in SPM obtaining at surface and 2 m above the bottom for sites 4 and 6. a. Sampling site 4 at surface. b. Sampling site 6 at surface. c. Sampling site 4 at 2 m from the bottom. d. Sampling site 6 at 2 m from the bottom. Compounds: 1. Naphtalene, 2. 2-methylnaphthalene, 3. Acenaphthylene, 4. Acenaphthene, 5. 2,3,5-trimethylnaphthalene, 6. Fluorene, 7. Phenanthrene, 8. Anthracene, 9. 2-methylanthracene, 10. Fluoranthene, 11. Pyrene, 12. 9,10-dimethylanthracene, 13. Benzo(c)phenanthrene, 14. Benz(a)anthracene, 15. Chrysene, 16. Benzo(b)fluoranthene, 17. Benzo(k)fluoranthene, 18. 7,12-dimethylbenz(a)anthracene, 19. Benzo(a)pyrene, 20. 3-methylchloranthrene, 21. Indeno(1,2,3-cd)pyrene, 22. Dibenz(a,h)anthracene, 23. Benzo(g,h,i)perylene, 24. Dibenzo(a,l)pyrene, 25. Dibenzo(a,h)pyrene

Concentration (in ng g-1 dw) of the 25 individual PAHs and total PAHs concentration in samples of suspended particulate matter (SPM) taken at surface from different sites of Potter Cove. See Fig. 1 for location of each site. Values are expressed as mean ± SD of triplicates. The asterisk indicates the reference site.

Concentration (in ng g-1 dw) of the 25 individual PAHs and total PAHs concentration in samples of suspended particulate matter (SPM) taken 2 m from the bottom from different sites of Potter Cove. See Fig. 1 for location of each site. Values are expressed as mean ± SD of triplicates. The asterisk indicates the reference site.
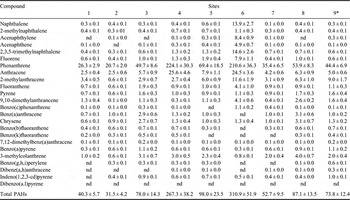
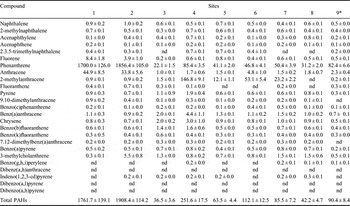
Excluding sampling sites 1 and 2, surface sediment samples showed PAH levels similar to those found in SPM (36.5–251.6 ng g-1 dw) (Table V). In sites 1 and 2 we found PAH concentrations nearly one order of magnitude higher than that of the other sites (P < 0.001) suggesting the presence of a particular sedimentation process. All the rest of the samples (sites 3 to 8) showed no significant differences compared with the control site (site 9).
Concentration (in ng g-1 dw) of the 25 individual PAHs and total PAHs concentration in samples of marine sediments from different sites of Potter Cove. See Fig. 1 for location of each site. Values are expressed as mean ± SD of triplicates. The asterisk indicates the reference site.

Tissues of studied organisms
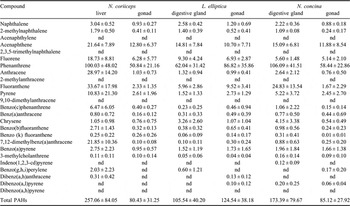
Level of PAHs in N. coriiceps reflected the low PAH concentrations found in their environment (Table VI). However, we observed a significantly higher value (P < 0.05) in liver than in gonads. Some heavy compounds (such as 7,12-dimethylbenz(a)anthracene, benzo(a)pyrene, dibenz(a,h)anthracene, benzo(b)fluoranthene and benzo(c)phenanthrene) were present in liver tissue of N. coriiceps but not in gonads or any other tissue samples. Phenanthrene comprised 44% and 62% of total PAHs in liver and gonads, respectively. Although light PAHs represented 88% of total PAHs in gonads, they accounted for only 70% in liver.
Concentration (in ng g-1 dw) of the 25 individual PAHs and total PAHs concentration in tissue samples from marine organisms collected from different sites of Potter Cove. See Fig. 1 for location of each site. Values are expressed as mean ± SD of triplicates.

The bivalve L. elliptica also showed low levels of total PAHs, but no significant differences were detected between digestive glands and gonads, phenanthrene being the most abundant compound (59% and 70%, respectively). Light PAHs represented 87% (digestive gland) and 86% (gonads) of total PAHs.
In the grazer gastropod N. concinna, significant differences were detected between digestive glands and gonads (P < 0.05). Phenanthrene was also the dominant compound (61% and 69% for digestive gland and gonads, respectively) and light PAHs contributions were 77% and 91% in digestive gland and gonads, respectively.
Muscle tissue from the three species showed no detectable levels of PAHs (results not shown).
Discussion
PAHs in sediment and suspended particulate matter
In general terms, the results obtained from this monitoring study showed that neither the marine basin, nor their associated marine organisms showed PAH levels representing a real risk for the environment or human health (ATSDR 1995, Long et al. Reference Long, Macdonald, Smith and Calder1995). However, data analysis allows for the inference of several relevant environmental features. PAH concentrations from marine sediment obtained in sampling sites 1 and 2 were one order of magnitude higher than those observed in the rest of the sampled area. It was previously observed that these two sites showed an accumulation of fine particles with high affinity for PAHs (Curtosi et al. Reference Curtosi, Pelletier, Vodopivez and Mac Cormack2007). Although factors causing this appear complex and multivariate, accumulation would be related to the size, composition and origin of the particulate matter entering the cove and would be conditioned by the water circulation regime that is determined by the intensity and direction of predominant winds and also by the topography of the cove. The high fraction of fine particles brought into the inner cove by the runoffs during spring and summer (Veit-Köhler Reference Veit-Köhler1998) as well as the higher proportion of organic matter present in surface sediment from this part of Potter Cove (Schloss et al. Reference Schloss, Ferreyra, Mercuri and Kowalke1999) are factors favouring the adsorption of PAHs and could be responsible for the accumulation of PAHs in the inner part of the cove. The deepest zone along the north-east coast of the cove, where sampling sites 1 and 2 are located, seems to act as a large sediment trap capturing contaminated marine sediment and soil particles. In support of this hypothesis, the distribution pattern of PAHs observed in sediment samples agrees with the pattern of PAHs previously observed in coastal soils near Potter Cove (Curtosi et al. Reference Curtosi, Pelletier, Vodopivez and Mac Cormack2007) and also corresponds to a low temperature combustion pattern.
Values of total PAHs in the sediments were similar to those reported for Antarctic sites with low levels of pollution. For example, Cripps (Reference Cripps1992) reported values ranging between 14 and 280 ng g-1 dw for Signy Island and Martins et al. (Reference Martins, Bícego, Taniguchi and Montone2004) found 9–271 ng g-1 dw of PAHs in sediments from Admiralty Bay. The exception was represented by sites 1 and 2 in our work, where values are closer to the range (21–1572 ng g-1 dw) reported by Kennicutt et al. (Reference Kennicutt, Mcdonald, Denoux and Mcdonald1992a) for Arthur Harbour, near Palmer Station or even the 1100–2100 ng g-1 dw of oil-related PAHs more recently reported by Negri et al. (Reference Negri, Burns, Boyle, Brinkman and Webster2006) near the sewage outfall of McMurdo Station. However, our highest values are still one order of magnitude lower than those found in some Antarctic sites severely impacted by human activities, such as a value of 14 491 ng g-1 dw measured in sediments near old Palmer Station by Kennicutt et al. (Reference Kennicutt, Mcdonald, Denoux and Mcdonald1992b) or values as high as 13 000 ng g-1 dw more recently reported by Crockett & White (Reference Crockett and White2003) in the Winter Quarters Bay, near McMurdo Station.
As data about PAHs in SPM for Antarctic marine waters are scarce, a comparison with our results was not possible. A pioneer study reported by Sanchez-Pardo & Rovira (Reference Sanchez-Pardo and Rovira1987) in Bransfield Strait waters mentioned a range of 10–58 ng l-1 of total PAHs whereas Cripps (Reference Cripps1989) reported a very low value of 0.05 ng g-1 in one SPM sample from Cumberland East Bay, South Georgia. Also, in a recent work (Cincinelli et al. Reference Cincinelli, Martellini, Bittoni, Russo, Gambaro and Lepri2008), very low values of total PAHs, 1.53–8.17 ng l-1, were reported for four different sites in the Ross Sea. These values confirmed the pristine character of the open Antarctic waters. However, the expression of results as ng l-1 instead of ng g-1 dry weight of SPM prevents any comparison between these studies because the amount of PAHs, which are mainly associated with suspended particles, varies with the amount of SPM present in the water column.
The levels of total PAHs, as well as the pattern of individual compounds in SPM, are similar to those found in sediment samples. These patterns also agree very well with those found in coastal soils (Curtosi et al. Reference Curtosi, Pelletier, Vodopivez and Mac Cormack2007) supporting the hypothesis that most PAHs are adsorbed mainly onto fine soil particles which are transported from contaminated land sites to the cove by the summer meltwater. However, this feature is not present in site 6 where a different pattern, with a higher predominance of light compounds other than phenanthrene, was found. Site 6 is located close to the area where several boats are moored, reloaded and refuelled. Sediment PAHs are enriched with lighter and more volatile hydrocarbons suggesting a strong contribution of recently spilled fuels used in their outboard engines. These results indicate that stricter regulations should be enforced and safer engines should be employed in order to reduce this environmental impact. Excluding the sample from site 6, all other sampling sites showed a similar pattern suggesting that waters in Potter Cove behave as an homogeneous mass and that pycnocline or other oceanographic factors already described for Potter Cove (Schloss & Ferreyra Reference Schloss and Ferreyra2002) are transient and have little effect on the distribution of the SPM-associated pollutants.
PAHs in living organisms
PAHs concentrations in N. coriiceps tissues exhibited low values in general accordance with the levels present in their environment. Although differences in extraction and quantification methods for PAHs prevent a close comparison with other studies, levels of total PAHs in Antarctic fish (including N. rossii) from non polluted environments reported by a number of authors and reviewed by Cripps & Priddle (Reference Cripps and Priddle1991) are of the same order of magnitude as those found in this work.
Although no recent data about PAHs in Antarctic fish tissues are available, studies performed with fish from other regions of the world could be compared with our results. Among these studies, Deb et al. (Reference Deb, Araki and Fukushima2000) analysed PAHs in 11 different fish species from Hiroshima Bay, a site much more affected by human activity than the Antarctic areas, and reported levels of some individual PAHs in several organs (as gonads and brain) largely exceeding 1000 ng g-1 dw, whereas in our study fish organs never exceeded 200 ng g-1 dw of total PAHs. Although both studies agreed on the dominance of low molecular weight PAHs, indicating a significant contribution of petrogenic pollution (Douabul et al. Reference Douabul, Heba and Fareed1997), Deb et al. (Reference Deb, Araki and Fukushima2000) found that levels in gonads were higher than in liver, in contrast with our own results which showed that levels in fish liver were significantly higher than in gonads. As it is broadly accepted that vertebrates can efficiently metabolize the majority of absorbed PAHs by their P450 enzymatic systems which are less efficient in invertebrates (Jonsson et al. Reference Jonsson, Bechmann, Bamber and Baussant2004), high PAHs levels in fish liver were unexpected and could represent a short term bioaccumulation of light PAHs in lipid rich liver before being degraded and excreted as phase I or phase II metabolites. It might be behaviour specific to this fish species under cold water conditions and exposed to a continuous source of hydrocarbons. The presence in fish liver of significant levels of the alkylderivative 7,12-dimethylbenz(a)anthracene, a compound that was found almost in trace levels in all other analysed tissues, represents a remarkable finding and could be reflecting the metabolic activity present in fish liver (Shappell et al. Reference Shappell, Carlino-Macdonald, Amin, Kumar and Sikka2003). Although the mean concentration of this compound was low (21.85 ng g-1 dw), it has been reported that alkylated PAHs often have greater adverse effects on biota than parent PAH without alkyl substitutions (Hellou et al. Reference Hellou, Mackay and Fowler1995), and 7,12-dimethylbenz(a)anthracene in particular has been reported as being carcinogenic for fish (Schultz & Schultz Reference Schultz and Schultz1982). Although levels inducing cellular damages seem to be one order of magnitude higher than those found in liver of N. coriiceps, this compound and others should be monitored and their relationship with liver alterations studied, with particular emphasis on certain lesions, including neoplasms, reported in liver of a number of non-Antarctic fish (Varanasi & Stein Reference Varanasi and Stein1991).
Despite L. elliptica samples being obtained close to areas of intensive boating activities, and hence more exposed to fuel hydrocarbon pollution, and N. concinna specimens taken from an open area more distant from station related activities, total PAH levels in samples from these two mollusc species did not reflect differences related to their sampling sites. This lack of a distinctive pattern in PAH content could be related to intertidal habitat which is exposed to direct effects of floating fuel residues in the surface layer at low tide where limpets can be directly in contact with oily residues. The clockwise surface current present in the cove (Roese & Drabble Reference Roese and Drabble1998) tends to transport floating fuel residues from the station to the limpet sampling sites.
In contrast to the distribution observed in N. coriiceps, total PAHs values in gonads and digestive glands from the two molluscs showed no significant differences. PAH levels found in these invertebrates correspond to a contamination level ranging from low to moderate pollution level using a global classification of contamination sites (Baumard et al. Reference Baumard, Budzinski and Garrigues1998). For the Antarctic area, Cripps & Priddle (Reference Cripps and Priddle1995) reported PAHs levels in the bivalve Yoldia eightsi ranged from 5 to 25 ng g-1. These values were expressed as fresh weight and, if corrected for water content (∼80%), it would be in the same range as our data. Kennicutt et al. (Reference Kennicutt, Mcdonald, Denoux and Mcdonald1992b) also evaluated the concentration of PAHs for the Antarctic limpet N. concinna and found values between 15 and 397 ng g-1 dw. Interestingly, these authors reported one sample having total PAHs of 2932 ng g-1 dw that corresponded to the site of the boat operation and refuelling activities.
Bioconcentration factors (BCF calculated as the ratio of concentration in tissue/concentration in sediment both expressed in dry weight) observed for L. elliptica (1.11 in gonads and 0.94 in digestive gland) clearly indicated that PAHs are not bioconcentrated in the our specimens in contrast with some heavy metals (Negri et al. Reference Negri, Burns, Boyle, Brinkman and Webster2006, Grotti et al. Reference Grotti, Soggia, Lagomarsino, Dalla Riva, Goessler and Francesconi2008). These preliminary results suggest that this bivalve would not be an adequate sentinel species for PAH contamination in Antarctic marine environment. However, additional comparative studies where levels of PAHs in L. elliptica specimens, sediments and SPM samples from the same site were to be correlated and compared with several other sites in the cove, should be carried out in order to confirm this assertion.
Finally, it is important to highlight the dominance of phenanthrene in all samples (SPM, sediments and biota), a fact that has been observed in our previous study for Jubany Station soils (Curtosi et al. Reference Curtosi, Pelletier, Vodopivez and Mac Cormack2007). A number of other studies performed in Antarctica also reported high levels of phenanthrene. For instance, Cripps (Reference Cripps1989) found a contribution of 80% of phenanthrene to total PAHs in a sediment sample from a site where heavy tar leaked directly into the coastal waters of Stromness Bay from a whaling station established a century ago. Also Clarke & Law (Reference Clarke and Law1981) reported that concentrations of phenanthrene and anthracene were almost one order of magnitude higher than other PAHs found in an Antarctic starfish. In Kennicutt et al. (Reference Kennicutt, Mcdonald, Denoux and Mcdonald1992a), phenanthrene was also the dominant compound (47–97%) and the 2-3 rings PAHs represented between 72 and 99% of total PAHs. However, no clear explanation for this high proportion of phenanthrene has been proposed. The dominance of phenanthrene seems to be real and cannot be attributed, for example, to an analytical artefact or bias such as preferential extraction efficiency. Our results using certified reference materials showed that the extraction efficiency for phenanthrene was not different from the ones obtained for other PAHs of similar molecular weight and structure. In addition, Filipkowska et al. (Reference Filipkowska, Lubecki and Kowalewska2005) proved that neither in marine sediments, nor in mussel homogenates phenanthrene showed an extraction efficiency higher than the other 12 PAHs. In their study on adsorption and sequestration rates of PAHs, Brion & Pelletier (Reference Brion and Pelletier2005) observed that light unalkylated PAHs, and mainly phenanthrene, presented the higher adsorption and sequestration rates even if their Kow were relatively lower than heavier 4- and 5-ring compounds. If phenanthrene is rapidly sequestrated by SPM, its bioavailability for bacterial biodegradation is reduced but its bioaccessibility to bioaccumulation in biological tissues might be maintained.
In conclusion, our results showed that neither SPM, nor surface sediment and biota from Potter Cove exhibit PAH levels that could represent an environmental concern, despite the presence of Jubany Station that has been in operation for more than 50 years. Distribution of individual compounds suggest petrogenic and low temperature combustion origins for these compounds, a situation compatible with historical and present human activities in this area. We believe that improved management of fuel and a reduction of terrestrial contamination sources would lead to a rapid decrease of PAH levels in the substrates and organisms of Potter Cove.
Acknowledgements
We thank Jubany Station crew and especially Oscar Gonzalez, Julio Naboni and Denis Brion for the logistical support during field samplings. This work was carried out under an agreement between the Instituto Antártico Argentino and the Facultad de Farmacia y Bioquímica of the Universidad de Buenos Aires. Field and laboratory works were supported by the Universidad de Buenos Aires (UBACyT U007), the Agencia Nacional de Investigaciones Científicas y Técnicas (Picto 11555), the Canadian Research Chair in Ecotoxicology of High Latitude Ecosystems and the Québec-Ocean Strategic Network (FQRNT). Many thanks go to personnel of the Institut des Sciences de la Mer à Rimouski (ISMER/UQAR) for technical and professional assistance in chemical analysis and to Cecilia Ferreiro for assistance in the correction of the English. We thank the three referees for their rigorous reviews.