Implications
Shearing in late summer imposed a significant thermoregulatory stress on our Angora goats, which may help to explain their summer vulnerability to cold weather; in March 2007 an estimated 20 000 Angora goats died in the Eastern Cape of South Africa during a cold, wet spell. We propose that if fleeced animals are not acclimatized to cold, they may actually become more susceptible to cold stress after shearing. Such findings have animal welfare and management implications; investigating the appropriate times of year for shearing would improve husbandry and help to minimize goat mortalities from hypothermia, ultimately improving profitability of the mohair industry.
Introduction
Inclement weather results in the death of hundreds of thousands of sheep annually (Hutchinson and Bennett, Reference Hutchinson and Bennett1962; Hutchinson, Reference Hutchinson1968), particularly if a cold spell occurs after shearing (Glass and Jacob, Reference Glass and Jacob1992). In an attempt to reduce such high mortalities, the annual shearing of sheep usually is timed to coincide with favorable climatic conditions (Dýrmundsson, Reference Dýrmundsson1991). Unlike Merino sheep, Angora goats usually are shorn twice a year, at approximately 6-month intervals. Although increasing the frequency of shearing Angora goats has advantages for fleece production and quality (McGregor and Butler, Reference McGregor and Butler2008a), it increases the risk of hypothermia as goats are more likely to be exposed to inclement weather at a time when their fleece insulation is reduced. Although it is recognized that high mortality among Angora goats during periodic cold spells is a serious problem in the mohair industry (Wentzel et al., Reference Wentzel, Viljoen and Botha1979), little is known about the thermoregulatory consequences of shearing these animals.
Angora goats may be more vulnerable than other livestock species to cold as a result of their smaller body mass, thinner subcutaneous fat deposits (Shelton, Reference Shelton1993; McGregor, Reference McGregor2001), larger surface area for cooling, and labile rectal temperatures (Hofmeyr et al., Reference Hofmeyr, Joubert, Badenhorst and van De Steyn1965; Johnson, Reference Johnson1971; McGregor, Reference McGregor1985). Compared to Merino sheep, the fleece of Angora goats is more lustrous (Cena and Monteith, Reference Cena and Monteith1975), has a lower grease content, a lower fiber density per unit area of skin and a lower thermal insulation, thus allowing greater penetration of air and wetting of the skin (McGregor, Reference McGregor1985 and Reference McGregor2001). Such differences may explain why sheep remain susceptible to death for 2 weeks following shearing (Panaretto, Reference Panaretto1967; Hutchinson, Reference Hutchinson1968; Donnelly et al., Reference Donnelly, Lynch and Webster1974), compared to nearly 6 weeks for Angora goats. Indeed, when exposed to the same environmental conditions, the risk of hypothermia and mortality following shearing was higher for Angora goats than for Merino sheep (McGregor and Butler, Reference McGregor and Butler2008b). However, the known characteristics of the thermoregulatory system of Angora goats do not explain the catastrophic mortalities that occur if unseasonal cold spells occur in the summer, since those summer cold spells are milder than normal winter cold. We therefore measured the effect of September and March shearing on the body temperature and activity of free-living Angora goats in the Eastern Cape, South Africa.
Material and methods
Animals and habitat
Ten neutered male Angora goats (Capra aegagrus) (body mass 39.2 ± 3.5 kg) from Blaauwkrantz farm (33°32′S 25°23′E, at an altitude of 75 m above sea level), near Port Elizabeth in the Eastern Cape Province, South Africa, were used. They remained on the farm for the duration of the study. In July 2005 the goats underwent surgery (detailed below) before being released into a 50 ha rectangular paddock consisting of natural vegetation on undulating terrain. The vegetation in the area has been classified as Sundays Spekboomveld (Vlok et al., Reference Vlok, Euston-Brown and Cowling2003). This dense, semi-succulent, thorny vegetation consists primarily of perennial shrubs and trees, and is largely dominated by the tree-succulent, Portulacaria afra. Except for the naturally occurring trees and shrubs, no specific shelter was provided for the goats. Goats grazed on the natural vegetation and had access to fresh water ad libitum, supplied via a single drinking trough located in an open area near the perimeter of the camp. Experimental procedures were approved by the Animal Ethics Screening Committee of the University of the Witwatersrand (protocol no. 2005/45/4).
Surgery
Anesthesia was induced in the goats by i.m. injection of 2.5 mg/kg ketamine hydrochloride (Anaket-V; Bayer Animal Health (Pty) Ltd, Isando, South Africa) and 0.04 mg/kg medetomidine hydrochloride (Domitor; Novartis South Africa (Pty) Ltd, Kempton Park, South Africa). Anesthesia was maintained with 1–4% halothane (Fluothane; Astra Zeneca, Johannesburg, South Africa) administered in 100% oxygen via a facemask. After ∼10 min of halothane administration, the action of medetomidine was reversed with 0.2 mg/kg i.m. atipamezole hydrochloride (Antisedan; Novartis South Africa (Pty) Ltd). Respiratory rate, heart rate, percentage hemoglobin oxygen saturation (8500 Digital Handheld Pulse Oximeter; Nonin Medical Inc., Plymouth, MN, USA) and rectal temperature (laboratory digital thermometer, Physitemp, Model BAT-12; Sensortek Inc., Clifton, NJ, USA) were monitored throughout the surgical procedure, which lasted ∼20 min.
Under sterile surgical conditions, a suite of miniature data loggers was implanted. All data loggers were covered in an inert wax (Sasol wax EXP986; Sasol Chemical Industries Ltd, Johannesburg, South Africa) and dry-sterilized in formaldehyde vapor before implantation. Incision sites were shaved and sterilized with chlorhexidine gluconate (Hibitane; Astra Zeneca). In all 10 goats, a 70 mm cranial-caudal incision was made through the skin and linea alba, within the midline area on the ventral abdominal surface, and a miniature temperature-sensitive data logger (see temperature measurements) was placed into the abdominal cavity, where it was free to migrate within the cavity. A single goat in the herd also received an intra-abdominal tracking transmitter (African Wildlife Tracking, Pretoria, South Africa). The skin and muscle layers then were sutured closed. In five of the 10 goats, an additional incision was made on the caudal aspect of the upper hind leg, after additional administration of a local anesthetic (0.04 g lignocaine hydrochloride, s.c.; Bayer Animal Health Pty), and a smaller temperature-sensitive data logger (see temperature measurements) was implanted subcutaneously. At the same subcutaneous site, these five goats also had an activity logger (Actical; Mini-Mitter Corporation, Bend, OR, USA) implanted.
All surgical wounds were treated with a topical antiseptic spray (Necrospray; Centaur Labs, Johannesburg, South Africa) and coated with a topical tick-repellent grease (cypermethrin 0.025% m/m; Bayer Animal Health Pty). Each goat received a long-acting antibiotic (500 mg i.m. penicillin; Peni LA Phenix, Virbac Animal Health, Centurion, South Africa), an analgesic and anti-inflammatory medication (420 mg i.m. ramiphenazone, Dexa-Tomanol; Centaur Labs), as well as a long-acting parasiticide (5 mg s.c., doramectin, Dectomax; Pfizer Laboratories (Pty) Ltd, Sandton, South Africa).
Before halothane administration was terminated, animals were marked with colored plastic ear tags, which enabled us to identify individual animals, and neck collars were fitted to five goats. The neck collars were 50 mm wide and were individually cut for each goat depending on its neck diameter. Each collar supported a miniature black globe thermometer (‘miniglobe’), which allowed for the dynamic measurement of the microclimate that the goat chose to occupy. This technique has proven successful on other ungulate species (Hetem et al., Reference Hetem, Maloney, Fuller, Meyer and Mitchell2007). Miniglobe temperature was measured by a small temperature-sensitive data logger (see temperature measurements) inserted into the center of a matt-black hollow brass sphere (30-mm diameter; Press Spinning & Stamping Co., Cape Town, South Africa). The globe was attached to a 10-mm diameter, polyvinyl chloride rod, which in turn was attached to the outer surface of the collar.
After recovery from surgery, the goats were released into their paddock where they roamed freely for a 1-year period. Goats behaved similarly and remained as a herd. Following standard management practices of the farm, goats were shorn in mid-September 2005 and again, 6 months later, in early March 2006, the end of austral winter and summer, respectively.
In August 2006, the goats once again were anesthetized and the data loggers were removed using surgical procedures similar to that used for the original implantation. The data loggers showed no obvious defects, the animals’ wounds had healed and there were no signs of infection from the initial surgery. However, four of the miniglobe thermometers had broken off the collars and three of the activity sensors were broken. After surgery the goats were returned to Blaauwkrantz farm.
Temperature and relative activity measurements
The miniature data loggers (StowAway XTI; Onset Computer Corporation, Pocasset, MA, USA), used to measure abdominal temperature, had outside dimensions of ∼50 × 45 × 20 mm3 and a mass of ∼40 g when covered in wax. The data loggers had a storage capacity of 32 kb and measured temperatures within the range of +34 to +46°C, at a resolution of 0.04°C. The loggers measuring abdominal temperature recorded at 20-min intervals. The subcutaneous and miniglobe temperatures were recorded every hour with a smaller thermometric data logger (i-Button DS1922T, Maxim; Dallas Semiconductor, Dallas, TX, USA), which had a diameter of ∼25 mm, a height of 15 mm and weighed ∼10 g when covered in wax. These loggers had a resolution of 0.5°C and a measurement range from 0 to 125°C. All the loggers were calibrated individually, in an insulated water bath, against a high-accuracy thermometer (Quat 100; Heraeus, Hanau, Germany).
The activity loggers recorded gross body movement at 10-min intervals, had dimensions of ∼40 × 40 × 15 mm3 and weighed ∼40 g when covered in wax. Activity counts were converted to relative activity units by calculating activity counts as a percentage of maximum counts for each logger.
Meteorological data measurements
We collected climatic data by erecting a portable weather station (Hobo Weather Station; Onset Computer Corporation) at the field site, in an open area that was not shaded or protected by vegetation. We recorded wind speed (m/s), solar radiation (W/m2), as well as standard (150-mm diameter) and miniature (30-mm diameter) black globe temperature (°C) at hourly intervals.
Water influx and turnover rate
Many thicket plant species retain their forage potential throughout the year (Stuart-Hill and Aucamp, Reference Stuart-Hill and Aucamp1993). Indeed, despite high rainfall in November, the relative forage availability was similar throughout the year of our study. The vegetation on the field site was dominated by succulents (November 46%; July 36%), woody shrubs (November 29.5%; July 31.5%) and grasses (November 23.8%; July 30.3%) and goats utilized forage in proportion to availability in both seasons (Milne, Reference Milne2008). We assessed water influx and water turnover rates, by dilution of the stable isotope deuterium oxide, for 9 days before and 9 days after shearing in March. Before the isotope was administered, animals were weighed and 10 ml blood samples were taken to determine background enrichment of deuterium oxide. Animals then received an i.m. dose of 0.04 ml/kg deuterium oxide (D2O, 99.8 at%; Merck & Co. Ltd, Rahway, NJ, USA). A second 10 ml blood sample was taken 4 h after injection, once the administered deuterium oxide had equilibrated with body water. The goats’ drinking water source was removed on the day after these blood samples were taken. Goats were yarded, weighed and 10 ml blood samples were taken 3, 5, 7 and 9 days later. Water was returned after the blood samples had been taken on the 7th day. The blood samples were collected from the jugular vein with Vacutainers (BD Diagnostics-Preanalytical Systems, Plymouth, UK), then placed in ice and centrifuged (Wifug Ltd, Bradford, England) at 6000 × g for 10 min. Serum was separated and stored in 2 ml vials (cryogenic vials 430489; Corning Inc., New York, NY, USA) and frozen at −20°C for later analysis. Serum total protein, osmolality and glucose concentrations were analyzed by the Department of Companion Animal Clinical Studies section of Clinical Pathology, University of Pretoria, Pretoria, South Africa.
Deuterium concentration of the serum was measured on a high-temperature elemental analyzer (Flinnigan Elemental Analyser; Thermo Electron Corporation, Bremen, Germany), normalized against an international reference, namely Vienna-Standard Mean Ocean Water (V-SMOW). A multi-point method was used (Fusch, Reference Fusch2000) and a regression line fitted to the log-transformed data to establish rate constants for deuterium dilution. The y-intercept of the curve at time zero was used to estimate isotope distribution space. The total body water was derived from the known dose of injected deuterium oxide divided by the difference between isotope dilution space and the background enrichment of deuterium oxide. Water influx was determined from the average rate of deuterium oxide dilution over the 7-day period, when goats did not have access to water, multiplied by the total body water and corrected for body mass. Water turnover was determined as the sum of water influx and total weight loss, as all weight loss was assumed to be water loss.
Data analysis
We averaged temperature data for 10 days before shearing and separately for 10 days after shearing, hereafter referred to as ‘pre-shearing’ and ‘post-shearing’, respectively, for each individual within the September and March shearing periods. We used a two-way repeated measures analysis of co-variance (ANCOVA), with live body mass of the shorn goat as a co-variant, to test for differences in the temperature profiles of the goats between the pre-shearing and post-shearing periods and across the two seasons. We also tested for differences in the time of minimum and maximum body temperature, as well as differences in the maximum rate of body temperature rise, of the pre-shearing and post-shearing periods. To test for seasonal differences in the difference between abdominal and subcutaneous temperature, we calculated the average temperature difference for all readings between 2100 and 0600 h for each goat within the September and March shearing periods and performed a two-way repeated measures ANCOVA, with live body mass of the shorn goat as a co-variant. We used a two-way repeated measures ANOVA to test for differences in blood variables between the pre- and post-shearing periods across the 9-day period of dehydration and rehydration in March. We used a two-way ANOVA to test for differences in weather conditions between pre-shearing and post-shearing periods across seasons. Newman–Keuls multiple comparisons tests were used to identify sources of significant differences in ANOVAs. We used paired Student’s t-tests to investigate differences in water influx and water turnover rates of the goats pre- and post-shearing, during March.
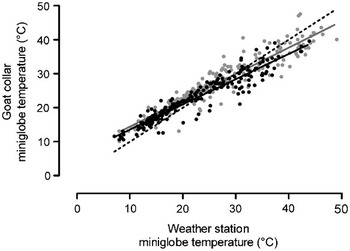
To assess whether the animals were selecting microclimates different from those at the exposed weather station, we tested whether the slope of a linear regression line, fitted to the correlation of miniglobe on the index goat to weather station miniglobe temperature, was significantly different from one (the slope of the line of identity). In addition, we tested whether the slope and elevation of the regression line were significantly different between pre- and post-shearing periods using an ANCOVA. Data are expressed as mean ± s.d. and P < 0.05 was considered to be statistically significant.
Results
Climate
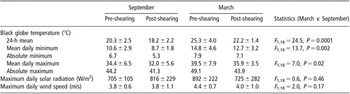
Black globe temperature peaked just after solar noon and reached a minimum just before sunrise. Solar radiation showed the expected bell-shaped distribution, and wind speed increased in the late afternoon. The September conditions were mild for the region, and March temperatures were ∼5°C warmer than during September (Table 1). Environmental conditions compared between the pre- and post-shearing periods were not significantly different, in either season (P > 0.05, Table 1).
Environmental conditions (mean ± s.d.) for the 10-day periods pre- and post-shearing, in both September and March (there was no difference between pre- and post-shearing periods within each season; however, March was ∼5°C warmer than September)

Abdominal temperature
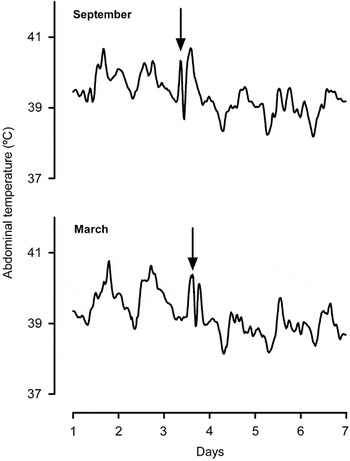
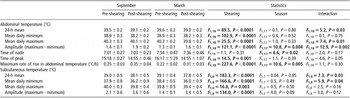
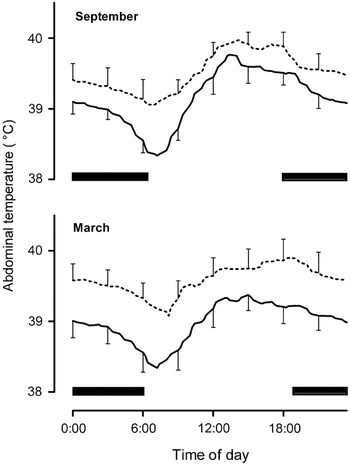
Figure 1 shows, for a single goat, the decrease in abdominal temperature after shearing in both September and March. Abdominal temperatures remained lower than pre-shearing temperatures for weeks, even up to 3 months, after shearing, only gradually returning to pre-shearing values. Mean daily abdominal temperature decreased significantly from pre- to post-shearing in both seasons (Table 2 and Figure 2). The significant interaction between shearing and season revealed that 24-h mean abdominal temperature decreased significantly more after shearing in March (∼0.6 ± 0.3°C) than in September (∼0.4 ± 0.2°C, Table 2). Mean daily maximum abdominal temperature decreased from pre- to post-shearing in both seasons (Table 2). The interaction between shearing and season was significant, revealing that the decrease in mean daily maximum abdominal temperature post-shearing was greater in March than in September (Table 2). Mean daily minimum abdominal temperature decreased from pre- to post-shearing in both seasons (Table 2), with the decrease being similar in March and September.
Nychthemeral rhythm of abdominal temperature of a representative Angora goat over a 6-day period around the time of shearing in both September (upper panel) and March (lower panel). The arrow represents time of shearing.

Abdominal (n = 10) and subcutaneous (n = 5) temperature characteristics (mean ± s.d.) of Angora goats for the 10-day periods pre- and post-shearing, in both September and March (two-way repeated measures analyses of co-variance (ANCOVAs), with live body mass of shorn goats as a co-variant, were used to test for differences in the temperature profiles of the goats between the pre- and post-shearing periods (shearing) and across the 2 months (season))

Bold values indicate significance at P < 0.05.
Nychthemeral rhythm of abdominal temperature (mean ± s.d.) for 10 free-living Angora goats over 10 days pre-shearing (dotted line) and 10 days post-shearing (solid line), during September (upper panel) and March (lower panel). Solar noon occurred between 1200 and 1300 h during both periods and black bars represent the night period.

A significant seasonal effect showed that the daily amplitude of the abdominal temperature rhythm was higher in September than in March. After shearing, mean daily minimum abdominal temperature decreased more than did mean daily maximum, which resulted in a significant increase in the mean daily amplitude of abdominal temperature rhythm post-shearing, compared to pre-shearing (Table 2). A significant interaction between shearing and season showed that the increase in mean daily amplitude of abdominal temperature rhythm post-shearing was greater in September (∼0.6 ± 0.2°C) than it was in March (∼0.3 ± 0.1°C). This higher amplitude after the September shearing was accompanied by a faster rate of rise in abdominal temperature both during September compared to March and post-shearing compared to pre-shearing. Consistent with this faster rate of abdominal temperature rise, the peak of abdominal temperature was reached approximately 1 h earlier during the post-shearing period than during the pre-shearing period, in both seasons (Table 2 and Figure 2). However, the time of nadir of abdominal temperature was the same before and after shearing, in both seasons (Table 2).
Subcutaneous temperature
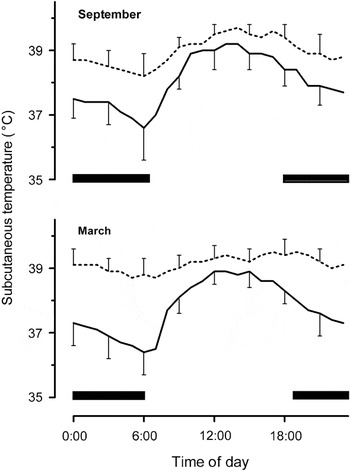
Subcutaneous temperatures decreased significantly post-shearing compared to pre-shearing in both seasons (Figure 3). There was an interaction between shearing and season with 24-h mean subcutaneous temperature decreasing more after the March shearing (∼1.4 ± 0.1°C) than after the September shearing (∼0.9 ± 0.4°C; Table 2). Mean daily maximum and minimum subcutaneous temperatures decreased from pre- to post-shearing in both seasons (Table 2). The significant interaction between shearing and season revealed a greater decrease in mean daily minimum subcutaneous temperature after the March shearing (Figure 3, lower panel) than after the September shearing (Figure 3, upper panel). The disproportionate decrease in mean daily minimum and mean daily maximum subcutaneous temperatures resulted in a significant increase in the mean daily amplitude of subcutaneous temperature from pre- to post-shearing in both seasons (Table 2).
Nychthemeral rhythm of subcutaneous temperature (mean ± s.d.) for five free-living Angora goats over 10 days pre-shearing (dotted line) and 10 days post-shearing (solid line), during September (upper panel) and March (lower panel). Solar noon occurred between 1200 and 1300 h during both periods and black bars represent the night period.

The greater decrease in subcutaneous temperatures than abdominal temperature, from pre- to post-shearing, resulted in a greater 24-h mean difference between abdominal and subcutaneous temperature post-shearing (F 1,8 = 99.2, P < 0.0001). It increased from 0.6 ± 0.4°C pre-shearing to 1.2 ± 0.4°C post-shearing, in both seasons (Figure 4). This higher 24-h mean difference was likely the result of an increase in the maximum daily difference between abdominal and subcutaneous temperature post-shearing (F 1,8 = 80.9, P < 0.0001), namely from 1.1 ± 0.6°C pre-shearing to 2.5 ± 0.8°C post-shearing, in both seasons. Since the mean daily minimum difference between abdominal and subcutaneous temperature did not change from pre- to post-shearing (F 1,8 = 1.0, P = 0.35), there was an increase in the mean daily amplitude of abdominal–subcutaneous temperature difference post-shearing (F 1,8 = 14.0, P = 0.006), from 1.1 ± 0.6°C pre-shearing to 2.5 ± 0.8°C post-shearing, in both seasons. The difference between abdominal and subcutaneous temperature between 2100 and 0600 h increased from pre- to post-shearing in both seasons (F 1,8 = 100.2, P < 0.0001). The significant interaction between shearing and season (F 1,8 = 5.6, P = 0.04) revealed that the nighttime (2100–0600 h) difference between abdominal and subcutaneous temperature increased significantly more after shearing in March (∼1.2 ± 0.4°C) than in September (∼0.8 ± 0.3°C).
Nychthemeral rhythm of the difference (mean ± s.d.) between abdominal and subcutaneous temperature for five free-living Angora goats over 10 days pre-shearing (dotted line) and 10 days post-shearing (solid line), during September (upper panel) and March (lower panel). Solar noon occurred between 1200 and 1300 h during both periods and black bars represent the night period.

Relative activity
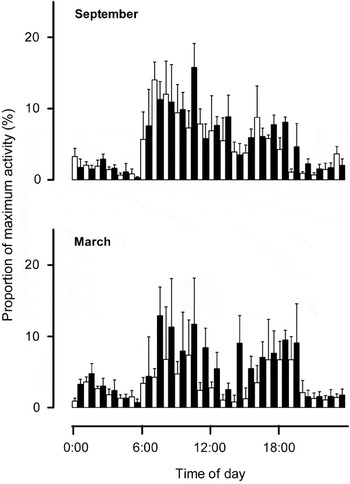
Figure 5 shows, for a single Angora goat, the average 24-h activity pattern, as detected by movement of the upper hind limb. The two goats for which we obtained activity data displayed an activity pattern with crepuscular peaks, and activity between those peaks was suppressed more in March than in September. Although there was little difference between the mean 24-h activity pre-shearing (4.7 ± 3.7 relative activity units) and post-shearing (5.4 ± 4.0 relative activity units) in September, the mean 24-h activity nearly doubled after shearing in March, from 3.2 ± 2.2 relative activity units pre-shearing to 5.6 ± 3.7 relative activity units post-shearing.
Nychthemeral rhythm of activity (mean ± s.d.) for an index Angora goat over 10 days pre-shearing (white bars) and 10 days post-shearing (black bars), during September (upper panel) and March (lower panel). Activity was measured on the upper hind limb with a subcutaneous data logger, and expressed as activity counts as a percentage of maximum counts for that logger.

Water influx and turnover rate
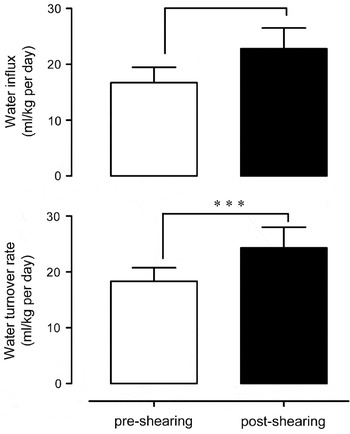
In March, water influx increased significantly (t 10 = 4.7, P = 0.0008) post-shearing, compared to pre-shearing (Figure 6, upper panel). Water turnover rate also increased significantly (t 10 = 5.1, P = 0.0005) post-shearing compared to pre-shearing (Figure 6, lower panel).
Mean ± s.d. of water influx (upper panel) and water turnover rate (lower panel) of 10 Angora goats over a 7-day period pre-shearing (white bars) and a 7-day period post-shearing (black bars), during March. The goats were denied access to drinking water. ***Indicates P < 0.001.

Blood variables
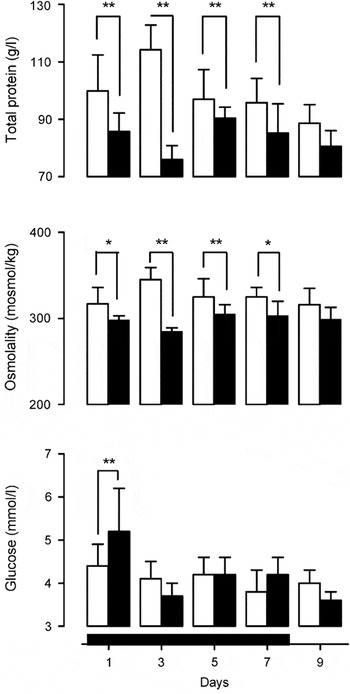
Because the goats were denied access to drinking water for 7 days both pre- and post-shearing in March, their hydration state changed over time, as reflected by changes in serum protein with time (Figure 7, upper panel, F 4,40 = 5.2, P = 0.002). The goats were less dehydrated post-shearing than pre-shearing, as evident in total serum protein (Figure 7 upper panel, F 1,10 = 40.2, P < 0.0001) and osmolality (Figure 7, middle panel, F 1,9 = 33.6, P = 0.0002), which were higher pre-shearing than they were post-shearing. On the other hand, serum glucose concentration was significantly higher on the first day without drinking water post-shearing (Figure 7, lower panel, F 4,36 = 8.7, P < 0.0001), than it was on the first day without drinking water, pre-shearing. There was a significant interaction in the change in glucose concentration between the number of days without water and shearing (F 4,36 = 3.9, P = 0.009).
Mean ± s.d. of total serum protein (upper panel), osmolality (middle panel) and glucose (lower panel) for 10 Angora goats, both pre-shearing (white bars) and post-shearing (black bars) in March. Blood samples were taken every second day for 9 days. The goats were denied access to drinking water, but not food, for 7 days as represented by the black bar at the base.

Microclimate selection
Figure 8 shows the correlation between miniglobe temperature at the site chosen by a single index goat and miniglobe temperature recorded at a nearby weather station exposed to solar radiation, both pre-shearing (r 2 = 0.90, P < 0.0001) and post-shearing (r 2 = 0.90, P < 0.0001) in March. The slope of the regression lines were significantly less than one, both pre-shearing (F 1,716 = 357.6, P < 0.0001) and post-shearing (F 1,685 = 532.0, P < 0.0001), and the regression lines intersected the line of identity, implying that the goat selected microclimates cooler than the prevailing environmental conditions at higher environmental heat loads and microclimates warmer than the prevailing environmental conditions at lower environmental heat loads. The slope of the regression line was significantly reduced (F 1,476 = 4.85, P = 0.03) post-shearing (0.72 ± 0.02), compared with the pre-shearing period (0.77 ± 0.02).
Scatter diagram showing the relationship between miniglobe temperatures at the site chosen by a single index Angora goat and miniglobe temperatures recorded at a nearby weather station exposed to solar radiation, during a 10-day pre-shearing (gray) and post-shearing (black) period in March. Measurements were made at hourly intervals. The dashed line is the line of identity, the solid gray line is the linear regression during the pre-shearing period and the solid black line is the linear regression during the post-shearing period.

Discussion
We have shown that the thermoregulation of free-living Angora goats is compromised after both September and March shearing. After shearing, mean daily abdominal temperature, daily maximum and daily minimum temperature decreased significantly in both seasons (Figures 1 and 2). Subcutaneous temperatures also decreased after shearing (Figure 3). Such a decrease in subcutaneous temperature is likely to be the result of both a reduced insulation of the fleece and a change in peripheral blood flow, as reflected in the difference between abdominal and subcutaneous temperature. Under the fleece the goats were consistently vasodilated (Figure 4). After shearing the goats remained vasodilated (dissipating heat) during the day, as indicated by small differences between core and subcutaneous temperatures. But the difference between abdominal and subcutaneous temperature doubled at night after shearing in September and nearly trebled in March. The difference is no doubt at least partly due to the fleece removal and increased heat loss from the skin to the environment, but also indicates that, at night, the goats were more peripherally vasoconstricted and had switched to a heat conservation strategy.
In addition to conserving heat though greater peripheral vasoconstriction, animals could prevent a further decrease in body temperature post-shearing by increasing their heat production. Although we did not measure metabolic rate directly, our two index goats, and therefore presumably the herd, increased activity levels (Figure 5, lower panel) after March shearing. The increased activity level during the early morning in March may have contributed to the increased water influx post shearing, as goats, like sheep (Birrell, Reference Birrell1989), are likely to consume dew on plant leaves at this time. In addition, the increased water influx (Figure 6, upper panel) and increased serum glucose (Figure 7, lower panel) after March shearing suggest that the goats increased their food intake and metabolic rate after shearing. Despite such efforts, the increased mean daily amplitude and rate of rise of abdominal temperature after shearing shows that the goats were more thermally labile after shearing, even though the index goat in the herd selected more stable microclimates after March shearing (Figure 8).
Paradoxically, the change in thermoregulatory status with shearing was greater in March than in September, despite ambient temperatures being significantly lower in September than in March. Both daily maximum and mean abdominal temperatures decreased more after the March shearing than they did after the September shearing (Figure 2). Also, daily minimum and mean subcutaneous temperatures decreased more after the March shearing than after the September shearing (Figure 3). How might one account for the exaggerated transition in thermoregulatory status with shearing in late summer? We believe that differences resulted from seasonal acclimation; in March the predominant demands on the goats’ thermoregulatory system were heat dissipation, even at night, before shearing. The goats were dehydrated before shearing in March, as evident in their relatively high serum osmolality and serum protein concentration (Figure 7). We surmise that the chronic heat stress imposed on fleeced goats in March results in a reduction in the competence of their autonomic responses necessary for heat conservation. Consequently, the goats were less well equipped in the late summer than in the late winter to cope with the loss of the insulating fleece.
If our conclusions are right, we would expect Angora goats to be compromised by shearing even more in the hotter summers to which they can be exposed. Nevertheless, we detected differences in thermoregulatory responses between seasons in which globe temperature differed by only 5°C (Table 1). Our measurements of activity were based on the behavior of two goats and microclimate selection was based on the behavior of a single index goat in the herd, and, although the animals always were observed together, that the herd behaves homogeneously would need to be confirmed. Also, we deprived the goats of drinking water in March, as could occur in summer seasons they might encounter, but not in winter. Water deprivation increases abdominal temperature in heat-stressed goats (Nijland and Baker, Reference Nijland and Baker1992; Jessen et al., Reference Jessen, Dmi’el, Choshniak, Ezra and Kuhnen1998), but there is no evidence that short-term water deprivation compromises thermoregulation in animals not exposed to heat stress (Baker and Doris, Reference Baker and Doris1982; Fuller et al., Reference Fuller, Meyer, Mitchell and Maloney2007).
Although the thermoregulatory responses of goats to shearing do not appear to have been investigated previously, in a thermal environment similar to those to which our goats were exposed, shearing decreased the body temperature of Merino sheep (Parer, Reference Parer1963; Beatty et al., Reference Beatty, Barnes, Fleming, Taylor and Maloney2008). However, the minimum body temperature reached by the Merino sheep was not as low (38.5 v. 38.1°C) and the drop in minimum body temperature post-shearing was not as great (0.4 v. 0.7°C) as that in our goats. If the nychthemeral pattern of body temperature in the Merino sheep was similar to that of our goats, Parer’s (Reference Parer1963) non-continuous measurements may have overestimated minimum body temperature by measuring early-morning body temperature when it already was rising. The lower minimum body temperature of Parer’s (Reference Parer1963) shorn Merino sheep was associated with an increased amplitude and a greater rate of rise of body temperature than those of unshorn Merino sheep, as we found in our goats. However, the Merino sheep, yarded in pens and exposed to solar radiation, showed slightly higher maximum rectal temperatures after shearing compared to before shearing (Parer, Reference Parer1963; Hopkins et al., Reference Hopkins, Knights and Feuvre1978), while our goats had lower maximum abdominal temperature post-shearing compared to pre-shearing. In Merino sheep, the body temperatures both before and after shearing were lower than the maximum body temperature that we observed in our goats. We suspect that the Merino sheep, in spite of their full fleece, never were as heat-stressed as our goats were. Angora goats, exposed to full sun, have been shown previously to have higher, and more variable, body temperatures than Merino sheep do (McGregor, Reference McGregor1985 and Reference McGregor1998), suggesting that solar radiation provides a greater heat load on Angora goats than on Merino sheep.
An elevation in rectal temperature after shearing also has been reported in dairy sheep, which have an open fleece more like that of Angora goats than Merino sheep. Dairy sheep also exhibited a transient loss of body temperature rhythm after shearing, which the authors attributed to an over-reaction to mild cold stress as a result of the loss of fleece (Piccione et al., Reference Piccione, Caola and Refinetti2002). However, the various studies on dairy sheep are difficult to interpret because the findings are inconsistent. Comisana ewes, housed indoors, showed hypothermia after shearing at air temperatures of 16–21°C (Piccione and Caola, Reference Piccione and Caola2003), hyperthermia at 16–28°C (Piccione et al., Reference Piccione, Caola and Refinetti2002), but no change in morning rectal temperature when sheep were grazed in stubble pasture at an air temperature of 35°C (Pennisi et al., Reference Pennisi, Costa, Biondi, Avondo and Piccione2004). In one instance, the post-shearing hyperthermia lasted many weeks (Piccione et al., Reference Piccione, Caola and Refinetti2002). These inconsistencies may have arisen partly because the investigators measured rectal temperatures, a procedure that is likely to induce handling hyperthermia (Hargreaves and Hutson, Reference Hargreaves and Hutson1990).
Although there may be a discrepancy in the way that shearing affects the body temperature of sheep and Angora goats when they are exposed to the diurnal thermal environment, there is no such discrepancy at night, when shorn animals have to implement heat conservation strategies, particularly under cool, windy conditions (Morris et al., Reference Morris, Howard and MacFarlane1962; McArthur and Monteith, Reference McArthur and Monteith1980). These nighttime effects hold even, as we have shown, under relatively mild summer conditions. Like our goats, sheep have difficulty with heat conservation after shearing, as evident in the decrease in rectal temperature when shorn sheep are exposed to cold environments (Slee, Reference Slee1966; Webster and Lynch, Reference Webster and Lynch1966; Phillips and Raghavan, Reference Phillips and Raghavan1970; Panaretto and Vickery, Reference Panaretto and Vickery1971; Bennett, Reference Bennett1972; Hofman and Riegle, Reference Hofman and Riegle1977).
One of the thermoregulatory mechanisms available to animals to conserve body heat is vasoconstriction, and our goats seemingly employed that mechanism at night, but only after shearing (Figure 4). In a previous laboratory study of a single Angora goat, the difference between skin and rectal temperature increased from 6°C in warm dry conditions to 20°C when exposed to cold, wet and wind conditions, just before the goat collapsed (Fourie, Reference Fourie1984). Those differences are much greater than the values we have reported, but we measured subcutaneous temperature and not skin surface temperature. Vasoconstriction leads to a reduction in heat delivery to the skin, so that, when ambient temperature is below core temperature, a low skin surface temperature would reduce the outer temperature gradient and consequently slow the sensible heat dissipation from the goat’s body (Bianca and Kunz, Reference Bianca and Kunz1978). As with our goats, skin temperature was lower in shorn than in unshorn sheep, particularly when the sheep were exposed to cold environmental conditions (Slee, Reference Slee1966; Webster and Lynch, Reference Webster and Lynch1966; Phillips and Raghavan, Reference Phillips and Raghavan1970; Donnelly et al., Reference Donnelly, Lynch and Webster1974; Glass and Jacob, Reference Glass and Jacob1992).
Another appropriate thermoregulatory mechanism to conserve body heat is the selection of warm microclimates. Our index goat, and therefore presumably the herd, selected warmer microclimates at low environmental heat loads after shearing (Figure 8). These results concur with results obtained for shorn sheep, which sought shelter at night (Alexander et al., Reference Alexander, Lynch and Mottershead1979; Mottershead et al., Reference Mottershead, Alexander and Lynch1982), so reducing their heat loss (Done-Currie et al., Reference Done-Currie, Wodzicka-Tomaszewska and Lynch1984), more frequently than did unshorn sheep. During the heat of the day, our shorn goat, like sheep (MacFarlane et al., Reference MacFarlane, Howard and Morris1966), frequently sought shaded sites and thus reduced its exposure to environmental heat load to a greater degree when shorn than when unshorn. The degree of shelter provided is of critical importance for the survival of shorn Merino sheep (Hutchinson and Bennett, Reference Hutchinson and Bennett1962) and Angora goats are more dependent on shelter than are Merino sheep (McGregor, Reference McGregor1998).
Although shearing impairs heat conservation, it facilitates radiant heat gain during the day. When radiant heat load is high, evaporative water loss, both cutaneous and respiratory, may be required to maintain thermal balance. In goats and sheep, cutaneous evaporation (Robertshaw, Reference Robertshaw1968; Hofmeyr et al., Reference Hofmeyr, Guidry and Waltz1969) and respiration rate increased after shearing (Appleman and Delouche, Reference Appleman and Delouche1958; MacFarlane et al., Reference MacFarlane, Morris and Howard1958 and Reference MacFarlane, Howard and Morris1966; Parer, Reference Parer1963). Extra evaporation demands more body water and the water turnover rates of Merino sheep nearly doubled after shearing, when maximum air temperatures averaged 36 to 38°C (MacFarlane et al., Reference MacFarlane, Howard and Morris1966). Since Angora goats are more water dependent than are Merino sheep (McGregor, Reference McGregor1986), we would have expected a similar increase in the water turnover of our Angora goats. The water turnover rates of our Angora goats also increased significantly after shearing, though they did not double (Figure 6, lower panel). We could not measure evaporation rates in our free-living goats, but surmise that the higher water turnover after shearing was at least partly the result of higher evaporative water loss. Indeed, we suspect that the impairment of cutaneous water loss is one factor that contributed to the relatively high body temperature of our Angora goats before shearing.
In parallel with the increased water turnover post-shearing in our Angora goats, there was increased water influx (Figure 6, upper panel) after shearing. The routes for water influx available were only pre-formed water in forage or metabolic water, since we prevented access to drinking water. Shearing increases the food intake (Wheeler et al., Reference Wheeler, Reardon and Lambourne1962; Webster and Lynch, Reference Webster and Lynch1966; Hutchinson and McRae, Reference Hutchinson and McRae1969; Avondo et al., Reference Avondo, Bordonaro, Marletta, Guastella and D’Urso2000) and metabolic rates (Hutchinson and Bennett, Reference Hutchinson and Bennett1962; Panaretto and Vickery, Reference Panaretto and Vickery1971; Bennett, Reference Bennett1972; Hofman and Riegle, Reference Hofman and Riegle1977; Symonds et al., Reference Symonds, Bryant and Lomax1986) of sheep, and goats (Holmes and Moore, Reference Holmes and Moore1981; Holmes and Clark, Reference Holmes and Clark1989), particularly when exposed to cool environmental conditions. Similarly, cold exposure increases the metabolic rate of Angora goats (Wentzel et al., Reference Wentzel, Viljoen and Botha1979; Fourie, Reference Fourie1984), as indicated by an increased heart rate and blood glucose concentration. Our Angora goats also showed an increased blood glucose concentration immediately after shearing (Figure 7, lower panel). We caution, though, that blood glucose concentration may not be a reliable index of energy status of Angora goats, since Angora goats have an abnormal glucose homeostasis, brought about by selection for high levels of mohair production (Cronje, Reference Cronje1995). Nevertheless, since air temperature often fell below the lower critical temperature of 20°C reported for shorn Angora goats in dry conditions (Fourie, Reference Fourie1984), we believe our goats would have had increased metabolic rates, and so produced more metabolic water. This increased metabolic rate is likely to be an important factor contributing to the increased energy requirements of Angora goats (Lachica and Aguilera, Reference Lachica and Aguilera2003) after shearing.
Though shearing itself would have caused an increased metabolic rate, a further increase in metabolic rate would have resulted from the increased activity post-shearing. Our two index goats, and so, presumably, the herd, showed an increase in daily activity from pre- to post-shearing during March (Figure 5). Similarly, the foraging time for shorn Merino sheep is higher than for unshorn Merino sheep (Hutchinson and McRae, Reference Hutchinson and McRae1969; Birrell, Reference Birrell1989). The activity pattern of our goats was biphasic, with most activity, which presumably was foraging activity, taking place after sunrise and in the late afternoon. Biphasic patterns of foraging activity have been reported previously for both Merino sheep (MacFarlane et al., Reference MacFarlane, Howard and Morris1966) and Angora goats (Askins and Turner, Reference Askins and Turner1972). Goats also show seasonal variation in daily activity rhythm, with the highest activity levels reported during vernal equinox (Piccione et al., Reference Piccione, Giannetto, Casella and Caola2008). Yet, the increased activity observed after the March shearing was not observed after the September shearing. Similar results were found for sheep in cold weather, in that daily movement patterns remained unaltered or even decreased after shearing (Webster and Lynch, Reference Webster and Lynch1966). These results are likely to correspond to the depression in food consumption reported for newly shorn sheep exposed to extreme cold (Webster and Lynch, Reference Webster and Lynch1966; Panaretto and Vickery, Reference Panaretto and Vickery1971; Donnelly et al., Reference Donnelly, Lynch and Webster1974), which is proposed to be a consequence of acute cold stress (Sykes and Slee, Reference Sykes and Slee1969b). The reduction in food intake coupled with the increased metabolic costs of thermoregulation may place the animals into negative energy balance, putting Angora goats at a greater risk of lethal hypothermia (McGregor and Butler, Reference McGregor and Butler2008b).
In summary, therefore, shearing induced autonomic and behavioral thermoregulatory responses in our Angora goats, as has been reported previously for both sheep and goats, and our goats’ thermoregulatory responses were congruent with post-shearing responses observed previously. What we have added is the paradoxical observation that the transition from the fleeced to the shorn state had greater thermoregulatory consequences in late summer than in late winter, despite colder conditions in late winter. We believe that, in summer, the goats lost some capacity for thermoregulation in the cold, because they had been chronically heat-stressed before shearing, and had adapted to that stress. Similarly, sheep are unable to adapt to sudden weather changes after shearing and exposure to cold stress after summer shearing results in higher mortalities than after winter shearing (Glass and Jacob, Reference Glass and Jacob1992). The resilience of sheep after shearing in winter may be the result of cold adaptation in winter (Sykes and Slee, Reference Sykes and Slee1969a; Slee, Reference Slee1972; Young, Reference Young1981). One of the few beneficial potential outcomes of global warming, associated with climate change, is a decrease in the statistical probability of stock losses due to cold, wet weather after shearing (Scholes et al., Reference Scholes, Midgley and Wand1999; Burton and Lim, Reference Burton and Lim2005). However, if fleeced animals are not acclimated or acclimatized to cold, they may actually become more susceptible to cold stress after shearing in a warmer future. That summer shearing imposes significant thermoregulatory stress on Angora goats may help explain their summer vulnerability to cold weather; in March 2007 an estimated 20 000 Angora goats died in the Eastern Cape of South Africa during a cold, wet spell. If, as we propose, adaptation to heat stress imposed on fleeced goats in summer compromises their heat conservation strategies, they will be more vulnerable to cold in summer. With interannual variability in rainfall and heavy rainfall events predicted to increase with future climate change (Boko et al., Reference Boko, Niang, Nyong, Vogel, Githeko, Medany, Osman-Elasha, Tabo and Yanda2007), we can anticipate increased Angora goat mortalities in summer if the practice of biannual shearing continues.
Acknowledgments
This research was supported by the National Research Foundation, South Africa, the University of the Witwatersrand Medical Faculty Research Endowment Fund and START/NORAD African PhD fellowship awarded to R. S. Hetem. We gratefully acknowledge Arthur and Trinette Rudman for their hospitality and for allowing the study to take place on their farm Blaauwkrantz; Stephan Woodborne at the CSIR for use of the high-temperature elemental analyzer for the determination of deuterium concentrations; Ms Elsbe Myburgh at the Department of Companion Animal Clinical Studies Section of Clinical Pathology, University of Pretoria, for serum total protein, glucose and osmolality analysis; students and staff of the Brain Function Research Group, University of the Witwatersrand, and the Centre for African Conservation Ecology, Nelson Mandela Metropolitan University, for their assistance with surgery.