Introduction
Many marine teleost fishes progress through morphologically and ecologically distinct life-history stages, beginning life as pelagic/planktonic larvae, metamorphosing into juveniles, and then maturing into adults. Along with ontogenetic shifts in morphology, habitat, and behavior, fish sensory systems must be able to adapt to or cope with the changing conditions in order to maintain the ability to detect critical components of the environment related to survival. Specifically related to the visual system, light availability (wavelength and intensity), sizes and colors of predators and prey, navigational requirements, and so on can all differ substantially as fishes mature and move into different habitats. Persistent neurogenesis in the teleost retina allows all retinal cell types to be added throughout life, allowing the retina to regenerate after injury and making retinal modifications possible over the course of development (see Easter & Hitchcock, Reference Easter and Hitchcock2000; Otteson & Hitchcock, Reference Otteson and Hitchcock2003; Stenkamp, Reference Stenkamp2007 for reviews). In addition to adding new cells to the retina, there can be selective death of certain cell types and/or phenotypic changes within existing cells (Stenkamp, Reference Stenkamp2007). It is also possible for opsin gene expression to change during the lifetime of a fish, resulting in different types of light-absorbing opsin proteins being expressed in photoreceptors (Evans et al., Reference Evans, Hárosi and Fernald1993; Hope et al., Reference Hope, Partridge and Hayes1998; Shand et al., Reference Shand, Hart, Thomas and Partridge2002, Reference Shand, Davies, Thomas, Balmer and Cowing2008; Cheng & Flamarique, Reference Cheng and Flamarique2004; Bowmaker et al., Reference Bowmaker, Semo, Hunt and Jeffery2008; Carleton et al., Reference Carleton, Spady, Streelman, Kidd, McFarland and Loew2008). This can result in changes in color discriminatory abilities and wavelength sensitivity ranges of photoreceptors. All these characteristics make for a highly plastic system capable of changing in multiple ways over the course of development.
Some studies have shown differences in photoreceptor distributions (Reckel et al., Reference Reckel, Melzer, Parry and Bowmaker2002; Taylor & Grace, Reference Taylor and Grace2005) and absorbance characteristics (McFarland & Loew Reference McFarland and Loew1994; Britt et al., Reference Britt, Loew and McFarland2001; Reckel et al., Reference Reckel, Melzer, Parry and Bowmaker2002; Carleton et al., Reference Carleton, Parry, Bowmaker, Hunt and Seehausen2005; Spady et al., Reference Spady, Seehausen, Loew, Jordan, Kocher and Carleton2005) between ecologically distinct species at a given life-history stage, and some have shown ontogenetic shifts in photoreceptor distributions (Braekevelt, Reference Braekevelt1984, Reference Braekevelt1985, Reference Braekevelt1988a,Reference Braekeveltb; Taylor & Grace, Reference Taylor and Grace2005) and opsin expression (recent references as above). Photoreceptor absorbance and distribution can also differ between members of the same species living in different photic habitats (Fuller et al., Reference Fuller, Fleishman, Leal, Travis and Loew2003). Comprehensive studies are needed, however, that examine retinal changes throughout development in a given species in order to assess the degree by which the teleost retina can change in both morphology and function within the lifetime of an animal and the extent to which the fish retina changes in concordance with shifts in ecology.
The Atlantic tarpon, Megalops atlanticus, makes an ideal model for such a study because larvae, juveniles, and adults are morphologically and ecologically very different. There is also much interest in understanding the biology of this species because it is a large piscivorous species as an adult and is the basis for economically important recreational fisheries in the Caribbean, Gulf of Mexico, and Florida Atlantic coast. Megalops atlanticus belongs to the teleost subdivision Elopomorpha, which contains a highly diverse assemblage of species, including tarpons (M. atlanticus and relatives), bonefishes, and eels, united primarily on the basis of a shared larval form (leptocephalus). Leptocephalus larvae of M. atlanticus hatch in the open ocean, but ultimately “settle” into shallow coastal waters and lagoons and undergo metamorphosis. Following metamorphosis, juveniles often live in highly turbid anoxic waters in mangrove marshes, breathing air at the water surface to survive. Finally, as they mature, M. atlanticus move back into deeper and less turbid coastal and oceanic waters, feeding on large prey and undergoing periodic feeding and spawning migrations. At each of these stages of development, light availability and visual requirements are very different, and thus, it was anticipated that photoreceptor distributions and absorbance characteristics would differ in ways that correspond to ecological needs at different life-history stages.
Materials and methods
Animals
All specimens used for each of the techniques are summarized in Table 1, along with morphometric measurements. Premetamorphic leptocephalus larvae of M. atlanticus were collected from the Florida Straits from 0 to 100 m depths by Multiple Opening and Closing Net with Environmental Sensing System plankton net during routine plankton surveys (described in Richardson & Cowen, Reference Richardson and Cowen2004). The fragile larvae were dead upon surfacing of the net and were immediately placed in the appropriate fixative solution (described below).
Morphometric measurements, retinal cell densities, and calculated visual acuity for specimens of Megalops atlanticus used in this study at different developmental stages

Superscript capital letters indicate significant differences within a column; numerical superscripts indicate the techniques used for these specimens: 1 = light microscopy, 2 = TEM, 3 = immunofluorescence.
Settlement-stage specimens were captured by moored plankton net during nighttime flood tides entering the Indian River Lagoon, Sebastian Inlet, FL, as described in Taylor and Grace (Reference Taylor and Grace2005) from the methods derived from Shenker et al. (Reference Shenker, Maddox, Wichinski, Pearl, Thorrold and Smith1993, Reference Shenker, Cowie-Mojica, Crabtree, Patterson, Stevens and Yakubic2002). Live specimens were identified under dim red light (to keep eyes in a dark-adapted state), immediately euthanized in a solution of 200 mg/l tricane methanesulphonate (MS-222), and placed into the appropriate fixative solution.
Juvenile M. atlanticus were collected from impounded mangrove marshes adjacent to the Indian River Lagoon in Brevard County, FL, by either cast net or hook-and-line fishing. Specimens were returned alive to the laboratory, euthanized in a solution of 500 mg/l MS-222, and then decapitated prior to the eyes being enucleated.
Adult M. atlanticus were collected at night by hook and line from Sebastian Inlet, FL, and from Grand Cayman, Cayman Islands, British West Indies. These large fish were immediately anesthetized with a solution of 1000 mg/l MS-222 being administered directly to the gills with a syringe and then the fish were decapitated prior to enucleation of the eyes.
Specimen preparation
For transmission light microscopy, antiopsin immunofluorescence, and transmission electron microscopy (TEM), premetamorphic and settlement-stage (metamorphic) larvae were initially immersion-fixed whole (following appropriate euthanasia). Upon returning to the laboratory (2–4 h later), larval heads were removed and placed in the appropriate fixative solution (see below) for a minimum of 24 h with one change of fixative. For juveniles and adults, the eyes of freshly euthanized fish were enucleated and dorsal aspects of eyes immediately marked with a small notch in the sclera for later orientation. Right eyes were prepared for light and electron microscopy, left eyes for immunocytochemistry. The anterior segment of each eye was immediately removed, and the eyecup (containing the retina and lens) was placed in the appropriate fixative for a minimum of 24 h with agitation and one change of fixative.
Immunofluorescence
For opsin immunocytochemistry, specimens were fixed in a solution of 4% paraformaldehyde and 15% picric acid in 0.1 m sodium phosphate buffer at pH 7.4. Following fixation (and cutting juvenile eyecups into quadrants), all tissues were rinsed in phosphate-buffered saline (PBS), infiltrated with 25% sucrose in 0.1 m phosphate buffer, pH 7.4, and then embedded in Tissue-Tek and frozen at −25°C. Frozen cross sections (ca. 16 μm) were subsequently prepared on a Leica cryostat, and sections thaw-mounted onto gelatin-coated glass microscope slides. For the premetamorphic larvae and settlement-stage specimens, serial sections were predominantly made across the entire head/eye in the dorsoventral plane in the nasal, central, and temporal regions of the eye; whenever possible, serial sections were also cut in the nasotemporal plane in the dorsal, central, and ventral regions of the eye. For juveniles, eyes were cut into quadrants and radial cross sections were prepared from the dorsal, ventral, nasal, and temporal regions of the eye. For the adult specimen, the entire eyecup was frozen in Tissue-Tek and subsequently cut into quadrants with a saw; the contrast between the tough sclera and fragile retina made cutting difficult by other means. Radial cross sections of the retina were prepared as for juveniles.
After drying at room temperature, slides were placed in fixative for 5 min and then rinsed in four changes of Tris-buffered saline (TBS—0.5 m Trizma® buffer, 0.9% NaCl, pH 7.4). Slides were then incubated overnight (minimum 8 h) at room temperature with opsin primary antisera. Single-labeled retinas were incubated with anticone opsin (CERN-906; 1:1000) or antirhodopsin (CERN-922; 1:500) (CERN antibodies donated by W.J. DeGrip, University of Nijmegen, Nijmegen, The Netherlands); double-labeled retinas were incubated with CERN-906 and MAB5316 (1:500; Chemicon International Billerica, MA) for concurrent viewing of cone and rod opsins, respectively. Antibody solutions were diluted in TBS containing 0.25% λ-carrageenan, 1% bovine serum albumin, and 0.3% Triton X-100. After rinsing in four changes of TBS, slides were incubated with agitation for 1 h at room temperature with either a Goat Anti-Rabbit Immunoglobulin G (GAR IgG) conjugated with fluorescein isothiocyanate (Cappel Inc., now MP Biomedicals, Irvine, CA) or a secondary antibody conjugated with Alexa Fluor fluorescent dye (GAR IgG Alexa-488 or Goat Anti-mouse IgG (GAM IgG) Alexa-555; Invitrogen Molecular Probes, Carlsbad, CA). Negative controls for each specimen included omission of the primary and/or secondary antibodies; when double labeling was performed, additional controls were single labeled with each primary/secondary combination. Slides were coverslipped with Slowfade (with DAPI nucleic acid stain; Invitrogen Molecular Probes) and digitally photographed. Photoreceptor outer segments (OS) that were labeled by CERN-906 were designated as anticone immunoreactive and those labeled by CERN-922 or MAB5316 as antirod immunoreactive.
Transmission electron microscopy
For TEM, specimens were fixed in a solution of 2.5% glutaraldehyde, 2.5% paraformaldehyde, and 0.008% CaCl2 in 0.1 m sodium cacodylate buffer, pH 7.4. Whole larval heads and juvenile eyecup quadrants were subsequently rinsed in PBS (0.9% NaCl, pH 7.4), postfixed in 1% osmium tetroxide for 1 h, rinsed in PBS again, and then dehydrated in a graded acetone series and embedded in Durcupan ACM epoxy resin (Electron Microscopy Sciences, Hatfield, PA) for sectioning. The adult eyecup, for reasons described above, was dehydrated and embedded whole in Durcupan ACM epoxy resin, and then cut into quadrants and ultimately into 0.5 × 1.0-cm blocks with an industrial band saw. Blocks were cut from the dorsal, ventral, nasal, and temporal regions of the eye.
Following embedding, ultrathin (ca. 70-nm-thickness) retinal cross sections, cut with a diamond knife, were prepared for all specimens. Sections were prepared through larval heads in the center of the eye (dorsoventral plane) and then blocks were rotated to produce radial cross sections through the center of the temporal region. Radial cross sections were cut from each quadrant in the central retina of juvenile and adult specimens. Sections were mounted on formvar-coated copper mesh grids and stained in a CO2-free environment with 0.5% aqueous lead citrate for 1 min, then rinsed in 0.01 m NaOH. This was followed by staining for 1–2 min in 2% aqueous uranyl acetate, rinsing in CO2-free double distilled (dd) water, and then staining one additional minute in fresh 0.5% lead citrate. This was followed by a final rinse in 0.01 m NaOH and then in CO2-free dd water. Imaging was performed on a Zeiss EM900 TEM (Cent Zeiss Inc., Peabody, MA) at 80 kV. Developed film images were digitized at 4800 dpi with a CanoScan 9950F (Canon USA, Lake Success, NY) flatbed film scanner. Photoreceptor morphologies and ultrastructures were described from digital images; photoreceptor OS lengths and widths were digitally measured from the longest/widest profiles in a single section using AnalySIS 5/iTEM imaging software (Olympus Soft Imaging Solutions Corp, Münster, Germany).
Light microscopy
For transmission light microscopy, specimens were prepared and embedded in Durcupan ACM epoxy resin as described above. After embedding, 1.0 μm retinal cross sections were prepared in the same orientations as described for TEM. Sections were cut with glass knives, heat mounted onto silane-coated slides (Electron Microscopy Sciences), stained with a 1:1 mixture of 1% azure II in water and 1% methylene blue in 1% sodium borate, and coverslipped with immersion oil. Images were taken with a Pixera 600CL 5.8 MP camera (Pixera corporation, San Jose, CA) and analyzed with standard imaging software.
For larval- and settlement-stage fish, rod, cone, and ganglion cell nuclei were quantified in each of three retinal regions (dorsal, center, and ventral), within two randomly chosen 0.05-mm strips of retina in each region. Data were collected from the cross sections having the greatest lens diameters (i.e., the center of the retina; cf. Pankhurst et al., Reference Pankhurst, Pankhurst and Montgomery1993). For larger fish, each retinal region was divided into three different zones, each comprising one-third of the region—the peripheral, the medial, and the central zones. Within each of these three zones, rod and cone nuclei were counted in four different (and randomly chosen) 0.05-mm strips. The average of the three zones was used for comparison of photoreceptor densities between retinal regions.
In order to assess changes in the abilities of developing M. atlanticus to visually discriminate prey and other objects, theoretical photopic visual acuity was calculated. The minimum separable angle (MSA) in degrees (the smallest visual angle at which two points can be discriminated as separate) was calculated based on the density of cones in the central retina and the lens diameter using the following equation from Lara (Reference Lara2001):

where a = MSA degrees, c = distance between centers of adjacent cones in millimeters, and r = radius of the lens in millimeters.
Statistical analysis
Significant differences in photoreceptor and ganglion cell densities among retinal regions and among developmental stages, and significant differences among photoreceptor OS lengths and diameters were determined using one-way analysis of variance followed by post hoc Tukey’s tests (95% confidence interval). Significant differences are indicated in Tables 1 and 2 and Fig. 3.
Mean length and width measurements of photoreceptor OS in different developmental stages of elopomorph fishes

Superscript capital letters indicate significant differences within a column. N = total number of animals; n = total number of photoreceptors.
Tissue shrinkage
Photoreceptor and ganglion cell sizes, densities, and calculated theoretical visual acuities are all affected by the extent that tissues shrink during the histological procedures. Tissue shrinkage was determined experimentally for retinal tissue and for ocular lenses taken from juvenile M. atlanticus. Four premeasured lenses and four premeasured rectangular pieces of isolated retinal tissue were fixed for 48 h in a solution of 2.5% glutaraldehyde, 2.5% paraformaldehyde, and 0.008% CaCl2 in 0.1 m sodium cacodylate buffer, pH 7.4, and then dehydrated in a graded acetone series exactly as tissues were prepared for light microscopy and TEM. Shrinkage was calculated as the average that lens and retinal tissue decreased in overall diameter/length—9.3 ± 0.7% for lens and 18.0 ± 1.5% for retinal tissue. These shrinkage factors have been applied to all cell density and visual acuity calculations in this manuscript.
Microspectrophotometry
Juvenile M. atlanticus were collected and shipped alive to Cornell University for microspectrophotometric study of the spectral absorption properties of individual photoreceptor cells. Settlement-stage larvae were collected, identified, and euthanized under dim red light and placed immediately into cold buffer (sodium/potassium phosphate, 6% sucrose, pH 7.2). The adult specimen was collected from Grand Cayman, Cayman Islands, British West Indies, anesthetized, and euthanized as described above; eyes were enucleated under dim celestial light and placed immediately into cold buffer and shipped on ice overnight to Cornell University.
Preparation of tissue for Microspectrophotometer (MSP) was done at Cornell University using a dissecting microscope equipped with infrared illuminators and infrared-to-visible image converters. When size permitted, eyes were hemisected and retinas isolated in PBS (pH 7.2) made hypertonic with 6% sucrose. Small pieces of isolated retina were transferred in buffer to coverslips, cut and teased with 11 scalpel blades, and sandwiched with another coverslip edged with silicone vacuum grease. For very small larvae, whole eyes were macerated and teased apart on the coverslip followed by sandwiching. The computer-controlled single-beam MSP and associated software has been previously described (Loew, Reference Loew1994). With a 100 W tungsten–halogen lamp together and quartz/fluorite optics, accurate absorbance measurement from 350 nm [ultraviolet (UV)] to 700 nm (red) was possible.
Acceptance criteria and analytical techniques are as in Loew (Reference Loew1994). The spectral region of the peak absorbance, the λmax, was used to determine the number of photoreceptor cell spectral classes. Determination of visual pigment λmax was performed using the Mansfield–MacNichol method for template fitting (see MacNichol, Reference MacNichol1986). Association of visual pigment to photoreceptor class was confirmed using an Olympus BHT microscope (Olympus Corporation, Center Valley, PA) fitted with Nomarski optics for contrast enhancement.
Digital image presentation
Contrast and brightness parameters were adjusted in all digital images presented in the following figures. Images were manipulated solely to enhance clarity and interpretability of the data.
Results
Photoreceptor morphology
All microscopy techniques revealed clearly distinguishable rod and single cone cells in M. atlanticus at settlement through the adult stage. Furthermore, TEM revealed consistent differences in OS laminar membrane organization that were present at all these stages of development. In all cells with cone-like morphology (tapered OS, large diameter inner segments with many mitochondria) and that were labeled by anticone opsin (Fig. 1C and 1D), laminar membranes in the OS were tightly apposed with distinct loops at the tips (Fig. 1A). In many of these cone cells, the laminar membranes also appeared to be continuous with the plasma membrane on one side (i.e., the plasma membrane was not discriminable from the laminar membranes) (Fig. 1A). In cells with rod-like morphology and that were labeled by antirhodopsin (Fig. 1E and 1F), however, laminar membranes were clearly separate (nonapposed) and not continuous with the plasma membrane (i.e., there was a clearly distinct plasma membrane separate from the laminar membrane) (Fig. 1B). It was determined that the apposed versus nonapposed nature of the laminar membranes was the most consistent and reliable characteristic for discriminating rods and cones in elopomorph fishes with TEM; therefore, this characteristic was used throughout the study, and especially to discriminate very tiny rod and cone cells in larval retinas.
Discrimination of rod and cone cells in the retinas of juvenile and adult Megalops atlanticus using TEM and immunofluorescence. (A) OS laminar membrane arrangement in cone cells with tightly apposed membranes (AM); on one side of the OS, loops (L) are formed at the tips of the disks, and on the other side, the laminar membranes and cell plasma membrane are clearly continuous (CPM). (B) OS laminar membrane arrangement in rod cells with nonapposed or separate membranes (SM); the laminar membranes and cell plasma membrane are seperate/noncontinuous (NPM). (C) The typical overall morphology of a cone cell with a long tapered OS and a large elliptical inner segment (IS) containing many mitochondria. (D) Immunofluorescence of a cone cell showing the strong labeling by CERN906 and the slender tapered OS. (E) The typical overall morphology of a rod cell with stout blunt-tipped OS (black arrows) and small diameter IS (white arrows) with fewer mitochondria than in the cone cell. (F) Immunofluorescence of rod cells showing the strong labeling by CERN922 and stout blunt-tipped OS. Scale bars: A, 0.09 μm; B, 0.15 μm; C and E, 2.5 μm; D and F, 10 μm.

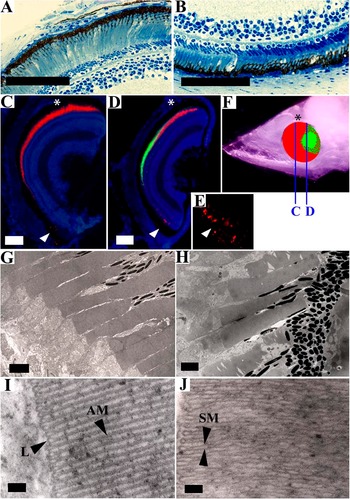
At the premetamorphic larval stage, rod and cone cells were not morphologically distinguishable with light microscopy or low-magnification TEM (<50,000×). At these magnifications, all photoreceptors appeared morphologically rod like. At higher TEM magnifications, however, photoreceptors with tightly apposed laminar membranes (i.e., cone-like) could clearly be seen in the midtemporal region of the retina (Fig. 2I), while those in the dorsal and ventral regions had separate laminar membranes (Fig. 2J).
Photoreceptor OS morphology, ultrastructure, and opsin immunoreactivity in larval Megalops atlanticus. Dorsal aspects are marked with an asterisk in (C), (D), and (F). (A and B) Light micrographs showing slende, rod-like morphology of all photoreceptors and differences in OS length between the dorsal (A) and ventral (B) retinal regions. (C) Double-labeled nasal retina (anterior to the center of the eye) cut in the dorsal–ventral plane showing only rod immunoreactive (RIR) labeling (red) and no cone immunoreactive (CIR) labeling. (D) Double-labeled retina cut in the dorsal–ventral plane just caudal to the center of the eye showing only CIR labeling (green) in the middle of the retina and only RIR labeling (red) in the dorsal (top) and ventral (bottom) regions. Ventral RIR labeling is barely visible at low magnification because photoreceptors are small and are occluded by melanin—area indicated by white arrow enlarged in (E). (F) The location of the CIR region (green area) based on systematic sectioning through the entire retina, with “C” and “D” indicating the location of the cross sections depicted in (C) and (D), respectively. (G and H) TEM micrographs showing that morphologies of OS in the (G) midtemporal region (where CIR cells are located) and the (H) dorsal region (where RIR cells are located) are nearly identical at lower magnifications. (I and J) TEM micrographs clearly showing apposed laminar membranes (AM) in CIR cells in the midtemporal retina (I) and separate (nonapposed—SM) membranes on RIR cells in the dorsal retina (J). Scale bars: A–D, 50 μm; F, 1.7 μm; G, 2.5 μm; H and I, 0.05 μm.

Photoreceptor and opsin distributions
Leptocephalus larvae
In the larval premetamorphic M. atlanticus retina, slight-to-moderate anticone opsin immunoreactivity was restricted to only the midtemporal (forward-looking) region (Fig. 2C–2F). Antirhodopsin labeling was absent from a small patch in this midtemporal region but occurred throughout the remainder of the retina. Serial sections through the entire eye in the dorsal–ventral plane revealed that the population of anticone reactive cells in the midtemporal region was skewed slightly toward the dorsal side (Fig. 2F).
Laminar membranes of photoreceptors in the midtemporal anticone reactive region were tightly apposed, while those in the dorsal and ventral antirod-reactive regions were clearly separate (Fig. 2I–2J). There were also differences in OS length and width between retinal regions. The mean length of OS in the larval M. atlanticus dorsal and ventral retina was significantly different from that in the midtemporal retina; OS diameters did not differ between regions (Table 2).
Total photoreceptor cell density did not vary significantly between the dorsal, central, and ventral regions of the larval M. atlanticus retina (D 25.4 ± 1.8; C 28.3 ± 3.5; V 31.3 ± 1.8 cells/0.05 mm). All photoreceptors in the dorsoventral plane through the center of the eye were considered to be rod cells based on the immunostaining and TEM data described above; all photoreceptors in the medial temporal region were considered to be cones. Density of these temporal cones (40.7 ± 1.8 cells/0.05 mm) was higher than rod density in the remainder of the retina (Fig. 3). Ganglion cell density was significantly higher in larvae than in juveniles or adults (Table 1), with a rod to ganglion cell ratio of about 1:1.8 and a cone to ganglion cell ratio in the central retina of 1:1.25. Based on lens diameter and cone cell density in the midtemporal retina, calculated theoretical visual acuity for larval M. atlanticus (in the forward-looking midtemporal retina) was 0.397 deg MSA.
Changes in cone (A) and rod (B) photoreceptor density in different regions of the retina and Megalops atlanticus over four developmental stages. Capital letters denote significant differences between successive developmental stages in a given retinal region (i.e., within a cluster of bars, indicated by the same superscript letters); numbers denote significant differences between retinal regions within the same developmental stage (i.e., comparing bars of identical color with matching superscripts). Single-factor analyses of variance were performed for all data sets, followed by post hoc Tukey’s tests (95% confidence interval).

Due to the fragility of young larvae and fixation and transport difficulties from an open ocean research vessel, MSP results could not be acquired for premetamorphic larvae. Therefore, the earliest stage successfully analyzed with MSP was the settlement stage.
Settlement-stage larvae
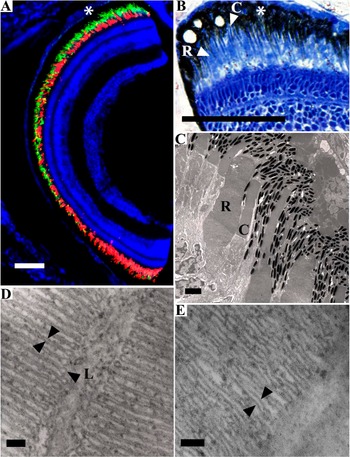
Morphologically and immunologically distinct rod and single cone cells were present throughout the settlement-stage M. atlanticus retina, but their distributions differed markedly between different retinal regions. Immunofluorescence revealed slender OS labeled strongly by anticone opsin and stouter OS labeled strongly by antirhodopsin. TEM results were consistent, revealing tightly apposed laminar membranes in the slender cone-like OS and nonapposed membranes in stout rod-like OS (Fig. 4C–4E). Rod outer segments were not significantly longer than those of cone cells but were much wider (Table 2).
Photoreceptor OS morphology, ultrastructure, and opsin immunoreactivity in settlement-stage Megalops atlanticus. Dorsal aspects are marked with an asterisk in (A) and (B). (A) Dorsal–ventral cross section through the center of the eye with rod photoreceptors labeled with MAB5316 (red) most dense ventrally and cone photoreceptors labeled with CERN906 (green) most dense dorsally—cell nuclei counterstained with DAPI. (B) Light micrograph showing slender cones “C” and stout rods “R” in the dorsal retina. (C) Electron micrograph of the dorsal retina showing slender cones “C” and thick stout rods “R.” (D) Electron micrograph showing tightly apposed laminar membranes (opposing arrows) in a cone cell with distinct loops (L) at the tips of the membranes. (E) Electron micrograph showing separate/nonapposed membranes (opposing arrows) in a rod cell. Scale bars: A and B, 50 μm; C, 2.5 μm; D and E, 0.05 μm.

Rod cell density was highest in the ventral (24.6 ± 2.14 cells/0.05 mm) region compared with the dorsal (17.5 ± 1.20 cells/0.05 mm), central (16.7 ± 1.23 cells/0.05 mm), and temporal (9.79 ± 0.62 cells/0.05 mm) regions; this higher rod density in the ventral retina was also clearly visible with immunofluorescence (Fig. 4A). Anticone opsin immunoreactivity appeared strongest in the dorsal region (Fig. 4A), reflecting a higher cone cell density (distinct pattern, but not statistically significant) in the dorsal (26.0 ± 2.53 cells/0.05 mm) and temporal (26.8 ± 1.45 cells/0.05 mm) regions compared with the central (23.4 ± 1.44 cells/0.05 mm) and ventral (21.0 ± 3.30 cells/0.05 mm) regions (Fig. 3). The mean ganglion cell density was significantly higher in juveniles and adults (Table 1), with summation ratios of 1:2 for cones and 1:2.4 for rods. Based on lens diameter and cone cell density, calculated theoretical visual acuity for settlement-stage M. atlanticus was 0.607 ± 0.073 deg MSA.
At settlement, microspectrophotometry revealed rods (λmax ∼501 nm) and two classes of single cones (λmax ∼526 nm and 549 nm) in the smaller M. atlanticus specimen (22.5 mm Standard length [SL]), while one additional class of short-wavelength cone (λmax ∼453 nm) was identified in the larger individual (33.5 mm SL). All MSP data are summarized in Fig. 5; examples of photoreceptor absorption spectra are shown in Fig. 6.
Wavelengths of maximum absorbance (λmax) of different classes of photoreceptors in retinas of Megalops atlanticus at different stages of development. Arrows indicate the rod cell at each stage; error bars represent standard error of the mean; n = number of photoreceptors measured (i.e., those that met the selection criteria) making up the mean λmax value; y-axis is not used.

Representative MSP data meeting the selection criteria for template fitting (see Loew, Reference Loew1994). The filled circles and smooth curve are points obtained by fitting the raw data to a vitamin A1-based template using the Mansfield–MacNichol method (see MacNichol, Reference MacNichol1986). A = adult rod, B = adult UV cell, C = adult violet cell, D = juvenile long-wavelength cell.

Juvenile
At the juvenile stage, rod and single cone cells were easily distinguishable using all techniques. Unlike in larval and settlement stages, juvenile M. atlanticus rod OS were stacked into multiple layers and clustered into dense groups (Fig. 7A–7D), while cone OS were neither stacked nor clustered (Fig. 7F–7H). Immunofluorescence resulted in strong labeling of distinct OS by rod and cone opsin antisera throughout the retina (Fig. 7B and 7F). Rod and cone OS could be distinguished based on OS shape (rod OS had a blunt, nontapered tip in contrast to the slender, tapered tip of cone cells). Cone OS disk membranes were tightly apposed (Fig. 7I), while rod OS membranes were separate (Fig. 7E). Rods and cones were also distinguishable on the basis of nucleus shape and location, OS location, and patterns of distribution (Fig. 7A and 7H). Cone nuclei were ellipsoidal and located near or partially extending past the outer limiting membrane (OLM); rod nuclei were darker, more rounded and never extended past the OLM (Fig. 7H).
Rod and cone photoreceptors of the juvenile and adult Megalops atlanticus retina. (A) Overall organization of the outer retina showing bundles of rod cells (RB) extending far out into the retinal pigmented epithelium layer composed primarily of tapetum (T) crystals; cone outer segments (COS) are closer to the outer limiting membrane in the light-adapted retina; cone nuclei (CN) are at or extending past the outer limiting membrane, while all rod nuclei (RN) are located beneath (anterior to) the cone nuclei. (B) Dense bundles of many rod outer segments (ROS) clearly labeled with CERN922 antirhodopsin. (C) TEM micrograph of bundles of ROS and rod inner segment (RIS). (D) Light micrograph of ROS and RIS. (E) TEM micrograph showing separate/nonapposed laminar membranes (opposing arrows) characteristic of rod cells. (F) COS clearly labeled with CERN906 anticone opsin. (G) Electron micrograph showing a single COS and cone inner segment (CIS). (H) Light micrograph showing the location of COS, CIS, CN, and RN. (I) Electron micrograph clearly showing tightly apposed laminar membranes (AM) in cone cells, loops on one side of the COS and the laminar membranes continuous with the cell plasma membrane (CPM) on the other side of the outer segment. Scale bars: A and B, 50 μm; C, 2.5 μm; D, 5.0 μm; E, 0.09 μm; F, 50 μm; G, 2.5 μm; H, 50 μm; I, 0.15 μm.

The juvenile M. atlanticus retina had a well-developed tapetum layer in all regions of the retina (Fig. 7A). The tan-brown colored tapetum crystals were incorporated into the retinal pigmented epithelium (RPE) layer and surrounded clusters of rod cells or individual cone cells that were extended into the RPE in a light-adapted or dark-adapted state, respectively.
Cone OS were significantly longer than rod OS, but OS diameters did not differ (Table 2). There were distinct patterns in rod and cone cell densities in different regions of the juvenile M. atlanticus retina. Rod cell densities were significantly higher in the ventral (96.0 ± 3.10 cells/0.05 mm) and temporal (93.1 ± 2.99 cells/0.05 mm) regions than in the dorsal (86.3 ± 2.14 cells/0.05 mm) and nasal (73.5 ± 2.08 cells/0.05 mm) regions. Cone cell densities did not differ significantly between regions. Rod cell densities were dramatically higher at the juvenile stage than at settlement in all regions of the retina, while cone cell densities decreased significantly in all regions (Fig. 3). Mean ganglion cell density was significantly lower than the larval and settlement stages (ganglion cell density is now much lower than photoreceptor density), with a rod:GC summation ratio of 18:1 and a cone:ganglion cell (GC) ratio of 2:1. Based on lens diameter and cone cell density, calculated theoretical visual acuity for juvenile M. atlanticus was 0.086 ± 0.005 deg MSA.
At the juvenile stage, microspectrophotometry revealed three distinct classes of single cones (λmax ∼454, 529, and 548 nm), and the rod λmax had shifted to a longer wavelength (λmax ∼523 nm) than at the settlement stage (λmax ∼501 nm) (Fig. 5).
Adult
As in juvenile M. atlanticus, adult cone OS were significantly longer than those of rods, and the difference in length had become even greater (Table 2). Rod and cone OS widths, however, were not significantly different. Also as in juveniles, rod OS were grouped into large bundles, while cones were ungrouped and unpaired (Fig. 7).
Photoreceptor and opsin distributions in adult M. atlanticus were similar to those in juveniles. The adult stage, however, had significantly higher densities of rod cells (D 141.3 ± 2.68, V 189.8 ± 6.92, N 119.3 ± 4.48, T 157.1 ± 4.86 cells/0.05 mm) and significantly lower densities of cone cells (D 7.2 ± 0.39, V 8.1 ± 0.38, N 7.2 ± 0.27, T 7.0 ± 0.32 cells/0.05 mm) than the juvenile stage in all regions of the retina (Fig. 3). Mean ganglion cell density was significantly lower than at the juvenile stage, with a 53:1 rod:GC ratio and a 2.5:1 cone:GC ratio. Based on lens diameter and cone cell density, calculated theoretical visual acuity for adult M. atlanticus was 0.014 deg MSA.
In adult M. atlanticus, λmax for rod cells was near the settlement-stage wavelength (λmax ∼500 nm), showing a shift back to a shorter wavelength, and there were five classes of single cone cells (λmax ∼364, 411, 451, 476, and 551 nm) (Fig. 5). One cone class present at the juvenile stage was absent at the adult stage (λmax ∼529 nm).
Discussion
Rod-dominated retina in leptocephalus larvae
The early larval retinas of nearly all teleost fish species either contain only cone photoreceptors (no rods) or are highly cone dominated; most rod photoreceptors develop during or after metamorphosis (see e.g., Blaxter, Reference Blaxter1986; Evans & Fernald, Reference Evans and Fernald1990; Evans et al., Reference Evans, Hárosi and Fernald1993; Negishi & Wagner, Reference Negishi and Wagner1995; Shand, Reference Shand1997; Helvik et al., Reference Helvik, Drivenes, Harboe and Seo2001; Lara, Reference Lara2001). Because photopic visual acuity increases as either cone density or lens diameter increases (Pankhurst et al., Reference Pankhurst, Pankhurst and Montgomery1993; Shand, Reference Shand1994, Reference Shand1997; van der Meer, Reference van der Meer1994), the dense array of small cone photoreceptors in larval teleosts should maximize daytime visual acuity in tiny larval fish eyes.
The new data presented here show that M. atlanticus larvae have rod-dominated retinas, with a small patch of cone cells in the midtemporal region. This is very different from the typical pattern of teleost retinal development, and this likely carries both ecological and evolutionary significance. The larva of the European eel, Anguilla anguilla, has been described as having a pure rod retina prior to metamorphosis (Blaxter & Staines, Reference Blaxter and Staines1970; Pankhurst, Reference Pankhurst1984). Interestingly, A. anguilla and M. atlanticus are part of the teleost subdivision Elopomorpha, grouped primarily on the basis of a shared larval form called the leptocephalus larva. Leptocephalus larvae of the Japanese eel, Anguilla japonica, were found to have rod cells in the peripheral retina and short, cone-like cells in the central retina (Omura et al., Reference Omura, Uematsu, Tachiki, Furukawa and Satoh1997), perhaps similar to what is described here for M. atlanticus. It should be noted, however, that the investigations on these eel species did not employ antiopsin immunofluorescence, which was found in this present study to be an invaluable tool for identifying rod and cone opsin distributions in larval M. atlanticus.
Little is known about the behavioral ecology of leptocephalus larvae, except for the general pattern of vertical migration closer to the surface at night and deeper during the day (Pfeiler, Reference Pfeiler1989). These vertical migrations cause the retina to be exposed to mostly dim light; conditions under which a rod-dominated retina should be advantageous. Other species of teleost larvae are also known to undergo diel vertical migrations, but the patterns are variable (Brewer & Kleppel, Reference Brewer and Kleppel1986), and some species are known to migrate closer to the surface during the day and even feed solely during the day (Young & Davis, Reference Young and Davis1990).
The feeding ecology of leptocephalus larvae is also a mystery, primarily because of the lack of recognizable food material found in their guts. Several authors have hypothesized that leptocephali might acquire nutrients differently than do other teleost larvae, including direct absorption of dissolved organic matter (Pfeiler, Reference Pfeiler1986), feeding on aggregates of particulate organic matter (Mochioka et al., Reference Mochioka, Iwamizu and Kanda1993; Otake et al., Reference Otake, Nogami and Maruyama1993), and feeding on gelatinous organic material such as larvacean housings (Mochioka & Iwamizu, Reference Mochioka and Iwamizu1996). Feeding on large organic particles/aggregates might preclude the need for a cone-dominated retina capable of discriminating small prey items. The larvae of most other teleost species are thought to be planktivores, with zooplankton such as copepod nauplii being an important food source (see, e.g., Brewer & Kleppel, Reference Brewer and Kleppel1986; Young & Davis, Reference Young and Davis1990). Cone-dominated retinas of nonelopomorph teleost larvae are therefore thought to facilitate diurnal feeding on small plankton, further enhanced by the abundance of UV and short-wavelength–sensitive photopigments in larval fish retinas (Britt et al., Reference Britt, Loew and McFarland2001).
Developmental changes in the retina
At the settlement stage, M. atlanticus transition from a pelagic existence to coastal waters, at which time the new data presented here show that cone cells appear in other areas of the retina (besides just the midtemporal region). The addition of cones throughout the retina should increase daytime visual abilities and spatial acuity in the higher light, shallow-water environment. Cone cells appear most rapidly in the dorsal retina, while rod cell addition is most rapid in the ventral retina.
Settlement-stage rod cells have a λmax of ∼501 nm, which is within the range of maximum light transmission in clear, oceanic waters (Jerlov, Reference Jerlov1976), from which these larvae are transitioning. Cone cells at this metamorphic stage have λmax values of ∼453, 526, and 549 nm. All three of these cone classes identified in settlement-stage M. atlanticus persist at the juvenile stage.
Juvenile specimens for this study were captured in highly turbid anoxic mangrove marshes. In this environment, there is diminished light intensity overall, with longer wavelengths predominating. Several characteristics described here—the tremendous increase in eye size and rod cell density, the stacking and clustering of rod cells, and the development of a tapetum—should increase stimulation of rod cells by the available light and enhance the ability of these fish to see in the low-light conditions encountered in this habitat. At the juvenile stage, there has also been a shift in λmax for the rod cells, from ∼501 nm (at settlement) to ∼523 nm. This shift corresponds to the reduced availability of shorter wavelength light in turbid water (Jerlov, Reference Jerlov1976). The significantly higher rod densities in the ventral and temporal regions suggest better visual sensitivity in the forward- and upward-looking directions. Juvenile tarpon have sharply upturned mouths specialized for taking prey that is above their heads, and they are commonly seen feeding on small fish at the surface. This upward-looking visual field is therefore very important for feeding, and a high density of rod cells might enhance visualization of prey at the surface (dark prey against a light background) in this turbid water.
Cone cells were distributed throughout the retina at the juvenile stage, but cone cell densities were much lower than at the larval or settlement stages. Even so, the greatly increased eye diameter at the juvenile stage provides a dramatic increase in photopic visual acuity.
Adult tarpon were captured in two different locations—one in relatively clear Florida Atlantic coastal water, and one in very clear Caribbean coastal water. Photoreceptor distribution was similar to that in juvenile tarpon, with the highest density of rod cells in the ventral and temporal regions. Rod cell density, however, was much higher in adult tarpon, and cone cell density was lower in adults. Adult tarpon generally live in clearer waters than do juveniles, but the adaptations for low-light vision were found to continue (and progress) as eyes become larger and rod cells become smaller and more densely packed. Adult tarpon also frequently feed at the surface, both during the day and at night. The exquisitely developed scotopic visual system should allow excellent nighttime vision, especially when looking upward toward the dimly lit surface. With the shift back to clearer waters, the λmax for rod cells shifts back to around 500 nm, reflecting the increased transmission of shorter wavelength light.
Although overall cone density was lower at the adult stage, additional cone classes were identified in adults, at a time when tarpon exist more frequently in clearer waters and shorter wavelengths of light are more available. One of the medium wavelength classes of cones (∼530 nm) had disappeared by this stage, but three new classes of short-wavelength cones had appeared (λmax ∼364, 411, and 476 nm). This diverse array of cone cells makes use of nearly the full spectrum of light that is available for vision in clear water.
The reason for such extensive short-wavelength, and especially UV, vision in a large predator is unclear, as UV vision in fishes is generally thought to be an adaptation for the perception of tiny prey items consumed by planktivores (McFarland & Loew, Reference McFarland and Loew1994; Britt et al., Reference Britt, Loew and McFarland2001, Job & Bellwood, Reference Job and Bellwood2001, Cheng & Flamarique, Reference Cheng and Flamarique2004). The lack of visual pigment data for large, tropical, coastal/pelagic species, and the presence of only single cones in the retina of M. atlanticus make direct comparisons with other species difficult (most shallow-water teleosts also have double cones). The diverse array of single cone classes in adult M. atlanticus is similar to the spectral distribution seen in some Lake Malawi cichlids (Jordan et al., Reference Jordan, Kellogg, Howe, Juanes, Stauffer and Loew2006), which display a variety of feeding ecologies, but mostly feed on plankton or small prey. UV photoreceptors seem to occur occasionally in tropical coral reef fishes and were described in 8 of 38 species sampled from Hawaiian reefs (Losey et al., Reference Losey, McFarland, Loew, Zamzow, Nelson and Marshall2003), all of which feed on small prey (primarily plankton). Adult M. atlanticus is not considered to be a coral reef species, but its range does include the tropics, and it is occasionally seen around coral reefs in the Caribbean. The rod λmax in adult M. atlanticus (500 nm) is similar to that described for Hawaiian coral reef species (Losey et al., Reference Losey, McFarland, Loew, Zamzow, Nelson and Marshall2003) and for several lutjanid (snapper) species on the Great Barrier Reef (Lythgoe et al., Reference Lythgoe, Muntz, Partridge, Shand and Williams1994). Lutjanids are large carnivorous/piscivorous species living in relatively clear tropical waters; however, none of these lutjanids had cones in the UV range, and only one species had cones in the violet range (Lythgoe et al., Reference Lythgoe, Muntz, Partridge, Shand and Williams1994). At this point, there is not a clear ecological explanation for UV-sensitive cone cells in the adult M. atlanticus retina, except that more UV light should be available for vision in clear water that they sometimes inhabit, and UV-reflective patterns have been identified on small coral reef species (Siebeck et al., Reference Siebeck, Parker, Sprenger, Mäthger and Wallis2010) that could be potential prey for M. atlanticus.
Like other species studied, theoretical visual acuity is shown here to increase dramatically with development, following metamorphosis. Visual acuities for larval- and settlement-stage M. atlanticus are comparable with what has been reported for several species of settlement-stage coral reef fishes (Lara, Reference Lara2001). However, juvenile M. atlanticus photopic acuity (0.086 deg) is better than what has been reported for adults of most species, and acuity in adult M. atlanticus reported here (0.014 deg) is substantially better than that reported for even large pelagic species such as tuna (0.03 deg). This level of visual acuity in M. atlanticus occurs because of the very large eyes and lens diameter—features that enhance retinal illumination.
Conclusions
In conclusion, the new data presented here show that the scotopic visual system is well developed at all stages of M. atlanticus, from premetamorphic larva through adult. The rod-dominated retina of larval M. atlanticus differs from the cone-dominated retinas of most other known teleosts, and as tarpon mature through the juvenile and adult stages, additional specializations develop in the scotopic system (substantial reflective tapetum, stacking and bundling of rod cells, large eye diameter, high GC:rod summation ratios) that increase the sensitivity of the retina to light. Taken together, the M. atlanticus visual system seems to be well adapted for vision at night and in low-light conditions, becoming more sensitive with maturity.
Based on the presence of cone cells in only a very small percentage of the retina found here in larval M. atlanticus, the photopic system does not seem to be as well developed as in most other species of teleost larvae that have cone-dominated retinas. Cone cells become more abundant and diverse after settlement and through the juvenile stage but become exceptionally diverse at the adult stage as fish move back into clearer coastal and oceanic waters.
The overall pattern of retinal development in M. atlanticus indicates clear regional and scotopic versus photopic specializations at earlier developmental stages but less specialization and greater enhancement of both systems as fish mature into adults. Large eyes and lens diameter in adults allow for illumination of high densities of rod and cone cells for a given visual angle, which requires less specialization and competition for retinal space among different photoreceptor types. Adult M. atlanticus are versatile and benefit from this well-developed visual system in their diurnal and nocturnal feeding patterns, small-scale migrations between turbid estuaries and clearer coastal waters, and larger scale feeding and spawning migrations among different water types. The presence of a diverse array of cone cell spectral classes, including cones that absorb maximally in the UV range, might reflect this versatility by providing a visual system that can function well under a variety of photic conditions.
Acknowledgments
Drs. Jonathan Shenker, Matthew Scripter, and Bronson Nagareda, Florida Institute of Technology, provided substantial expertise and assistance with the collection of specimens for this research. Dr. Robert Cowen and crew, University of Miami, RSMAS, allowed the collection of leptocephalus larvae aboard their vessel and provided equipment and expertise to make this possible. Cornell University allowed the use of microspectrophotometry equipment and supplies for MSP analyses. W.J. DeGrip, University of Nijmegen, Nijmegen, The Netherlands, graciously donated CERN primary antisera for the immunofluorescence work. Drs. Charles Bostater, Jonathan Shenker, David Carroll, and John Morris, Florida Institute of Technology, provided important intellectual contributions to this research.