INTRODUCTION
The bovine lungworm Dictyocaulus viviparus causes severe parasitic bronchitis in cattle. The infection commences with the oral ingestion of herbage contaminated with third-stage larvae (L3). The L3s penetrate the intestinal wall and moult to the fourth- and fifth-stage larvae (L4 and L5, respectively) during the migration via the mesenteric lymph nodes to the lung. In the lungs, the worms reach the adult stage and the females start producing eggs. The eggs are re-ingested and shed as first-stage larvae (L1) into the environment where they develop into L3, completing the life-cycle. The clinical signs are caused by inflammatory reactions in the lung that block the airways and cause a collapse of the alveoli, resulting in emphysema and oedema which manifest themselves as coughing and dyspnea. A vaccine consisting of irradiated, attenuated L3 (Huskvac, Intervet) is available and provides short-lived immunity.
During natural infection, the host generates a protective immune response against D. viviparus. Protection can be mimicked via the passive transfer of serum from immune to susceptible cattle (Jarrett et al. 1955), indicating that humoral immunity is sufficient to confer protection. It has been suggested that, during a naturally acquired infection, 2 types of immunity arise, one of which is effective against larvae which have not yet entered the lungs and another which protects against the adult stages developing in the lungs (Michel and Mackenzie, 1965). The protective response against the larval stages evolves within 11 days post-infection (Michel, 1962) and is short-lived, lasting for less than 6 months. The development of the protective response against lung stages takes up to 3 months and lasts for at least 27 months. Consistent with these observations, vaccination with irradiated L3 induces protection only against the larval stage, whereas experimental infection with non-irradiated L3 (which develop into adults) induces both types of immunity (Michel and Mackenzie, 1965). This information suggests important differences in the antigen composition and/or elicited immune response between the L3 and adult stages of D. viviparus.
Studies aimed at identifying the molecular basis of the short-term or long-term protection against D. viviparus have long been focused on finding correlations between protection and cytokine levels (Johnson et al. 2005) or local and/or systemic parasite-specific IgA, IgE, IgG1, IgG2 and IgM responses (McKeand et al. 1996; Scott et al. 1996; Kooyman et al. 2002). Except for good correlations with total IgE levels, this approach has not yielded the desired outcome, probably because of the use of variable, crude antigen preparations, differences in infection protocols between experiments and/or heterogeneity in the immune response of cattle.
Certain proteins of D. viviparus are known to induce a strong antibody response. The secreted enzyme, acetylcholinesterase (AChE), has been demonstrated to be a target for circulating antibody in infected calves (McKeand et al. 1994) and the immunization with AChE resulted in protection in guinea pigs (McKeand et al. 1995) but not in cattle (Matthews et al. 2001). Infected calves also recognize the native and recombinant polyprotein DvA-1 (Britton et al. 1995), but its involvement in the protective response is not known. Thus, the nature of the protection-inducing larval and/or adult antigens during infection still remains to be defined.
In the present study, we compared the protein composition of 2 different extracts from D. viviparus, a total protein extract of L3 and excretory/secretory (ES) product of adult worms, focusing on possible variation in protein glycosylation, as glycosylated proteins are increasingly recognized as major antigens and/or important modulators of host immune responses (Khoo and Dell, 2001; Thomas and Harn, 2004; Hein and Harrison, 2005).
MATERIALS AND METHODS
Parasite extracts
Adult D. viviparus were collected at 35 days of infection, as described previously (Eysker et al. 1990). Worms were washed several times in phosphate-buffered saline (pH 7·2; PBS) to minimize contamination with host components. ES products were prepared as described for Haemonchus contortus (see Schallig et al. 1994), except that ES was precipitated with 10% trichloroacetic acid, washed twice with acetone and then dissolved in 8 M urea and 10 mM Tris (pH 7·4). L3 were harvested from faecal cultures kept for 1 week at 15 °C, cleared from debris by centrifugation on a sugar cushion (Eysker and Kooyman, 1993), washed with water, and then stored at −80 °C until needed. An extract of L3 was prepared by homogenizing larvae in a small, electric glass mortar in extraction buffer (8 M urea, complete protease inhibitors (Roche, Germany), 10 mM Tris-HCl, pH 7·4). The suspension was centrifuged for 20 min at 4 °C, the pellet was discarded and the protein content of the supernatant determined using a standard assay (Bradford, 1976).
Deglycosylation of glycoproteins
Protein deglycosylation in solution was carried out by diluting 200 μg of ES or L3 extract kept in 8 M urea and 10 mM Tris, pH 7·4 in 4 volumes of 50 mM K2HPO4, 25 mM EDTA (pH 7·0) in distilled water. Sodium dodecyl-sulphate (SDS) was added to a final concentration of 0·1%. Samples were boiled for 5 min, and 10% Triton X-100 was added to a final concentration of 1%. After cooling the samples to room temperature, (22–24 °C), 1 μl (=1 U) of recombinant peptide-N-glycosidase F (PNGase F, Roche, Germany) was added per 10 μg of protein. Deglycosylation was allowed to proceed overnight at 37 °C and terminated by freezing at −20 °C. Mock-treated samples were incubated simultaneously in all cases. An isolate enriched for the immunogenic and non-glycosylated major sperm protein (MSP) of D. viviparus (see Schnieder, 1993) was also PNGase F-, and mock-treated to verify that PNGase F treatment did not change peptides or peptide epitopes.
Protein deglycosylation was also carried out on proteins which were blotted to nitrocellulose after electrophoresis (see below). Deglycosylation was performed as described, except that the boiling step was omitted and that 10 times more PNGase F was used (1 μl per 1 μg protein). The treatment was terminated by washing the blot several times with PBS. Mock-treated samples were incubated simultaneously in all cases. Staining of the proteins on the blots (before and after treatment) was performed using Direct Blue 71 (DB71, Sigma-Aldrich, USA), to verify that there was no loss of protein binding by the PNGase F treatment.
Detection of glycosylation
Before or after deglycosylation, antigen extracts were separated on 10% SDS-PAGE gels (7·5 μg protein/lane). Glycoproteins were stained employing the Pro-Q Emerald 300 glycoprotein gel and blot stain kit (Molecular Probes, USA) according to the manufacturer's instructions. Ovalbumin was used as a positive control. After staining, the same gel was stained with silver to detect proteins.
Enzyme-linked immunosorbent assay (ELISA)
The ELISA using ES or L3 extracts as antigens was performed as described previously (Kooyman et al. 2002). Deglycosylated and glycosylated ES or L3 antigens were coated at 2 μg/ml. In order to test parasite-specific IgE levels, it was necessary to purify IgE from serum using immobilized anti-IgE. Eluted IgE was collected in PBS with 0·1% gelatine and 0·05% Tween 20 (PBS-GT). The volume of PBS-GT was the same as that of the serum from which the IgE was purified and the elution was used undiluted in the ELISA. The recovery of IgE was verified using the ELISA and the yield was consistently greater than 90%. After testing several serum dilutions, 1/1000 was shown to be optimal for testing the other immunoglobulin isotypes. Anti-IgG1 (mca 627, Serotec, 1/1000 dilution), anti-IgG2 (mca 626, Serotec, 1/1000 dilution), IgA (mca 628, Serotec, 1/1000 dilution) and rabbit anti-IgM (ICN, 1/2000 dilution) were used as isotype-specific antibodies. Conjugates (goat anti-mouse/alkaline phosphatase and goat anti-rabbit/alkaline phosphatase, DAKO) were used at a dilution of 1/2000. The substrate p-nitrophenyl phosphate (pNPP, Pierce, USA) was used. Reactions were allowed to develop for 2 h (IgG1, IgG2 and IgM) or overnight (IgE and IgA). All samples were tested in duplicate, and positive and negative controls were included on each plate. Absorbance values were measured at a wave-length of 405 nm and expressed as optical density (OD405). Plate-to-plate variation was consistently less than 10%.
SDS-PAGE and Western blotting
Electrophoresis (10% polyacrylamide gels) and immunoblotting were carried out as described previously (Kooyman et al. 2002) with some minor modifications. For all gels, 7·5 μg antigen was loaded into each lane. Molecular weight markers (Amersham Pharmacia Biotech Inc, USA) used were 94 kDa (phosphorylase b), 67 kDa (albumin), 43 kDa (ovalbumin), 30 kDa (carbonic anhydrase) and 20 kDa (trypsin inhibitor). Following the transfer, proteins were stained with Direct Blue 71. After destaining, blots were incubated successively with cattle sera (1/1000 dilution), anti-IgG1 (1/1000 dilution) and alkaline phosphate-conjugated goat anti-mouse immunoglobulin (1/2000 dilution). Immune-reactive bands were detected with 5-bromo-4-chloro-3-indolyl phosphate (BCIP) and nitroblue tetrazolium (NBT) (both from Sigma-Aldrich, USA).
Sera from infected calves
Serum from blood from infected calves was prepared as described previously (Höglund et al. 2003). For the experimental infection experiment, helminth-free (Swedish Red and White Breed) calves were allocated to a primary infection group (n=5) and a challenge control group (n=6). The primary infection group received 100 D. viviparus L3s for 5 consecutive days, commencing at day 0. At day 73, all calves were challenged with 1500 L3s. At day 101, all cattle were euthanized and worms were recovered from the lungs and counted. Worm counts after the challenge infection were significantly greater in the challenged control group (mean: 355, range: 168–520) than in the group previously infected (mean: 13, range: 9–23) (P<0·0001), indicating that the primary infection induced protection against the succeeding challenge infection.
Sera from vaccinated calves
Serum from blood from vaccinated calves was prepared as described previously by Johnson et al. (2003). For the vaccination experiment, parasite-free raised Friesian-cross dairy calves were allocated to 2 groups. One group (n=6) was vaccinated with Huskvac® (Intervet, UK) at days 0 and 28, according to the manufacturer's recommendation; the other group (n=6) was not. At day 42, both groups were challenged with 700 L3 and slaughtered at day 77. No adult worms were found in the vaccinated calves, whereas a mean of 22 worms was recovered from the non-vaccinated calves, indicating that vaccination induced protection against a succeeding challenge infection.
Statistical analysis
Wilcoxon Signed Ranks test was used for paired samples (ELISA results before and after PNGase F treatment of the same group) and Mann-Whitney test was used for unpaired observations (ELISA results of re-infected and challenged control groups using the same antigen). For all analyses, the SPSS (version 10.01.0) software package was used.
RESULTS
Glycosylation of ES products from adult D. viviparus
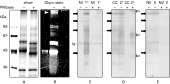
To assess the extent of protein glycosylation in D. viviparus, ES products from adult worms were subjected to SDS-PAGE and Emerald 300 staining. This analysis yielded 2 major doublets of 57 and 43 kDa, 3 bands of about 90 kDa and 1 band with a molecular mass of ~200 kDa (Fig. 1B). Subsequent silver staining of the same gel to detect all proteins in the ES revealed 2 additional bands below 30 kDa not detected by Emerald glycan staining (Fig. 1A). Comparison of the Emerald and silver staining of glycosylated ovalbumin and the non-glycosylated molecular weight markers confirmed the validity of the glycoprotein staining procedure (Fig. 1A and B).

Fig. 1. SDS-PAGE of mock (−) or PNGase F treated (+) ES (7.5 μg/lane) stained with (A) silver, (B) Emerald 300 glycoprotein stain, or (C, D, E,) subjected to immunoblotting. (A, B) Note that only the glycosylated molecular weight marker (ovalbumin, 43 kDa, left lanes) reacted positively with the glycan stain. A white arrowhead indicates the ~200 kDa glycoprotein. (C) Reactivity of IgG1 from pooled serum from non-infected controls (NI) or primary infected (53-days) calves (1 °). Black arrows indicate most predominant putative glycoproteins carrying immunodominant N-glycans, not detected after PNGase F treatment (+). Ig indicates possible contamination with host immunoglobulins. (D) Reactivity of IgG1 from pooled serum from challenge control (CC) and re-infected calves (2 °) obtained at 28 days after challenge. Open arrows point to protein bands in ES/PNGase that are recognized by IgG1 from re-infected animals after challenge. (E) Reactivity of IgG1 from pooled serum from non-vaccinated control (NV) and vaccinated animals (V) obtained at 28 days after challenge infection.
To learn more about the nature of the protein glycosylation, ES extracts were treated with PNGase F prior to electrophoresis. This glycosidase enables the discrimination between O-linked and N-linked glycosylation by specific cleavage of N-linked glycans which lack a core α1→3 linked fucosyl group. After PNGase F treatment, electrophoresed ES components were not stained with Emerald 300 (Fig. 1B), indicating that the proteins carried only N-linked glycans. When stained with silver (Fig. 1A), an apparent shift of most of the deglycosylated proteins to a lower molecular weight was evident. The components of 90, 57 and 43 kDa migrated in the deglycosylated forms as single bands of 83, 55 and 42 kDa, respectively, whereas the glycan-negative components of less than 30 kDa did not change in molecular weight after PNGase F treatment. The ~200 kDa glycoform was not detectable after deglycosylation.
Glycosylation of L3 protein extract
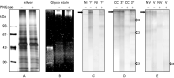
Emerald 300 staining of L3 extracts yielded only one major, rather diffuse glycoprotein band of ~200 kDa (Fig. 2B). Subsequent silver staining revealed numerous, non-glycosylated proteins (Fig. 2A). Based on the relative intensities of the silver staining, the glycoprotein detected was of a relatively low abundance. PNGase F treatment of L3 extract resulted only in a slightly less intense Emerald 300 staining and a small decrease in the weight of the high molecular weight glycoprotein (Fig. 2B). This finding may indicate that not all attached carbohydrates are N-linked and/or that part of the N-linked oligosaccharide carries a core α1→3 linked fucose. The specificity of the effect was demonstrated by the unaltered migration of the Emerald 300-negative L3 proteins after PNGase F treatment (Fig. 2).

Fig. 2. SDS-PAGE of mock (−) or PNGase F treated (+) L3 total protein extract (7.5 μg/lane) stained with (A) silver, (B) Emerald 300 glycoprotein stain, or (C, D, E) subjected to immunoblotting. (A, B) Note that only the glycosylated molecular weight marker (ovalbumin, 43 kDa, left lanes) reacted positively with the glycan stain. (C) Reactivity of IgG1 from pooled serum from non-infected controls (NI) or primary infected (53-days) calves (1 °). The black arrow indicates a putative glycoprotein carrying immunodominant N-glycans, not detected after PNGase F treatment (+). (D) Reactivity of IgG1 from pooled serum from challenge control (CC) and re-infected calves (2 °) obtained at 28 days after challenge. Open arrows point to protein bands that are recognized by IgG1 from re-infected animals after challenge after L3/PNGase treatment. (E) Reactivity of IgG1 from pooled serum from non-vaccinated control (NV) and vaccinated animals (V) obtained at 28 days after challenge infection. The open arrow indicates immune reactivity noted for vaccinated animals only.
Immunogenicity of the ES and L3 glycoproteins in calves with primary D. viviparus infection
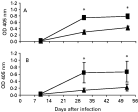
The ELISA was used to investigate the contribution of the glycosylation to the antibody responses against D. viviparus ES and L3 during a primary infection. Testing of the IgG1 response, which is the most prominent antibody isotype in lungworm infections (Scott et al. 1996; Kooyman et al. 2002), revealed strong reactivity to both ES and L3 antigens. This reactivity was reduced significantly after PNGase F treatment (Fig. 3).

Fig. 3. ELISA showing the immunoreactivity of serum IgG1 from primary infected animals with (A) ES or ES/PNGase and (B) L3 or L3/PNGase antigen. Note that the signal for ES and L3 ([squf ]) was higher than for ES/PNGase and L3/PNGase ([utrif ]), respectively. On days marked with * this difference was significant (P<0.05). Non-infected control animals remained negative and are not shown. Results are given as mean OD405 +/−S.E.M.
To identify the glycoproteins which contributed to the immune response, the reactivity of IgG1 in the sera from infected calves were analysed by Western blotting. As shown in Fig. 1C, multiple ES bands reacted with the IgG1 fraction. Some immune-reactive (glyco)proteins stained poorly with silver or Emerald 300, indicating that they were of low abundance but were immunogenic. Sera from naive animals reacted exclusively with a 55 kDa band. Control experiments showed that this 55 kDa protein also reacted with rabbit anti-bovine IgG (data not shown) and, therefore, most likely represented the heavy chain of host immunoglobulin which had remained bound to ES during isolation. To investigate the contribution of N-glycans to the observed ES immune-reactivity, the blots were treated with PNGase F. This treatment resulted in a strong reduction in IgG1 reactivity with most of the immune-reactive proteins, indicating that carbohydrate moieties were the major antigenic components recognized by the immune sera (Fig. 1C).
Similar Western blot analysis of the L3 fraction showed strong reactivity of the immune sera with the high molecular weight glycoprotein. This reactivity was not present after PNGase F treatment (Fig. 2C). The reduced immune-reactivity against PNGase F treated ES and L3 was not caused by a loss of bound protein from the blot during treatment, as protein staining with DB 71 after PNGase F- or mock-treatment yielded similar results (not shown). Together, the results indicate that the parasite derived N-glycan moieties are immunodominant antigens during primary infection.
Effect of re-infection of calves with D. viviparus on the immune response
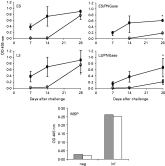
To further establish whether the N-glycans elicited a short-term or long-term memory response, we compared the IgG1 responses of re-infected calves (primary infection followed by challenge) with those of calves with a primary infection (challenge control). ELISA testing revealed that challenge infection elicited an antibody response, against both ES and L3 antigens (Fig. 4). Seven days after challenge, the IgG1 levels for the re-infected animals were higher than for the challenge controls due to ‘residual antibodies’ elicited by the first infection. Twenty eight days after challenge, the sera from both groups showed comparable immune-reactivity. Assessment of the immune response to PNGase F-treated ES or L3 antigen revealed a reduced response for both groups of calves, indicating the presence of N-glycan specific IgG1 both after primary infection and re-infection. Also, these experiments showed a significantly (P<0·01) higher response to the deglycosylated proteins in the re-infected group compared with the challenge control group, suggesting that the protein backbone rather than the attached N-glycans elicits a booster response. Control experiments with MSP as an antigen showed that PNGase F treatment did not affect its reactivity with IgG1 from re-infected calves (Fig. 4). Thus, PNGase F did not destroy the peptide epitopes.

Fig. 4. ELISA showing the reactivity of serum IgG1 from re-infected ([bull ]) and challenge control calves (○) after challenge infection with ES, L3 and the respective deglycosylated antigens (ES/PNGase and L3/PNGase, respectively). Note the lower signal for both ES and L3 in both groups after PNGase F treatment. * At day 28 re-infected animals showed a significantly (P<0.01) better response to deglycosylated antigens than the challenge control animals. Results are given as mean OD405 +/− S.E.M. Reactivity of serum IgG1 from negative and re-infected calves towards a non-glycosylated protein (MSP) was the same before (filled bars) and after PNGase F treatment (open bars), indicating that PNGase F treatment did not change peptide epitopes.
Western blotting confirmed the ELISA results. Similar responses to ES for both groups at day 28 post-challenge as well as the booster response against the peptide backbone in the re-infected group were found on blots (Fig. 1D). For L3, the sera from the re-infected animals yielded additional immune-reactive bands compared with the challenge controls. This booster effect was particularly evident after PNGase F treatment (Fig. 2D), indicating the existence of a booster response to the protein backbone of distinct L3 antigens. These data suggest that N-glycans elicit an IgG1 response both during the primary infection and during re-infection, whereas only the protein backbone elicits a memory response.
Isotype specificity of the immune response
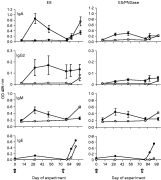
Since the effector's function of an antibody is isotype-dependent, we also compared the N-glycan-specific IgA, IgE, IgG2 and IgM antibody reactivities in sera from re-infected calves with those of calves with primary infection (Fig. 5). All immunoglobulin isotypes tested for both groups of calves reacted with ES antigens. PNGase F treatment of the antigens resulted in a much lower response for all isotypes, except for IgM, suggesting that the N-glycan response was not restricted to a distinct isotype.

Fig. 5. ELISA showing the IgA, IgG2, IgM and IgE isotype response of re-infected ([bull ]) and challenge control animals (○) towards ES (left column) and deglycosylated ES (ES/PNGase, right column). Arrows indicate the time of the primary (filled arrows) and challenge infection (open arrows). Results are given as mean OD405 +/− S.E.M., except for IgE for which serum was pooled per group per date.
Analysis of the response for isotype specificity (other than IgG1) showed that deglycosylated ES only boosted the IgE response. For deglycosylated L3, none of the (non-IgG1) isotypes showed an enhanced response towards the protein backbone (not shown). Thus, N-glycans appear to elicit a broad isotype response, whereas only the protein-specific IgG1 and IgE responses are boosted after re-infection.
Effect of vaccination on the N-glycan and protein-specific immune response
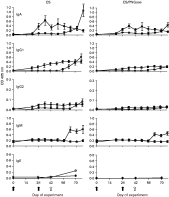
The apparent rapid induction of a short-lived memory response against N-glycans but of a long-term response against protein epitopes upon re-infection with D. viviparus led us to investigate the effect of vaccination on the immune response against these antigens. ELISA testing demonstrated that vaccination induced a specific serum IgA, IgG1 and IgG2 responses against ES, whereas IgM and IgE levels remained low (Fig. 6). The IgA response after vaccination was similar to the IgA response in infected calves, whereas the IgG1 and IgG2 responses were much lower in the vaccinated calves.

Fig. 6. ELISA demonstrating the IgA, IgG1, IgG2, IgM and IgE Isotype response of vaccinated ([bull ]) and challenge control animals (○) towards ES (left column) and deglycosylated ES (ES/PNGase, right column). Arrows indicate the time of vaccination (black arrow) and challenge infection (open arrow). Results are given as mean OD405 +/− S.E.M., except for IgE for which serum was pooled per group per date.
After the treatment of the antigens with PNGase F, IgA, IgG1 and IgG2 reactivities towards the deglycosylated antigens was much lower than to the non-deglycosylated ES antigens. Also, challenge infection after vaccination did not boost ES-specific IgG1 or IgE (Fig. 6). Western blot analysis of ES (Fig. 1E) and L3 (Fig. 2E) with IgG1 from sera from vaccinated calves (28 days after challenge) confirmed that the vaccine-induced immune response was mainly directed against the N-glycans and not against the peptide backbone, as the bands were not detected after PGNase F treatment (except for a diffuse band of 20–25 kDa, Fig. 2E). These results may explain the short-lived protection which typifies the protective effect using the current vaccine.
DISCUSSION
In this study, evidence is presented that multiple D. viviparus proteins are ‘decorated’ with N-glycan moieties and that the glycosylation is a crucial determinant of the nature of the immune response in cattle after natural infection with and vaccination against D. viviparus. The N-glycan moieties carried immunodominant epitopes which failed to elicit a memory response, in contrast to the protein backbone. This finding may explain the short-lived memory induced by the natural infection or vaccination.
Thus far, glycosylation in D. viviparus has not gained much attention. More than a decade ago, Britton et al. (1993) used several techniques to study glycosylation in adult ES products and successfully identified a 42 kDa glycoprotein, while a structural study (Haslam et al. 2000) reported the presence of complex glycans with Lewisx antennae in detergent extracts of homogenized worms without further identification of the protein backbone. The conclusion from the present study that D. viviparus carries a ‘protein glycosylation machinery’ was based on both the specific staining of multiple proteins for glycans and the altered electrophoretic mobility of these proteins after treatment with the glycosidase PNGase F. The finding that treatment of adult ES with PNGase F resulted in complete deglycosylation of most of the glycoproteins indicates that most ES proteins carry N-glycans without a core α1→3 fucosylation and lack O-linked carbohydrate moieties. In the total protein extract from L3, a single glycoprotein was identified that was incompletely deglycosylated upon PNGase F treatment. The differences in glycoprotein content between ES and L3 extracts may reflect differences between the developmental stages, but may also result from the use of different fractions (soluble ES products of the adult stage versus total protein extract for L3). The immune-reactivity of sera from infected calves against D. viviparus extracts suggested that all glycoproteins except one (~55 kDa protein present in the ES fraction) were newly identified glycoproteins of parasite origin and not contaminating host glycoproteins. At this point, it should be noted that, due to the 10% polyacrylamide gel used, glycosylation of additional proteins of <20 kDa cannot be excluded.
The present findings indicate that the glycosylation of D. viviparus proteins has a significant effect on the host immune response against the parasite. Comparison of the immunoreactivity of antigens before and after deglycosylation using sera from calves with primary infection clearly demonstrated a strong reduction in the immunoreactivity of all but one of the immunoglobulin isotypes (i.e. IgA, IgE, IgG1, IgG2 and IgM) tested against the deglycosylated antigens, whereas no effect was detected using the MSP control protein. These data suggest that the glycans largely contribute to the immunogenicity of the parasite and that they contain immunodominant epitopes. These findings seem to deviate from the data published by Britton et al. (1993), who showed that the presence of N-glycans on the 42 kDa glycoprotein (identified by them) did not influence the immunoreactivity. This difference may be explained by their use of lower serum dilutions (1/20) and/or a different assay (immunoprecipitation) in which the antigen rather than the antibodies may become limiting. The use of low serum dilutions has also been suggested as a limitation in the detection of carbohydrate-specific antibodies in mice infected with the blood-fluke Schistosoma mansoni (see Richter et al. 1996). Another difference between the 2 methods is the use of proteins in the native state in the study of Britton et al. (1993) compared with denatured proteins in the present study, although we consider it unlikely that the denaturation procedure would change the recognition of the N-glycans.
Interestingly, the binding of IgM was hardly affected by deglycosylation of ES or L3 extract. In Schistosoma-infected mice (Richter et al. 1996) and chimpanzees (Eberl et al. 2001) as well as after infection with other nematodes, IgM is mainly directed against carbohydrates. H. contortus infected sheep, for example, elicit a strong IgM response against periodate-sensitive carbohydrate epitopes, such as fucosylated LacdiNAc (LDNF) (Vervelde et al. 2003). Only later in infection, the IgM levels decrease and class-switching to IgG1 occurs. This IgM response may be directed against the core fucosylated groups present in many schistosome glycans and LDNF (Nyame et al. 2000; Eberl et al. 2001). Treatment of lungworm ES products with PNGase F removed N-linked glycans, demonstrating that this fraction does not contain core 1→3 fucosylated N-glycans.
Perhaps the most striking finding in the present study was the presence of a booster response against the protein backbone but not against the attached glycans after re-infection. This finding strongly suggests that the glycans, although immunodominant, are unable to induce a memory response. This response against deglycosylated ES antigen was observed for both IgG1 and IgE, but not for IgA or IgG2. Since the re-infected group, but not the challenge control group, was protected against challenge infection, this finding may indicate that IgG1 and/or IgE, but not the other isotypes, play a role in achieving long-lasting protection. The precise nature of the antigens which induce the protective immune response remains to be defined. The primary immune-reactive component recognized by IgG1 from re-infected calves, but not from primary infected or vaccinated calves, was a 67 kDa protein in deglycosylated ES. A D. viviparus protein of this size has been identified previously as an acetylcholine esterase (AChE) (McKeand et al. 1995). Interestingly, this protein elicits a strong immune response in infected, but not in vaccinated calves (McKeand et al. 1994). Also, AChE of D. viviparus has at least 2 potential N-glycosylation sites (Lazari et al. 2004), but immune sera from re-infected cattle recognize recombinant (non-glycosylated) AChE, indicating that the protein backbone is immunogenic (Matthews et al. 2001). As the immunization with a fraction enriched for AChE confers protection to guinea pigs (McKeand et al. 1995), it is tempting to speculate that the immunodominant 67 kDa protein identified in the present study is AChE. For L3, several (glyco)protein bands reacted strongly and exclusively with the immune sera from the re-infected calves. These signals were enhanced after PNGase F treatment, indicating that the booster response was primarily directed against the peptide backbone. The identity of these proteins remains to be defined.
Vaccination against D. viviparus is known to provide only short-term protection (Michel and Mackenzie, 1965). In the present study, vaccination resulted in ES and L3 N-glycan-specific IgA, IgG1 and IgG2 antibody responses. Challenge infection of vaccinated calves did not boost the IgG1 or IgE immune-reactivity towards the deglycosylated antigens as was observed for calves with a primary infection, probably because the calves are not exposed to adult ES in the lungs due to the presence of circulating N-glycan specific antibodies. The difference in booster response between the infected and vaccinated calves may explain the parasitological observations that vaccination yielded a short-lived (<6 months) protection against larvae arriving in the lung, whereas a long-term protection (for at least 27 months) was only obtained after infection (Michel and Mackenzie, 1965).
Based on the present results and previous observations, a scenario for the development of immunity against D. viviparus can be envisioned in which long-lasting immunity against the lung stages is caused by a memory response (Th2) involving specific IgG1 and/or IgE antibodies directed to the peptide backbone of certain parasite products. The short-lived immunity against re-infection can be explained by the presence of mainly anti-N-glycan specific antibodies of different isotypes (elicited via a primary infection or vaccination) which are still circulating at the time of challenge. The fact that this short-lived immunity can be demonstrated already during a challenge infection (11 days after primary infection) (Michel, 1962) is typical for a carbohydrate (thymus-independent) antigen response not requiring priming and clonal expansion of T-cells but lacking memory (Janeway et al. 2005). The hypothesis that the inclusion of deglycosylated ES antigen into a vaccine may result in long-lasting immunity awaits further testing.
The infection and vaccination experiments were approved by the ethical committees of Sweden and New Zealand. Dr Marion Johnson from AgResearch, Invermay Agricultural Centre, New Zealand kindly provided the sera from the vaccination experiment.