Introduction
Emergency physicians managing patients with suspected infectious diseases must select diagnostic testing strategies that influence both clinical decisions and overall emergency department (ED) throughput. Reference Badr, Nyce, Awan, Cortes, Mowdawalla and Rachoin1,Reference Morley, Unwin, Peterson, Stankovich and Kinsman2 Crowding in the ED and prolonged length-of-stay (LOS) are long-standing challenges that were markedly intensified during the coronavirus disease 2019 (COVID-19) pandemic. Reference Dui, Liu and Wu3 Extended LOS has repeatedly been associated with increased mortality, treatment delays, and reduced patient satisfaction. Reference Warren, Campbell and Nestler4–Reference Al-Shareef, Al Jabarti, Babkair, Jamajom, Bakhsh and Aga7 During the pandemic, emergency physicians were required to maintain rapid triage and treatment while meeting heightened infection control demands. Reference Dui, Liu and Wu3
The COVID-19 pandemic introduced major operational disruptions to ED systems. Reference Cilloni, Kendall, Dowdy and Arinaminpathy8,Reference Fanti, De Marco and Lorenzini9 Diagnostic screening protocols added complexity to routine workflows; isolation requirements restricted available space; and staffing demands increased due to additional point-of-care responsibilities. Reference Budd, Miller and Weckman10,Reference Arshadi, Fardsanei and Deihim11 These changes reshaped resource allocation within EDs and revealed the need for adaptive, capacity-aware operational strategies.
Two testing modalities were central to pandemic operations: rapid point-of-care lateral flow assays (LFAs) and laboratory-based polymerase chain reaction (PCR) testing. Reference Budd, Miller and Weckman10,Reference Chi, Chiu and Chen12,Reference Said, Afreen, Al-Wali, Al Kuwari, Kabir and Salem13 The two systems co-existed because neither alone met all clinical needs: LFA provided the speed essential for rapid triage and isolation decisions, whereas PCR provided the analytical sensitivity required for diagnostic confirmation and public health reporting. The modalities also differ substantially in the total clinical waiting interval from test order to actionable result — typically minutes for LFA performed at the bedside, and hours for PCR after sample transport and centralized laboratory processing. Although LFA provides rapid, bedside results and appears advantageous in principle, Reference Budd, Miller and Weckman10,Reference Said, Afreen, Al-Wali, Al Kuwari, Kabir and Salem13 its performance depends directly on ED personnel and physical space. By contrast, PCR relies on centralized laboratory infrastructure that functions independently of frontline operational pressures. Reference Feng, Newbigging and Le14 These distinct resource dependencies suggest that the relative operational performance of LFA and PCR may change as ED system stress fluctuates. Reference Mohtady Ali, Desha, Ranse and Roiko15
Resource Dependence Theory (RDT) provides a useful framework for interpreting these dynamics, positing that organizational performance depends on managing internal and external resource demands. Reference Cilloni, Kendall, Dowdy and Arinaminpathy8,Reference Hillman, Withers and Collins16 In this context, LFA draws on internal ED resources, while PCR depends primarily on external laboratory capacity. Understanding how these dependencies interact with real-time operational conditions is essential for optimizing testing strategies.
Existing research on COVID-19 diagnostics has focused largely on analytical accuracy—such as sensitivity, specificity, and clinical agreement Reference Budd, Miller and Weckman10,Reference Chi, Chiu and Chen12,Reference Said, Afreen, Al-Wali, Al Kuwari, Kabir and Salem13 —but provides limited insight into how testing choices affect ED workflow under varying capacity constraints. Meanwhile, advances in health care informatics have enabled real-time capacity monitoring, Reference Piliuk and Tomforde17,Reference Wang, Deng and Yuan18 yet these tools have not been translated into operational frameworks that guide testing strategy selection. This gap limits opportunities to strengthen emergency preparedness and improve clinical efficiency during future outbreaks. Reference Cilloni, Kendall, Dowdy and Arinaminpathy8,Reference Feng, Newbigging and Le14,Reference Mohtady Ali, Desha, Ranse and Roiko15
Turnaround time (TAT) plays a critical role in this operational context. In emergency medicine, TAT reflects not only laboratory processing time, but also broader system-wide pressures, including nursing availability, space constraints, and competing clinical demands. Reference Andersson, Nordgren, Cheng, Nilsson and Kurland5,Reference Kim, Seo and Kim6,Reference Samadbeik, Staib and Boyle19 Stable TAT suggests sufficient operational capacity to support point-of-care workflows, whereas prolonged TAT signals resource saturation that may diminish the practical advantages of rapid testing. Whether specific TAT-based thresholds can predict when the operational performance of LFA and PCR begins to diverge remains unknown.
This study addresses these gaps by examining how the relationship between testing modality and ED LOS varies across different levels of operational stress, using TAT as a real-time capacity indicator. Using data from a dual-testing implementation period in a high-volume tertiary ED, the study pursued three objectives:
-
1. Threshold Identification: Determine empirical capacity thresholds at which LFA and PCR performance diverges, using propensity score matching (PSM) to reduce patient-level confounding.
-
2. Performance Stability Analysis: Assess the reliability of each modality under increasing system stress by quantifying variability in LOS patterns.
-
3. Clinical Decision Support Framework: Translate findings into actionable recommendations for adaptive testing strategy selection using real-time capacity monitoring tools.
By identifying specific TAT-based thresholds that predict differential testing performance, this study offers emergency physicians evidence-based indicators to guide adaptive testing protocols during infectious disease outbreaks and other periods of heightened operational demand.
Methods
Study Design and Setting
This retrospective observational study was conducted in a high-volume tertiary ED with approximately 85,000 annual visits (mean 233 per day). The study period spanned January 1, 2019 through March 31, 2023, with the analytic dataset restricted to the dual-testing period (May 1, 2022 through March 31, 2023) when both LFA and PCR were concurrently available. Encounters with missing LOS or daily visit volume data were excluded. The resulting cohort underwent PSM for all subsequent analyses. Both LFA and PCR were deployed concurrently within the same ED throughout the study period. On any given shift, both testing modalities were managed by the clinical team on duty; there was no systematic assignment of specific teams or personnel to one modality over the other. Nursing and physician staffing followed a rostered schedule that was set in advance and was not dynamically adjusted to real-time patient volume.
Clinical and Operational Context
During the study period, the ED maintained a typical daily census of 200–250 patients. The diagnostic modality was selected by treating physicians according to clinical presentation, epidemiological considerations, and real-time operational constraints; the choice of test was therefore non-randomized. Three testing pathways were available: standard laboratory PCR, rapid PCR, and point-of-care LFA.
The LFA workflow required continuous ED nursing involvement for test execution, development (15–30 minutes), interpretation, and documentation. During periods of high workload, limited nursing availability could prolong operational TAT despite the assay’s rapid analytical runtime. In contrast, both standard and rapid PCR workflows relied on centralized laboratory processing. The ED nurses collected specimens, while the laboratory personnel executed all analytic steps, with results automatically integrated into the ED information system. All operational timestamps—including test ordering, result availability, and LOS—were extracted retrospectively from the electronic health record.
COVID-19 Testing Modalities
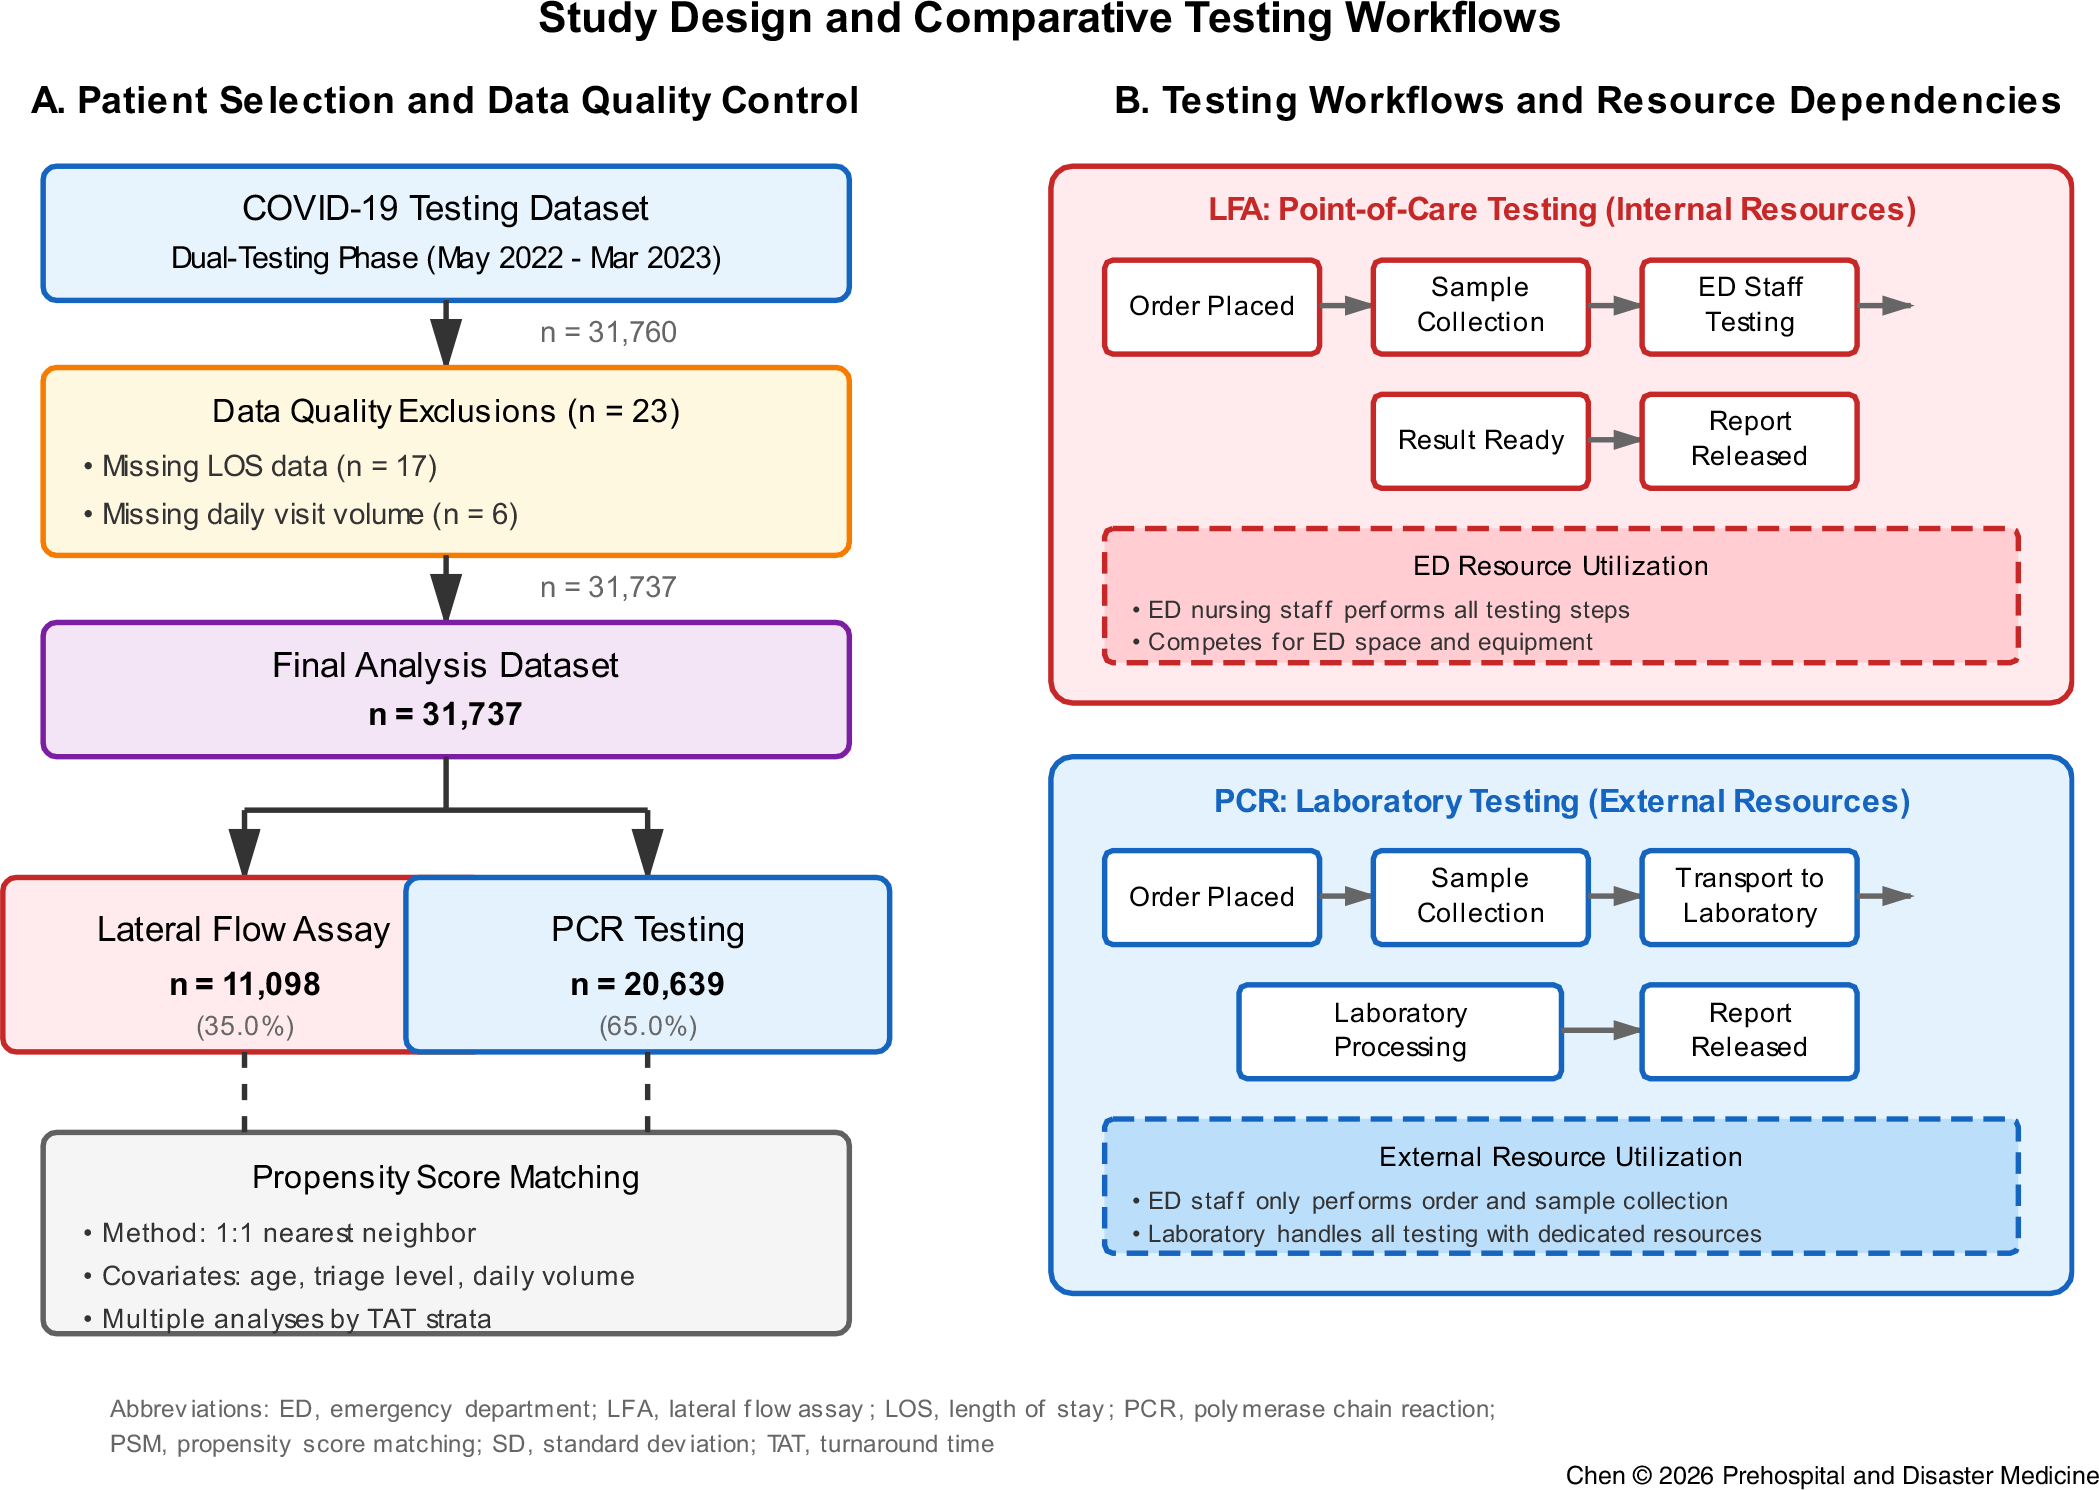
Standard PCR was performed using the Cobas 6800 system (Roche Diagnostics [Indianapolis, Indiana USA]; analytical time approximately 3.5 hours), rapid PCR using the Cobas Liat platform (Roche Diagnostics; analytical time approximately 20 minutes), and LFA using the FORA/V-TRUST antigen test (TaiDoc Technology [Taipei, Taiwan]; analytical time 15–30 minutes). Analytical runtimes reflect instrument-reported durations and do not correspond to operational TAT, which includes pre-analytic and post-analytic delays (Figure 1b).
Study Design and Operational Workflows for COVID-19 Testing Strategies.
(A) Flowchart showing case selection and data quality procedures. Of 31,760 tests performed during the dual-testing period (May 2022–March 2023), 31,737 met inclusion criteria after exclusion of 23 incomplete records. The analytic cohort comprised 11,098 LFA and 20,639 PCR tests, yielding 8,492 matched pairs after propensity score matching.
(B) Comparative workflow illustration of resource utilization. The LFA pathway reflects point-of-care testing within the emergency department requiring internal clinical resources, whereas the PCR pathway relies on external laboratory infrastructure and dedicated personnel. Dashed boxes indicate key resource dependencies that influence operational stability during surge conditions.
Abbreviations: ED, emergency department; LFA, lateral flow assay; LOS, length-of-stay; PCR, polymerase chain reaction; PSM, propensity score matching; TAT, turnaround time.

Figure 1. Long description
The flowchart is divided into two main sections: A and B. Section A, titled ‘Patient Selection and Data Quality Control,’ details the process of selecting COVID-19 testing data from May 2022 to March 2023. It starts with a dataset of 31,760 tests, excludes 23 records due to missing data, resulting in a final analysis dataset of 31,737 tests. This dataset is further divided into 11,098 lateral flow assay (LFA) tests and 20,639 polymerase chain reaction (PCR) tests. Propensity score matching is applied to yield 8,492 matched pairs. Section B, titled ‘Testing Workflows and Resource Dependencies,’ compares the workflows and resource utilization for LFA and PCR testing. The LFA pathway involves point-of-care testing within the emergency department (ED), requiring internal clinical resources. The PCR pathway relies on external laboratory infrastructure and dedicated personnel. The flowchart highlights the steps involved in each testing pathway, including order placement, sample collection, testing, and result reporting. It also indicates key resource dependencies that influence operational stability during surge conditions.
Outcome, Exposure, and Variables
The primary outcome was ED LOS, defined as the interval from arrival to departure (hours). The primary exposure was testing modality (LFA versus PCR); standard and rapid PCR were grouped because of their shared laboratory-dependent workflow. Turnaround time was defined as the interval from test order entry to result availability (minutes) and served as the primary operational capacity indicator. This order-to-result definition captures the full clinical waiting interval experienced by ED physicians, encompassing specimen collection, bedside labelling, transport (for PCR), assay performance, and result reporting. Pre-analytical and analytical phases are therefore included within the reported TAT rather than treated as separate components. Covariates included age, sex, triage acuity (Levels 1–2 versus Levels 3–5), and daily ED visit volume.
Propensity Score Matching (PSM)
To minimize confounding, 1:1 nearest-neighbor matching was performed using a 0.5 standard-deviation caliper on the logit of the propensity score. Reference Austin20 The propensity model included age, sex, triage acuity, and daily ED visit volume. Matching was performed without replacement. Covariate balance was assessed using standardized mean differences (SMD), with values < 0.10 indicating acceptable balance.
Threshold and Stratified Analyses
To examine non-linear and capacity-dependent patterns, TAT was categorized into clinically defined intervals (0–30, 31–60, 61–90, and >90 minutes) representing increasing operational stress. Within each stratum, differences in LOS between testing modalities were examined descriptively. These analyses were exploratory and intended to generate hypotheses regarding potential operational thresholds; results are therefore presented as effect estimates with unadjusted 95 percent confidence intervals (95% CI), without formal hypothesis testing.
Daily testing volume was additionally evaluated as a potential contributor to operational strain. Associations between daily test counts and median TAT were summarized descriptively, and exploratory stratified analyses examined whether modality-specific LOS patterns differed across pandemic phases characterized by varying operational pressures.
Performance Stability Analysis
To assess operational reliability across differing stress conditions, coefficients of variation (CV = SD/mean) for TAT were calculated for each modality across operational strata. The ratio of CVs (LFA CV/PCR CV) was computed to quantify relative variability, with 95% confidence intervals estimated using bootstrap re-sampling. Higher CV values were interpreted as indicating decreased predictability and reduced operational stability. These analyses were exploratory.
Statistical Methods
All analyses were performed using R version 4.4.3 (R Foundation for Statistical Computing; Vienna, Austria). Continuous variables were summarized as medians with interquartile ranges (IQR) and categorical variables as frequencies with percentages. Group comparisons for unmatched descriptive characteristics used the Wilcoxon rank-sum test and the chi-square or Fisher’s exact test, as appropriate. Propensity score matching was implemented using the MatchIt package.
The pre-specified primary analysis evaluated the association between testing modality and LOS in propensity-matched pairs using the Mann-Whitney U test (Wilcoxon rank-sum test), chosen because LOS was right-skewed. Only this primary comparison was subjected to formal hypothesis testing, with statistical significance defined as a two-sided probability value below 0.05.
All secondary and exploratory analyses—including stratified comparisons across TAT categories, operational pattern characterization, and LOS variability analyses—were considered hypothesis-generating. The widths of the 95% confidence intervals for these secondary and exploratory outcomes were not adjusted for multiplicity and therefore should not be interpreted as substitutes for hypothesis testing.
Ethics Approval
This study was approved by the Institutional Review Board of Taipei Veterans General Hospital (Taipei, Taiwan; IRB: 2024-12-007AC). All procedures performed in this study involving human participants were in accordance with the ethical standards of the institutional research committee and with the 1964 Helsinki Declaration and its later amendments. Due to the retrospective nature of this study, the requirement for individual informed consent was waived by the ethics committee.
Results
Patient Characteristics and Matching Outcomes
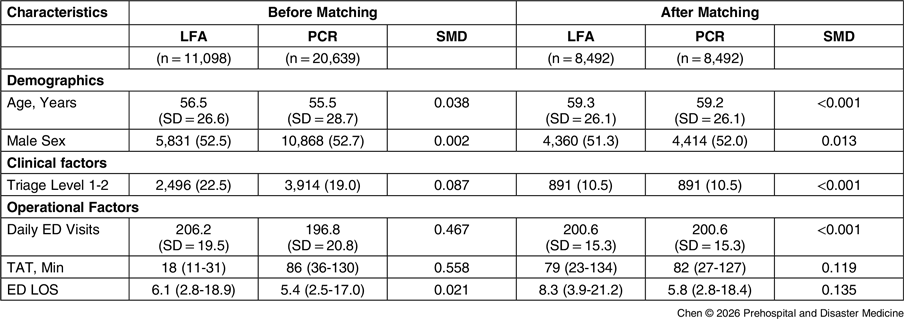
Of 322,282 ED encounters recorded from January 2019 through March 2023, a total of 31,760 involved COVID-19 testing during the dual-testing period (May 2022–March 2023). Twenty-three encounters were excluded due to missing LOS or daily visit volume data, yielding a final analytic cohort of 31,737 tests (11,098 LFA and 20,639 PCR; Figure 1a). Prior to matching, PCR was utilized more frequently during periods of lower ED census (SMD = 0.467) and was associated with longer operational TAT (median 86 versus 18 minutes; SMD = 0.558). Propensity score matching successfully generated 8,492 balanced pairs with negligible baseline differences across all matching covariates (SMDs <0.001; Table 1).
Baseline Characteristics and Operational Metrics Before and After Propensity Score Matching

Table 1. Long description
The table presents a comparison of baseline characteristics and operational metrics before and after propensity score matching. It includes demographics, clinical factors, and operational factors. The table has 8 rows and 7 columns, with headers for characteristics, before matching (LFA, PCR, SMD), and after matching (LFA, PCR, SMD). Key metrics include age, sex, triage level, daily ED visits, TAT in minutes, and ED length of stay. Notable trends show balanced pairs with negligible baseline differences after matching, with all SMDs less than 0.001.
Note: Data are presented as mean (standard deviation), median [interquartile range], or n (%). Propensity score matching was performed using 1:1 nearest-neighbor matching with a caliper of 0.5 SD (age, daily ED census, triage level). SMD <0.1 indicates acceptable covariate balance for baseline covariates.
Abbreviations: ED, emergency department; LFA, lateral flow assay; LOS, length-of-stay; PCR, polymerase chain reaction; SMD, standardized mean difference; TAT, turnaround time.
Notably, matching attenuated the residual difference in operational TAT (median 82 versus 79 minutes), implying that the initial TAT disparity was largely driven by workflow allocation rather than intrinsic patient complexity.
Primary Analysis
In the matched cohort, LFA was associated with a significantly longer median LOS compared to PCR (8.3 versus 5.8 hours; P < 0.001). This baseline disparity provided the foundation for subsequent stratified analyses focusing on operational stress.
Threshold-Dependent Performance Patterns
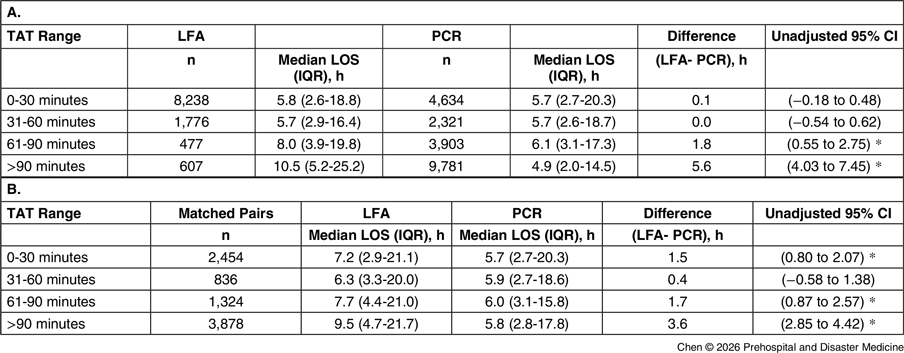
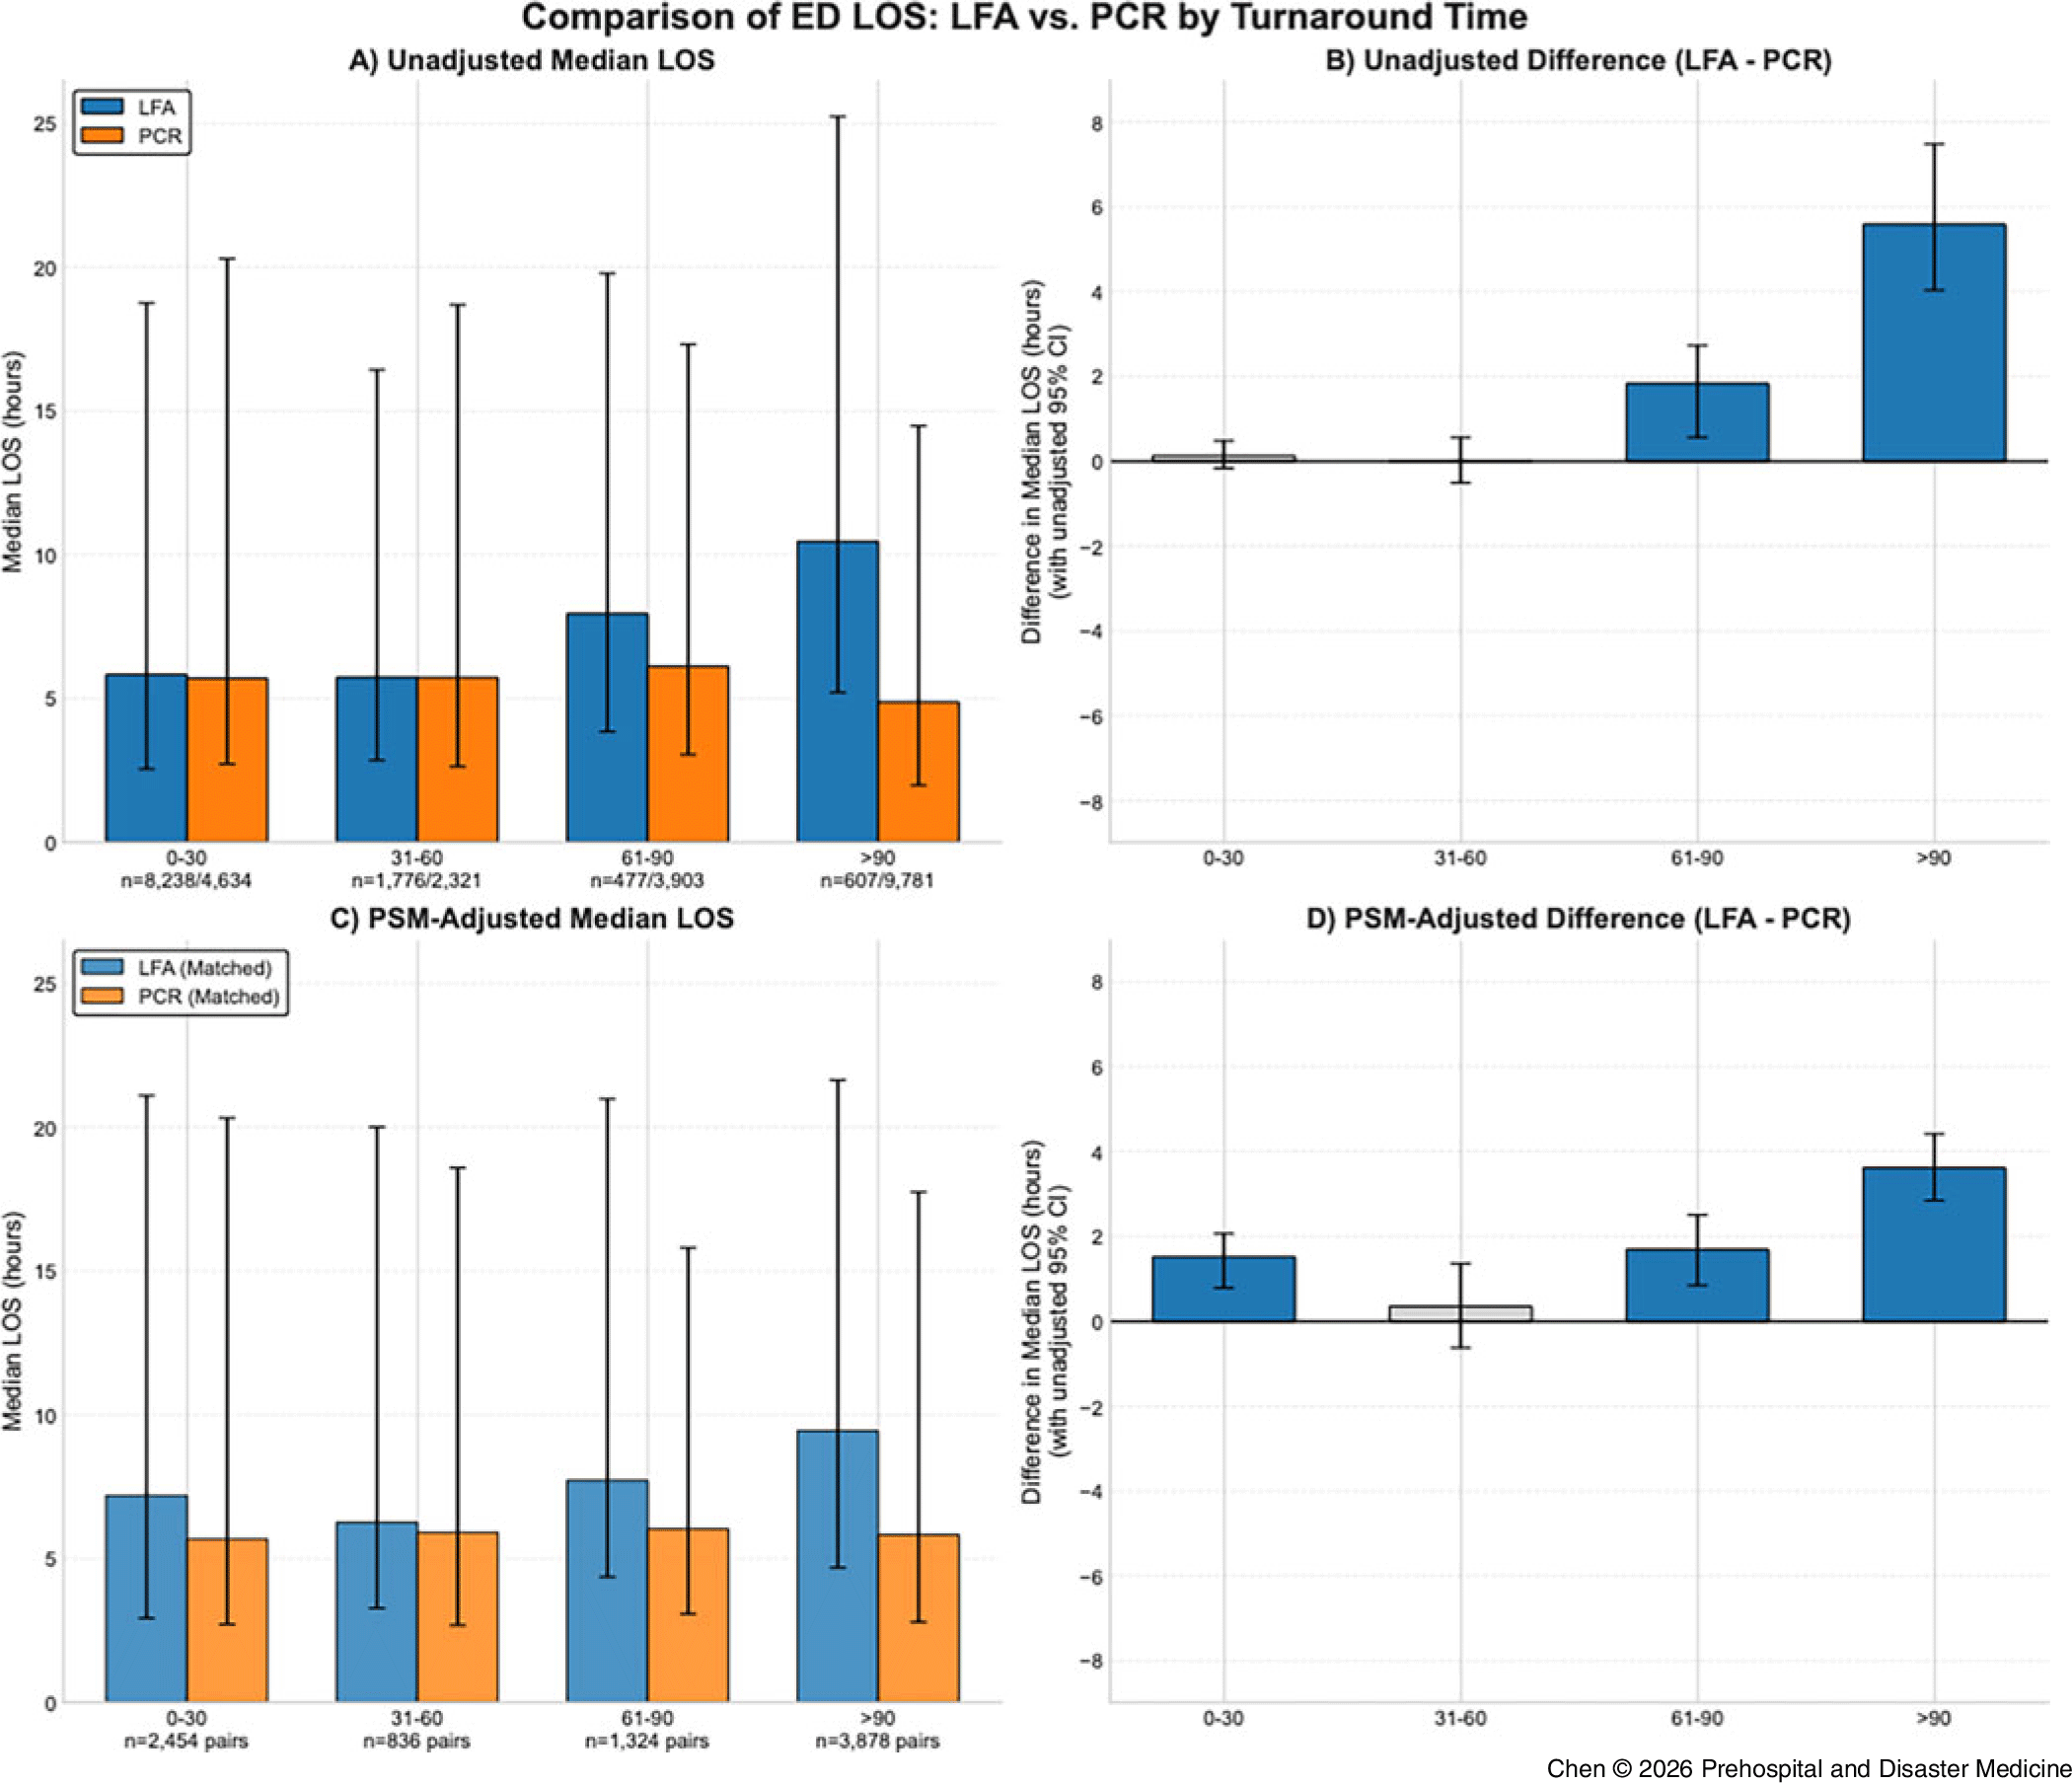
Stratified analyses revealed a sharp divergence in modality performance as operational pressure increased (Table 2; Figure 2). Under low-stress conditions (TAT ≤30 minutes), the LOS difference between LFA and PCR was modest (1.5 hours; 95% CI, 0.80 to 2.07). However, this gap widened substantially at higher TAT thresholds. At TAT >90 minutes, the median LOS disadvantage for LFA expanded to 3.6 hours (9.5 versus 5.8 hours; 95% CI, 2.85 to 4.42). The 95% confidence intervals at these higher strata consistently excluded zero, suggesting that the efficiency gap between modalities amplifies under system stress. A similar trend was observed in the unmatched cohort, where the difference peaked at 5.6 hours (95% CI, 4.03 to 7.45) in the >90-minute stratum, suggesting that LFA workflows are disproportionately sensitive to capacity constraints.
Emergency Department Length-of-Stay Stratified by Testing Modality and Turnaround Time Categories: (A) Non-PSM Analysis and (B) Propensity Score Matched Analysis

Table 2. Long description
The table presents a comparison of emergency department length-of-stay (LOS) stratified by testing modality (LFA and PCR) and turnaround time (TAT) categories. It includes two sections: (A) Non-PSM Analysis and (B) Propensity Score Matched Analysis. Each section lists TAT ranges, the number of cases (n), median LOS with interquartile range (IQR) in hours for both LFA and PCR, the difference in LOS (LFA - PCR) in hours, and the unadjusted 95% confidence interval (CI). The table shows that as TAT increases, the difference in LOS between LFA and PCR becomes more pronounced. For example, in the 90-minute TAT range, the median LOS difference is 5.6 hours in the non-PSM analysis and 3.6 hours in the propensity score matched analysis, indicating that LFA workflows are more sensitive to capacity constraints under system stress.
Note: Data are presented as median [interquartile range]. Differences are calculated as LFA – PCR (positive values indicate longer LOS with LFA). PSM was performed using 1:1 nearest-neighbor matching with a caliper of 0.5 SD. * Confidence interval excludes zero.
The widths of the 95% confidence intervals have not been adjusted for multiplicity, and they should not be used in place of hypothesis testing.
Abbreviations: ED, emergency department; IQR, interquartile range; LFA, lateral flow assay; LOS, length-of-stay; PCR, polymerase chain reaction; PSM, propensity score matching; TAT, turnaround time.
Emergency Department Length-of-stay by Testing Modality Across Turnaround Time Strata.
(A) Unadjusted median ED LOS for LFA and PCR stratified by operational TAT categories; error bars represent interquartile range.
(B) Difference in median LOS (LFA minus PCR) within each TAT stratum.
(C) PSM-adjusted median LOS.
(D) PSM-adjusted differences.
Note: Error bars in Panels B and D represent unadjusted 95% confidence intervals estimated by bootstrap re-sampling; colored bars indicate confidence intervals that exclude zero, gray bars indicate confidence intervals that include zero. Positive values indicate longer LOS with LFA relative to PCR. The difference in LOS widens substantially as TAT increases (>90 minutes), highlighting the capacity-dependent performance gap. The widths of the 95% confidence intervals have not been adjusted for multiplicity.
Abbreviations: CI, confidence interval; ED, emergency department; IQR, interquartile range; LFA, lateral flow assay; LOS, length-of-stay; PCR, polymerase chain reaction; PSM, propensity score matching; TAT, turnaround time.

Figure 2. Long description
The image contains four graphs comparing emergency department length-of-stay (LOS) by testing modality across different turnaround time (TAT) strata. The first graph (A) shows unadjusted median ED LOS for lateral flow assay (LFA) and polymerase chain reaction (PCR) stratified by operational TAT categories, with error bars representing interquartile range. The second graph (B) illustrates the difference in median LOS (LFA minus PCR) within each TAT stratum. The third graph (C) presents propensity score matching (PSM)-adjusted median LOS, while the fourth graph (D) shows PSM-adjusted differences. Error bars in Panels B and D represent unadjusted 95% confidence intervals estimated by bootstrap re-sampling; colored bars indicate confidence intervals that exclude zero, gray bars indicate confidence intervals that include zero. Positive values indicate longer LOS with LFA relative to PCR. The difference in LOS widens substantially as TAT increases (>90 minutes), highlighting the capacity-dependent performance gap. The widths of the 95% confidence intervals have not been adjusted for multiplicity.
Within-Modality Performance Under System Stress
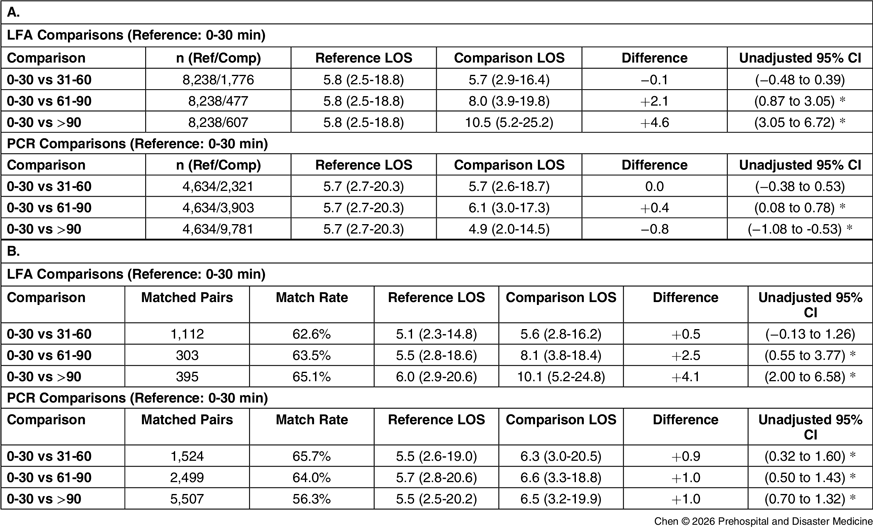
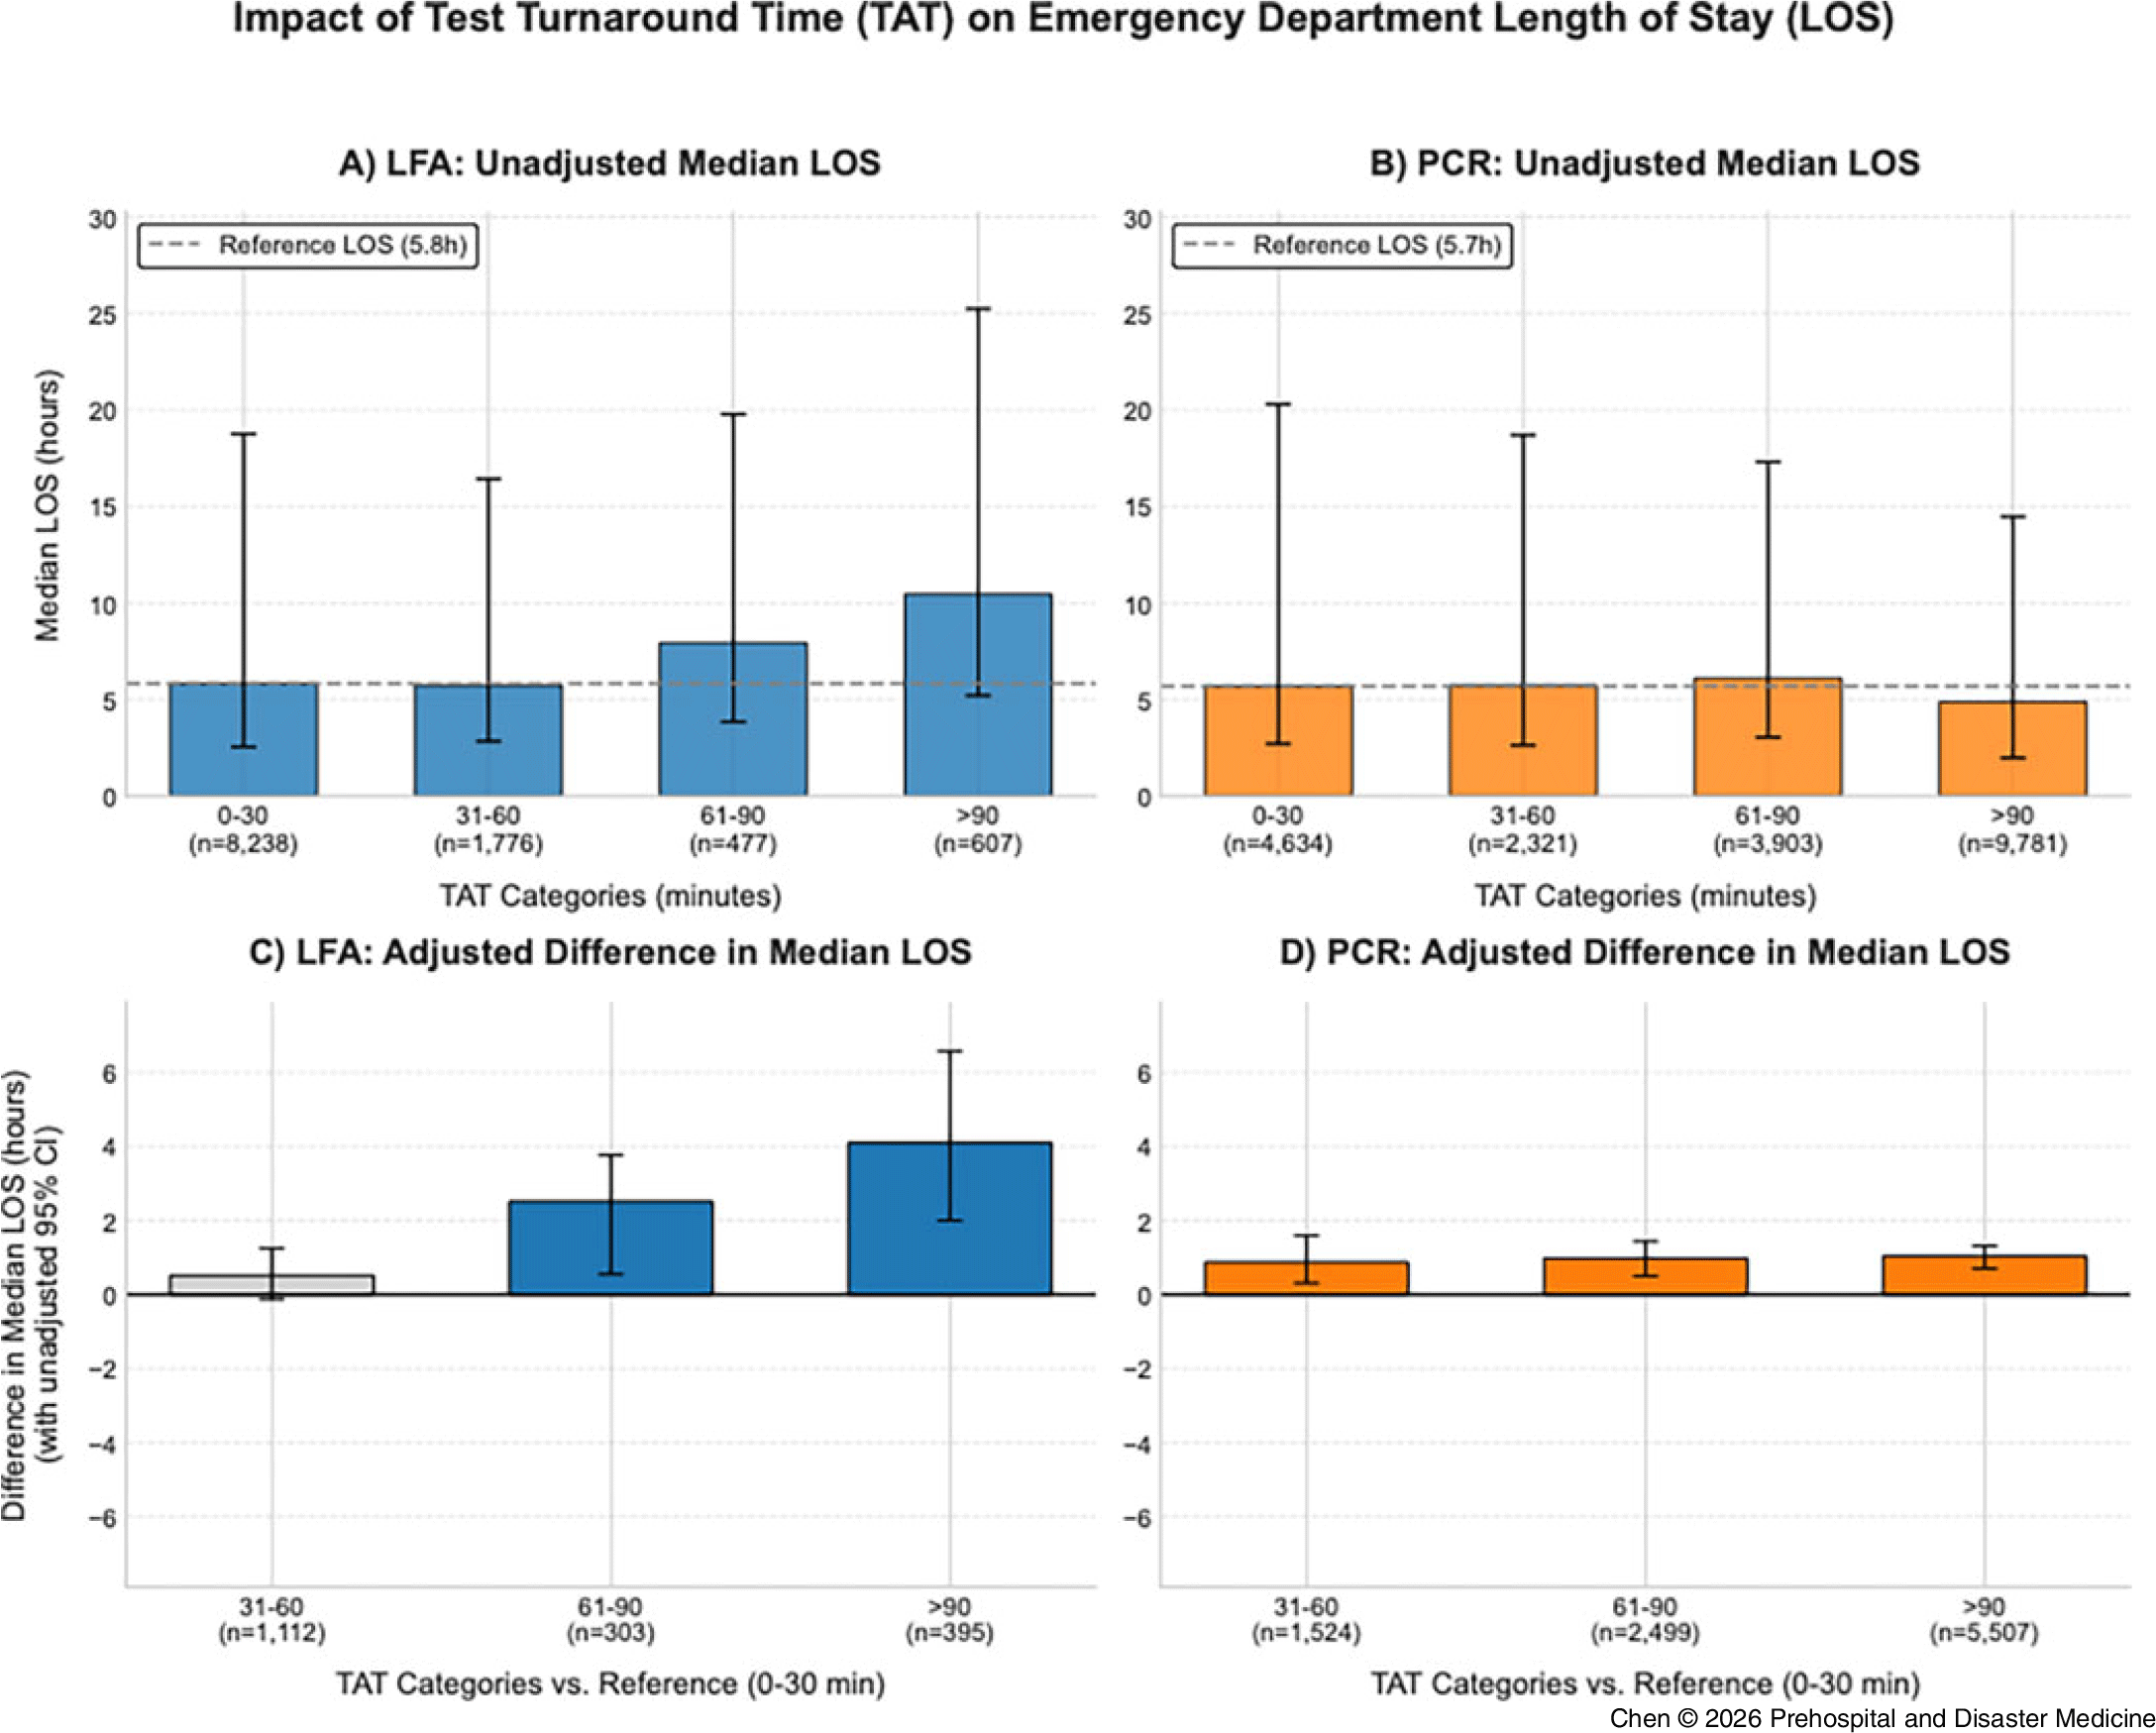
Within-modality analyses highlighted contrasting responses to system stress (Table 3; Figure 3). Overall, LFA performance degraded markedly as delays increased: compared to the baseline group (TAT 0–30 minutes), encounters with TAT >90 minutes exhibited a median LOS prolongation of 4.1 hours (95% CI, 2.00 to 6.58). In contrast, PCR demonstrated operational resilience. Across all TAT categories, the LOS increase remained minimal, fluctuating by only ∼1.0 hour relative to baseline (TAT >90 minutes: +1.0 hours; 95% CI, 0.70 to 1.32). This distinct pattern—progressive degradation in LFA versus stability in PCR—underscores the fragility of LFA workflows during periods of crowding.
Within-Modality Associations between Turnaround Time Delays and Emergency Department Length-of-stay: (A) Non-PSM Analysis and (B) PSM-Adjusted Analysis

Table 3. Long description
The table presents a comparison of emergency department length-of-stay (LOS) across different turnaround time (TAT) delays for LFA and PCR. It includes data from non-PSM analysis and PSM-adjusted analysis. The table is divided into two main sections: A and B. Section A shows LFA and PCR comparisons with reference TAT of 0-30 minutes, including the number of comparisons, reference LOS, comparison LOS, difference in LOS, and unadjusted 95% confidence intervals. Section B presents matched pairs analysis for LFA and PCR comparisons, including match rate, reference LOS, comparison LOS, difference in LOS, and unadjusted 95% confidence intervals. Notable trends include a significant increase in LOS for LFA as TAT increases, particularly for TAT greater than 90 minutes, while PCR shows minimal changes in LOS across different TAT categories.
Note: Reference category for all comparisons is TAT 0–30 minutes. Data are presented as median [interquartile range] or median differences. PSM matching variables: age, daily ED census, and triage acuity. * Confidence interval excludes zero.
The widths of the 95% confidence intervals have not been adjusted for multiplicity, and they should not be used in place of hypothesis testing.
Abbreviations: IQR, interquartile range; LFA, lateral flow assay; LOS, length-of-stay; PCR, polymerase chain reaction; PSM, propensity score matching; TAT, turnaround time.
Within-Modality Associations between Turnaround Time Delays and Emergency Department Length-of-stay.
(A–B) Unadjusted median LOS for LFA and PCR; error bars represent interquartile range, with reference lines denoting baseline LOS.
(C–D) PSM-adjusted differences in median LOS relative to the reference category with unadjusted 95% confidence intervals estimated by bootstrap resampling; colored bars indicate confidence intervals that exclude zero, gray bars indicate confidence intervals that include zero. LFA demonstrates progressively increasing LOS with longer TAT delays, whereas PCR maintains relatively stable performance across all stress levels. The widths of the 95% confidence intervals have not been adjusted for multiplicity.
Abbreviations: CI, confidence interval; ED, emergency department; LFA, lateral flow assay; LOS, length-of-stay; PCR, polymerase chain reaction; PSM, propensity score matching; TAT, turnaround time.

Figure 3. Long description
The image contains four bar graphs analyzing the impact of test turnaround time (TAT) on emergency department length of stay (LOS) for LFA and PCR methods. The first two graphs (A and B) show unadjusted median LOS for LFA and PCR, respectively, with error bars representing interquartile range and reference lines denoting baseline LOS. The x-axis categorizes TAT into four groups (0-30, 31-60, 61-90, and over 90 minutes), while the y-axis measures median LOS in hours. The second set of graphs (C and D) displays PSM-adjusted differences in median LOS relative to the reference category (0-30 minutes) with unadjusted 95% confidence intervals estimated by bootstrap resampling. Colored bars indicate confidence intervals that exclude zero, while gray bars indicate those that include zero. LFA shows progressively increasing LOS with longer TAT delays, whereas PCR maintains relatively stable performance across all stress levels. The widths of the 95% confidence intervals have not been adjusted for multiplicity.
Operational Variability
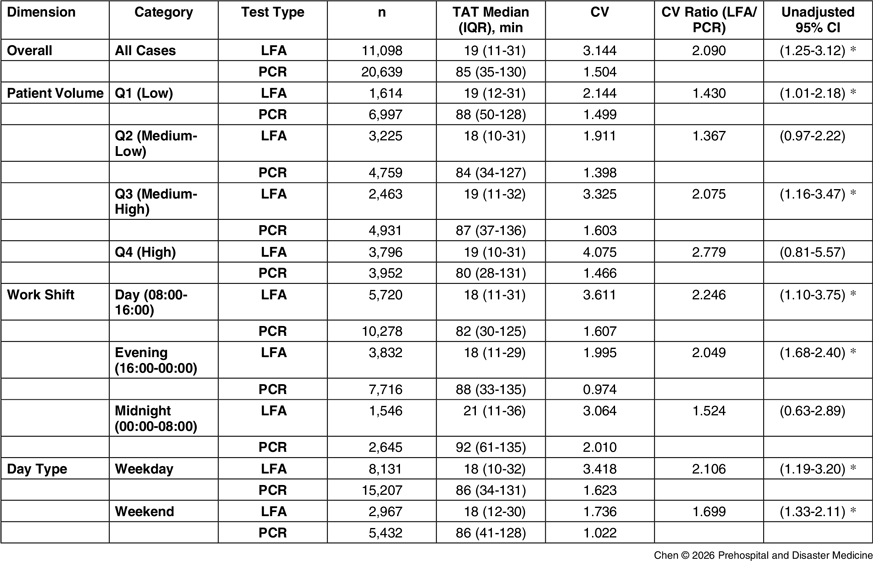
Variability analysis further quantified workflow predictability (Table 4). Overall, LFA exhibited substantially higher operational variability than PCR (CV ratio 2.09; 95% CI, 1.25 to 3.12). This instability was pervasive across most operational dimensions. Variability in LFA was notably higher during both day shifts (CV ratio 2.25; 95% CI, 1.10 to 3.75) and weekends (CV ratio 1.70; 95% CI, 1.33 to 2.11). During periods of highest patient volume (Q4), the point estimate for the CV ratio peaked at 2.78. Although the confidence interval for this subgroup was wide and crossed 1.0 (95% CI, 0.81 to 5.57), this imprecision likely reflects extreme workflow heterogeneity under maximum system load rather than equivalence between the two strategies.
Variability in Turnaround Time by Testing Modality Across Operational Conditions

Table 4. Long description
The table presents a detailed comparison of turnaround time variability between LFA and PCR across various operational conditions. It includes dimensions such as overall cases, patient volume, work shift, and day type. The table has 15 rows and 7 columns, with headers for Dimension, Category, Test Type, n, TAT Median (IQR) in minutes, CV, CV Ratio (LFA/PCR), and Unadjusted 95% CI. Notable trends include higher variability in LFA compared to PCR across most conditions, with significant differences observed during day shifts and weekends. The patient volume category Q4 shows the highest point estimate for the CV ratio, indicating extreme workflow heterogeneity under maximum system load.
Note: Data show median [interquartile range] turnaround times and coefficients of variation (CV). CV ratio calculated as LFA CV divided by PCR CV. 95% confidence intervals for the CV ratio were estimated using bootstrap resampling (2000 iterations). * Confidence interval excludes 1.0, suggesting a difference in variability between modalities.
The widths of the 95% confidence intervals have not been adjusted for multiplicity, and they should not be used in place of hypothesis testing.
Abbreviations: CV, coefficient of variation; IQR, interquartile range; LFA, lateral flow assay; PCR, polymerase chain reaction; Q, quartile; TAT, turnaround time.
Discussion
This study demonstrates that the operational performance of COVID-19 testing strategies in EDs is functionally dependent on system capacity rather than analytical test speed alone. Under low-stress conditions (TAT ≤30 minutes), LFA and PCR testing showed comparable efficiency (LOS difference 1.5 hours; 95% CI, 0.80 to 2.07). However, as system stress intensified—particularly when TAT exceeded 90 minutes—the performance gap widened substantially. In the matched analysis, LFA was associated with a 3.6-hour longer LOS than PCR (95% CI, 2.85 to 4.42), suggesting that decentralized, nurse-driven workflows are uniquely vulnerable to capacity strain.
Three consistent patterns emerged. First, a threshold effect: LFA-associated LOS degraded progressively across TAT strata, whereas PCR-associated LOS remained resiliently stable. Second, LFA demonstrated markedly higher operational variability, with a 2.09-fold greater coefficient of variation (95% CI, 1.25 to 3.12). Third, these patterns were robust across both matched and unmatched analyses, suggesting true operational phenomena rather than statistical artifacts. These findings imply that prolonged TAT and increased LOS are concurrent manifestations of system stress, identifying a specific vulnerability in point-of-care testing strategies during surge periods.
Turnaround Time as a System Capacity Indicator
These findings support the use of TAT as a dynamic, quantifiable proxy for ED system stress. The widening efficiency gap between LFA and PCR signals the point at which ED internal resources—specifically nursing bandwidth and physical workspace—become saturated. The critical inflection point appeared beyond 60 minutes, with varying degrees of workflow degradation peaking at >90 minutes. At this level of delay, LFA was associated with a 64% longer LOS relative to PCR. This association highlights the utility of real-time TAT monitoring not just as a quality metric, but as a trigger for operational switching: identifying when the external capacity of a central laboratory (PCR) provides a necessary buffer for the strained ED frontline.
Resource Dependency and Operational Resilience
Resource Dependence Theory offers a theoretical framework to interpret these capacity-contingent patterns. Reference Hillman, Withers and Collins16,Reference Ozturk21 Implementation of LFA requires synchronous, hands-on attention from ED nursing staff Reference Hoot and Aronsky22,Reference Kenny, Chang and Hemmert23 —the exact resource that is most scarce during high-volume periods. In contrast, PCR workflows offload the analytical burden to centralized laboratories, operating independently of frontline clinical pressures. Reference Mohtady Ali, Desha, Ranse and Roiko15,Reference Mojebi, Wu, Keeping, Hale, Chase and Beaubrun24 Consequently, as operational stress intensifies, point-of-care workflows become less predictable, while externally supported processes maintain stability. The progressive deterioration of LFA-associated LOS likely reflects these modality-specific resource dependencies rather than any intrinsic failure of the rapid testing technology itself. Reference Dui, Liu and Wu3,Reference Melman, Parlikad and Cameron25
Complex Systems Perspective in Emergency Operations
Emergency departments function as complex adaptive systems where capacity strain emerges from the non-linear interaction of staffing, acuity, and space. Reference Badr, Nyce, Awan, Cortes, Mowdawalla and Rachoin1,Reference Morley, Unwin, Peterson, Stankovich and Kinsman2,Reference Hillman, Withers and Collins16,Reference Samadbeik, Staib and Boyle19 These findings—that both prolonged TAT and increased LOS signify system stress—align with this non-linear dynamic. Reference Kim, Seo and Kim6,Reference Fanti, De Marco and Lorenzini9,Reference Kenny, Chang and Hemmert23,Reference Lu, Ding, Peng and Hao-Chun Chuang26 The variability analysis (Table 4) provides novel evidence of this non-linearity. While PCR maintained a consistent workflow cadence, LFA demonstrated significant volatility. Notably, during periods of peak patient volume (Q4), the CV ratio showed a high-point estimate (2.78) but a wide confidence interval that crossed 1.0 (95% CI, 0.81 to 5.57). Rather than interpreting this simply as statistical imprecision, this wide dispersion likely reflects extreme workflow heterogeneity under maximum load. In a crowded ED, some LFA tests may be processed immediately while others are forgotten or delayed by competing resuscitation needs, creating a chaotic distribution of times. This finding suggests that decentralized workflows (LFA) are inherently more fragile than automated workflows (PCR) when the system approaches its breaking point. Reference Dui, Liu and Wu3,Reference Al-Shareef, Al Jabarti, Babkair, Jamajom, Bakhsh and Aga7,Reference Mojebi, Wu, Keeping, Hale, Chase and Beaubrun24,Reference Melman, Parlikad and Cameron25
Comparison with Existing Literature
Existing studies have documented the impact of ED crowding on delays in care, increased mortality, and reduced patient satisfaction; Reference Warren, Campbell and Nestler4–Reference Al-Shareef, Al Jabarti, Babkair, Jamajom, Bakhsh and Aga7 however, most research has examined crowding as an outcome rather than as a variable guiding real-time operational decisions. Prior research has largely evaluated COVID-19 testing based on diagnostic accuracy (sensitivity/specificity) or theoretical TAT, Reference Arshadi, Fardsanei and Deihim11,Reference Khandker, Nik Hashim, Deris, Shueb and Islam27,Reference Peña, Ampuero and Garcés28 often assuming that faster analytical time translates to faster discharge. While studies describe the theoretical speed of LFA, Reference Chi, Chiu and Chen12,Reference Mojebi, Wu, Keeping, Hale, Chase and Beaubrun24 the present findings suggest these advantages attenuate or reverse under real-world workflow strain. This aligns with literature on ED crowding, which emphasizes that process bottlenecks shift depending on resource availability. This study complements calls to evaluate interventions within the broader context of ED operations. Reference Samadbeik, Staib and Boyle19,Reference Hoot and Aronsky22
Rather than assuming that faster tests inherently improve flow, the results indicate that testing performance is capacity-dependent: operational conditions—not analytical speed alone—determine which modality supports overall throughput. This contextual perspective supports more nuanced resource allocation during surge periods, emphasizing that laboratory or theoretical advantages do not automatically translate into operational benefits at the bedside.
Clinical and Operational Implications
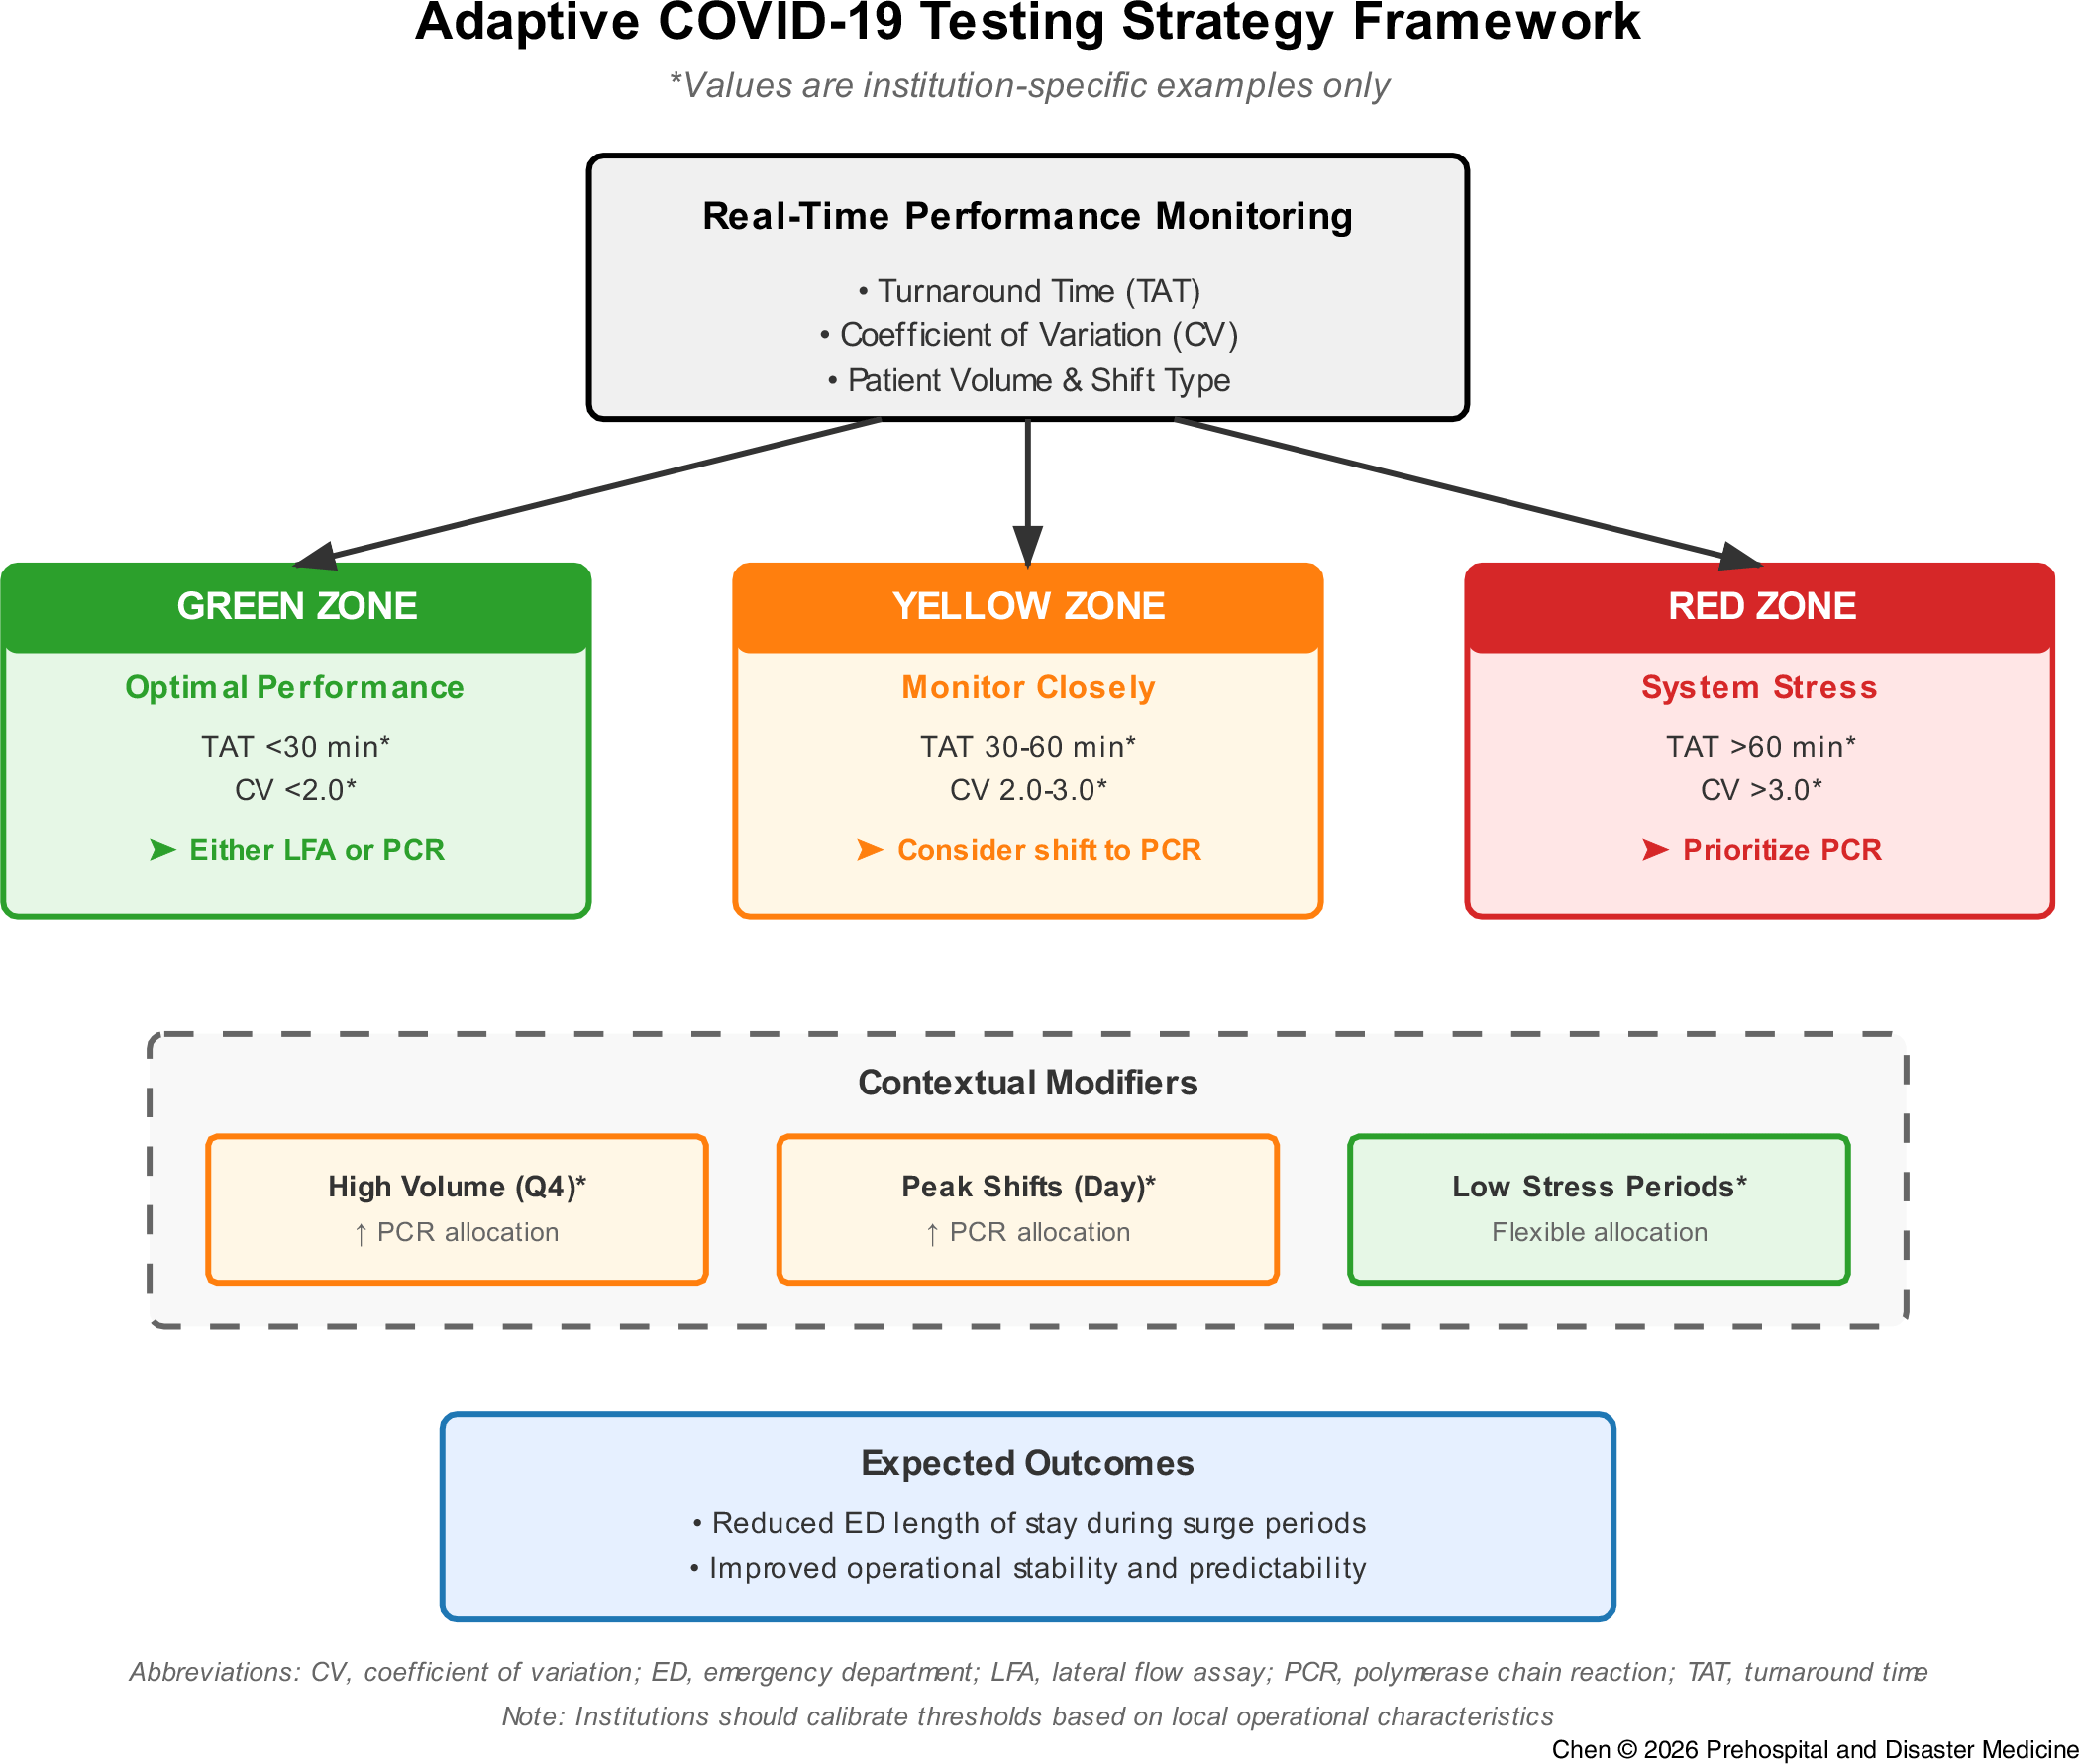
These findings support a capacity-responsive approach to testing strategy selection. A dynamic framework is proposed in which TAT and operational variability (CV) serve as real-time indicators for modality choice (Figure 4):
-
• Green Zone (TAT <30 minutes, Low Variance): LFA is preferred for speed.
-
• Yellow Zone (TAT 30–60 minutes): Early warning sign; prepare to transition.
-
• Red Zone (TAT >60 minutes, High Variance): Prioritize PCR.
Evidence-Based Framework for Adaptive COVID-19 Testing Strategy Selection.
Note: Decision support framework integrating real-time operational metrics to guide dynamic testing allocation. Three operational zones are defined by TAT and CV thresholds: Green (optimal performance, flexible modality choice), Yellow (early warning, consider transition to PCR), and Red (system stress, prioritize PCR). Contextual modifiers account for predictable stress patterns such as high patient volume and peak shifts. All threshold values shown are institution-specific examples derived from this study and require local calibration.
Framework derived from single-center exploratory analyses; institutions should validate thresholds based on local operational characteristics and resource constraints before implementation.
Abbreviations: CV, coefficient of variation; ED, emergency department; LFA, lateral flow assay; PCR, polymerase chain reaction; Q4, fourth quartile; TAT, turnaround time.

Figure 4. Long description
Flowchart illustrating the adaptive COVID-19 testing strategy framework. The process begins with real-time performance monitoring, which tracks turnaround time (TAT), coefficient of variation (CV), and patient volume and shift type. Based on these metrics, the system categorizes performance into three zones: Green, Yellow, and Red. The Green Zone indicates optimal performance with TAT under 30 minutes and CV under 2.0, allowing for either lateral flow assay (LFA) or polymerase chain reaction (PCR) testing. The Yellow Zone signals the need for close monitoring with TAT between 30-60 minutes and CV between 2.0-3.0, suggesting a consideration to shift to PCR. The Red Zone indicates system stress with TAT over 60 minutes and CV over 3.0, prioritizing PCR testing. Contextual modifiers such as high volume periods, peak shifts, and low stress periods influence testing allocation strategies. The expected outcomes include reduced emergency department length of stay during surge periods and improved operational stability and predictability.
By shifting to PCR, the ED offloads the “testing workload” to the lab, preserving nursing resources for direct patient care. Since these metrics are readily available in most ED information systems, this framework allows for proactive surge management. Reference Cilloni, Kendall, Dowdy and Arinaminpathy8,Reference Chi, Chiu and Chen12,Reference de Oliveira, Silva and de Mattos Neto29
Local calibration of threshold values remains essential, as the specific cut-points identified in this study reflect the operational characteristics of the study institution. Integration of these indicators into electronic health records could enable color-coded zone displays and simple, real-time recommendations to support clinical decision making during peak operational periods.
The resource-allocation logic underlying this framework extends beyond the ED itself. The COVID-19 pandemic reframed the ED as a sustained disaster-response environment, and the central finding — that testing performance depends on operational capacity rather than device speed alone — carries directly into prehospital and disaster medicine contexts. In prehospital screening deployment (community stations, triage checkpoints, and Emergency Medical Services field operations) and in mass-casualty scenarios, where staffing and space are often more constrained than in a resourced ED, testing strategies that draw heavily on frontline capacity may similarly under-perform under sustained load. These findings support the inclusion of capacity-aware testing protocols — with explicit fallback strategies for periods of operational saturation — in prehospital and disaster preparedness planning.
Study Limitations
This study has several limitations. First, as a single-center study, specific TAT thresholds may vary based on local staffing models, lab transport mechanisms, and patient volumes. Reference Mohtady Ali, Desha, Ranse and Roiko15,Reference Samadbeik, Staib and Boyle19 Second, despite rigorous PSM, observational data cannot definitively establish causality, and unmeasured confounders may influence results. Reference Austin20,Reference Kenny, Chang and Hemmert23 Third, individual-level staffing data (shift-specific nurse-to-patient ratios, physician workload) were not available. Because LFA and PCR were deployed concurrently within the same ED and managed by the clinical team on duty without modality-specific personnel assignment, residual staffing variation is expected to act non-differentially rather than systematically bias the modality comparison. Fourth, TAT and LOS capture only part of the operational environment; other granular capacity indicators — including bed turnover rates and active resuscitation load — were not available. Reference Mohtady Ali, Desha, Ranse and Roiko15,Reference Samadbeik, Staib and Boyle19 Fifth, the stratified and variability analyses were exploratory; confidence intervals were not adjusted for multiplicity and should be viewed as hypothesis-generating rather than confirmatory. Finally, testing patterns reflect pandemic-specific workflows that may change over time.
Future Research
Future work should include multi-center validation of capacity thresholds, integration of additional real-time operational metrics, and development of automated decision-support tools that recommend testing strategies based on current system conditions. Reference Piliuk and Tomforde17,Reference de Oliveira, Silva and de Mattos Neto29 Extending capacity-responsive approaches to other operational domains—such as imaging prioritization, laboratory workflow management, or bed allocation—may further enhance ED resilience. Economic evaluation of adaptive testing protocols will also be important for informing institutional and system-level policy.
Conclusions
This study demonstrates that the operational performance of COVID-19 testing strategies in EDs is fundamentally dependent on system capacity. While LFA and PCR offer comparable efficiency under low-stress conditions, their performance diverges sharply once TAT exceeds 90 minutes. At this threshold, LFA is associated with substantial workflow degradation and high operational variability, whereas PCR maintains stability. These patterns likely reflect modality-specific resource dependencies rather than intrinsic test characteristics.
The findings support the implementation of capacity-contingent adaptive strategies. By transitioning to laboratory-based PCR during periods of high operational stress, EDs may mitigate workflow bottlenecks, preserve critical nursing resources, and ensure more predictable patient throughput. Adopting such context-sensitive protocols can enhance system resilience, optimizing care delivery during both routine surges and future public health emergencies.
Author Contributions
Cheng-Han Chen: Conceptualization, Methodology, Formal analysis, Writing - original draft, Writing - review & editing, Project administration, Funding acquisition, Software, Visualization, Final approval, Accountability for all aspects.
Yi-Tzu Lee: Conceptualization, Data curation, Validation, Supervision, Manuscript review, Final approval, Accountability for all aspects.
Teh-Fu Hsu: Resources, Data curation, Manuscript review, Final approval, Accountability for all aspects.
Chorng-Kuang How: Conceptualization, Methodology, Resources, Manuscript review, Final approval, Accountability for all aspects.
Li-Hua Li: Resources, Methodology, Validation, Manuscript review, Final approval, Accountability for all aspects.
Chao-Min Cheng: Conceptualization, Supervision, Project administration, Funding acquisition, Writing - review & editing, Final approval, Accountability for all aspects.
Use of AI Technology
Artificial intelligence (Claude, Anthropic; San Francisco, California USA) was used solely to enhance the writing quality of this manuscript (not for generating content or analysis). All content has been reviewed and approved by the authors.
Conflicts of interest/funding
This study was supported by grants from Taiwan’s National Science and Technology Council (Taipei, Taiwan; 113-2221-E-075-007-, 114-2221-E-075-006-, and 113-2221-E-007-021-MY3) and Taipei Veterans General Hospital (Taipei, Taiwan; V114B-001). The authors declare that they have no known competing financial interests or personal relationships that could have appeared to influence the work reported in this paper.