I. INTRODUCTION
Quantum well structures such as Si/Ge heterostructures have come into focus of intensive research owing to the possibility of using these systems in the future quantum-optical applications because an indirect recombination of excitons is no longer prohibited in these systems. Importantly, unusual physical effects observed in these structures may become the basis for the next generation of nanoscale electronic and optoelectronic devices compatible with the well-developed silicon-integrated technology.Reference Kasper and Paul1,Reference Balandin and Wang2 The growth mechanism of Si1−xGex layers on Si substrates were considered in a number of studies starting from the seminal works of LeGoues et al.,Reference LeGoues, Copel and Tromp3 Eaglesham and CerulloReference Eaglesham and Cerullo4 and later summarized in a number of surveys, e.g., PaulReference Paul5 and Brunner.Reference Brunner6 It is known that up to a critical thickness h c the growth of a pseudomorphic two-dimensional layer proceeds through the Frank–van der Merwe (FvdM) mechanism. When the layer thickness exceeds h c, stress relaxation occurs through the formation of surface relief of the Si1−xGex layer and the appearance of defects, in particular, 60° misfit dislocations (MDs) with a Burgers vector a/2 < 110>. In this case the growth of the Si1−xGex layer occurs via the Stranski–Krastanov (SK) mechanism, leading to the formation of self-assembled Si1−xGex islands in heterostructures with a variety of morphological types depending on the growth parameters.Reference Voigtländer7,Reference Rastelli, Stoffel, Denker, Merdzhanova and Schmidt8 The islands of pyramidal shape (“hut”-like islands) that appear during the process of molecular beam epitaxy (MBE) growth at low temperatures (T g < 500 °C) are especially interesting, since they demonstrate quantum-size-related properties and can be grown with the required density. The size of these nanoislands formed on the surface of the growing Ge layer decreases with a lowered T g due to the reduction of the surface thermal diffusion coefficient of the deposited atoms. Atomic force microscopy and scanning tunneling microscopy revealedReference Pchelyakov, Bolkhovityanov, Dvurechenskii, Sokolov, Nikiforov, Yakimov and Voigtländer9–Reference Arapkina and Yuryev15 the formation of hut-like islands with lateral dimensions of ∼10 nm and a height of ∼1 nm on the surface of the wetting layer of Ge with a thickness of about 5 ML (thickness of one Ge ML h ML ≈ 1.4 Ǻ) grown at T g = 250–350 °C. Increasing the thickness of the Ge layer [or the number (N) of the monolayers (MLs)] leads to an increased density of islands up to (3–6) × 1011 cm−2,Reference Dashiell, Denker, Müller, Costantini, Manzano, Kern and Schmidt11,Reference Arapkina and Yuryev15 and with a N > 8 ML a continuous layer of Ge was observed.Reference Leitão, Fonseca, Sobolev, Carmo, Franco, Sequeira, Burbaev, Kurbatov, Rzaev, Pogosov, Sibeldin, Tsvetkov, Lichtenberger and Schäffler13
Inverted Si1−xGex islands adopted the shape of inverted pyramids were observed in multilayer structures with thick Ge layers (>3 nm) grown at T g = 250–350 °C by conventional transmission electron microscopy (TEM)Reference Cheng, Chia, Markov, Guo, Chen, Peng and Kuan16–Reference Cheng, Huang, Mashanov and Sun19 and analyzed with energy dispersive x-ray (EDX) microanalysis,Reference Soo, Kioseoglou, Huang, Kim, Kao, Peng, Kuan and Cheng17,Reference Cheng, Huang, Mashanov and Sun19 extended x-ray absorption fine structure (EXAFS)Reference Soo, Kioseoglou, Huang, Kim, Kao, Peng, Kuan and Cheng17 and other techniques. Crystalline Si–Ge islands with a size of the groove being more than 9 nm grew into the underlying layers of Si. The EDX spectroscopy indicated that in the direction parallel to the Si surface, the Ge content was lowest in the center and increased toward both edges of the groove. Along the growth direction, the Ge content was highest around the Ge layer and decreased toward its apex. The authors explained the formation of such islands by the intermixing of Si and Ge due to the diffusion caused by stresses in the layer. The Ge/Si intermixing at the Ge/Si(001) interface was also considered in a number of studies.Reference Cheng, Huang, Mashanov and Sun19–Reference Wagner and Gulari28 Using high resolution Rutherford backscattering Nakajima et al.Reference Nakajima, Konishi and Kimura25 found that Ge diffused down to the fourth layer from the top and measured the change of composition with temperature. In the EXAFS study for a varying Ge wetting layer thickness Soo et al.Reference Soo, Kioseoglou, Huang, Kim, Kao, Peng, Kuan and Cheng17 demonstrated that the intermixing of Ge and Si exists at the Si/Ge interface and spreads up to 3–5 ML, inversely depending on the Ge layer thickness. It was proposed that as the Ge layer reaches a critical thickness, the formation of MDs becomes a dominant mechanism of releasing the strain energy, thus lowering the probability of the Si–Ge intermixing or the formation of inverted pyramids. Most studies of the intermixing process were performed for few MLs of Ge on Si. To be used in applications Ge nanoislands should be embedded in a crystal semiconductor matrix, yet the morphology and structure of these “buried” layers depend on the growth parameters of subsequent layers and may differ significantly from the bare layer of Ge. This difference in morphology of the Ge layer should manifest itself in photoluminescence (PL) spectra since any change in the structure of the layers modifies electronic properties of the heterostructures. PL spectra of structures grown at T g ≈ 350 °C with a thick (5 ML) layer of Ge demonstrate a broad single peak at an energy of 0.75–0.85 MeV,Reference Dashiell, Denker and Schmidt10,Reference Dashiell, Denker, Müller, Costantini, Manzano, Kern and Schmidt11 which the authors explain as a zero-phonon recombination of excitons in Ge nanoislands. Upon annealing (2 min, at 700 °C) or decreasing the thickness of the layer, this peak is split into two, separated by an energy which corresponds approximately to the energy of the transverse optical (TO) phonon in silicon. Structures grown at T g = 250–300 °C with the Ge layer thickness N > 3 MLReference Leitão, Fonseca, Sobolev, Carmo, Franco, Sequeira, Burbaev, Kurbatov, Rzaev, Pogosov, Sibeldin, Tsvetkov, Lichtenberger and Schäffler13 demonstrated phonon (QW-TO) and zero-phonon (QW-NP) peaks in their PL spectra arising from the wetting layer as well as broad peak at an energy of 0.75–0.85 meV, which disappeared after the treatment of the structure with atomic hydrogen (30 min, 200 °C). The authors suggested the PL of point defects being the origin of this peak rather than the presence of Ge islands because it is well knownReference Pearton, Corbett and Shi29 that processing with atomic hydrogen leads to the passivation of defects in silicon. It is noteworthy that QW-NP and QW-TO peaks preserved their positions in the PL spectrum after such a passivation,Reference Leitão, Fonseca, Sobolev, Carmo, Franco, Sequeira, Burbaev, Kurbatov, Rzaev, Pogosov, Sibeldin, Tsvetkov, Lichtenberger and Schäffler13 meaning that the wetting layer thickness and composition does not change during the passivation. These experiments prove the existence of a significant number of point defects in the structures grown by MBE at low temperatures. A strong peak at the energy of 0.8 meV in the PL spectrum of multilayer Ge/Si structures grown at T g = 250 °C was observed by Burbaev et al.Reference Burbaev, Zavaritskaya, Kurbatov, Melnik, Tsvetkov, Zhuravlev, Markov and Nikiforov30 and attributed to the radiative recombination in nanoislands. This statement requires additional investigation since the narrow half-width of this PL peak suggests that its origin is the PL of dislocations in Si, whose emission spectrum is in the same energy range.
In this paper, we have performed a thorough study of the structure of Ge layers in multilayer heterostructures and the influence of structural changes of the buried Ge layers on their PL spectra by examining the crystal structure and optical properties of multilayer Ge/Si heterostructures grown by MBE at low temperatures. The Ge/Si intermixing at the Ge/Si(001) interface was also discussed.
II. EXPERIMENTAL
Multilayer Si/Ge nanostructures were grown by MBE on low-doped p-type (001) Si substrates with a resistivity of more than 1000 ohm cm. After the standard substrate surface cleaning operation a Si buffer layer with a thickness of 200 nm was grown at a temperature of 750 °C by MBE. Then, heterostructures composed of five layers of Ge with nominal thicknesses d nom = 2, 3, 5, 7, 10, and 12 ML (denoted further as Ge2ML…Ge12ML) separated by Si layers with the thickness of 10 nm were deposited by MBE. The deposition rate of Ge and Si was equal to 0.005 and 0.1 nm/s, respectively. The growth temperature of Ge was T Ge = 300 °C. The intermediate Si layers were grown by the two-stage process: the first layer of 2 nm was grown at T Si = 300 °C, while the subsequent layer of ∼7 nm was grown at T Si = 450 °C. On the top of the heterostructure the Ge layer was left uncovered for the investigation by AFM. All heterostructures were grown at the University of J. Kepler (Linz, Austria) by M.M. Rzaev (Lebedev Physical Institute, Moscow).
Cross sections of the heterostructures were prepared for the TEM study by the standard procedure that included mechanical polishing down to a thickness of 20–25 µm followed by ion milling (Ar+) using Gatan 691 PIPS (Gatan, Warrendale, PA) at an accelerating voltage of 3 kV until perforation. The final milling was carried out by Ar+ ions with an energy of 0.1 keV. The study was performed using a scanning TEM (STEM) TITAN 80–300 TEM/STEM (FEI, Hillsboro, OR) with a spherical aberration corrector operating at an accelerating voltage of 300 kV. High-resolution (HR) dark-field images were recorded using a high-angle annular dark-field detector (HAADF) for collecting electrons scattered through large angles. An energy-dispersive x-ray spectrometer - EDXS (EDAX, Mahwah, NJ) was used to study the chemical composition of heterostructures. Digital micrograph (DM) software (Gatan, Warrendale, PA) was used for the image processing.
HR x-ray reflectivity (XRR) and x-ray standing waves (XSW) measurements were performed at a “Langmuir” beamline of Kurchatov Center for Synchrotron Radiation. Synchrotron radiation selection and monochromatization were carried out by a Si (111) double-crystal monochromator. Two flat quartz mirrors positioned parallel to each other were used for high harmonics rejection. Such an experimental scheme provides the energy resolution ΔE/E = 5 × 10⁻⁴. X-ray radiation with an energy of 12 keV (above K-absorption edge of Ge) was used in the experiments. Experimental XRR curves were measured in the θ–2θ scan mode with a scintillation detector. The method of XSW in the condition of a total external reflection was performed, with the registration of the secondary fluorescent radiation of Ge Kα and Kβ lines, using the energy dispersive detector Vortex-SII.
The determination of the layer thickness and interface roughness was carried out by solving the inverse problem of XRR by an iterative method. The original sample structure was proposed as a layered system with a number of layers sufficient to describe all features of the real system. The thickness and x-ray complex refractive index were set for each layer. Such a division is necessary for correct identification of all possible fluctuations of the electron density with depth as well as for accounting for all possible transition layers, interfaces and surface roughness.
The Ge spatial distribution profile was obtained by fluorescent yield analysis. The calculations of the wave field intensity distribution were carried out for these simulations. The depth distribution of Ge was selected by an iterative method to get the best fit of integrated amplitude of the wave field with the experimental results for all angles.
To record the PL spectra the samples were cooled down to 1.8 K. A semiconductor laser with a wave length λ = 660 nm was used as an excitation source. The radiation power density at the sample surface was ∼4 W/cm2. The radiation from the samples was measured using both a high-aperture diffraction monochromator and a Ge-based nitrogen-cooled p-i-n photodiode.
III. RESULTS
A. Electron microscopy
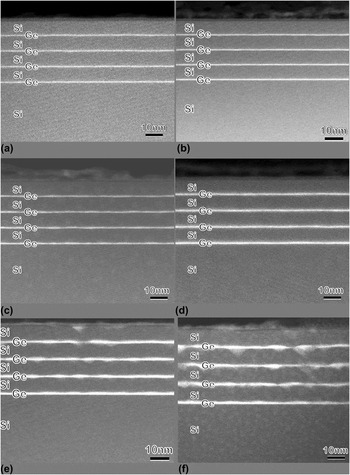
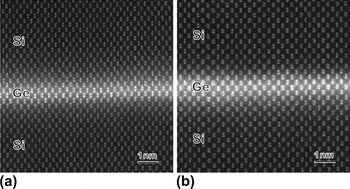
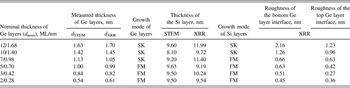
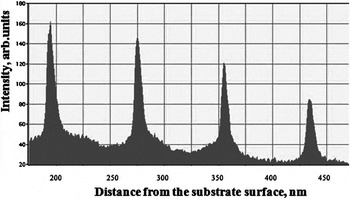
HAADF STEM images of all studied Si/Ge heterostructures are shown in Figs. 1(a)–1(f). Due to the considerable difference in atomic numbers, the Ge layers appeared much lighter than the Si layers. These images clearly demonstrate that the growth of Ge2ML, Ge3ML, and Ge5ML [Figs. 1(a)–1(c)] heterostructures occurs via the FvdM mechanism: the thickness of the Ge layer is uniform together with Si spacer layers also following a layer-by-layer growth mode. The interface roughness and the Ge layer thickness were determined using HR HAADF STEM and the two images of Ge2ML and Ge5ML heterostructures are shown in Figs. 2(a) and 2(b). The Ge layer thickness variations estimated from HRSTEM images were 1 ML at the top and bottom of Ge/Si interfaces. These measurements demonstrate excessive thicknesses of the Ge layers relative to the estimations from the growth parameters, and all these data are presented in Table I. A close inspection of all Si/Ge interfaces in these samples demonstrates the absence of MDs. The lattice mismatch between Si and Ge is compensated by the tetragonal distortions and all interfaces remain flat. The intensity profiles obtained from Ge2ML, Ge3ML, and Ge5ML samples contain a similar peculiarity and one of the profiles obtained for the Ge3ML sample is presented in Fig. 3. The right shoulder, which corresponds to the upper interfaces of Ge, is 0.6–0.7 times wider than the left one, indicating a large roughness of the upper Ge interfaces.
Low magnification HAADF images of heterostructures: (a) Ge2ML, (b) Ge3ML, (c) Ge5ML, (d) Ge7ML, (e) Ge10 ML, and (f) Ge12 ML.

HAADF HR images of heterostructures: (a) Ge2ML and (b) Ge5ML.

Structural data obtained by STEM and XRR.

The image intensity profile obtained across the heterostructure for the Ge3ML sample.

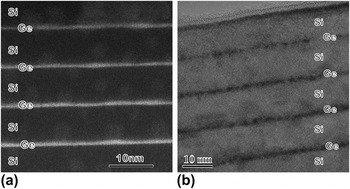
In the Ge7ML heterostructure the morphology of the Ge layer is different [Fig. 4(a)]: Thickness variations of the Ge layers became pronounced and both interfaces are “wavy” as demonstrated by HAADF HRSTEM imaging. The thickness of the Ge layer determined from these images fluctuated in the range from one to two Ge unit cells (i.e., 0.54–1.08 nm). However, the defects associated with the Ge–Si lattice mismatch were not found neither in the HAADF HR STEM nor in the bright-field HRTEM images [Fig. 5(a)].
HR images of the Ge7ML heterostructure: (a) HAADF STEM and (b) BF TEM.

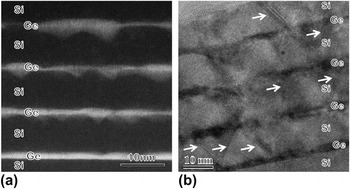
HR images of the Ge12 ML heterostructure: (a) HAADF STEM and (b) BF TEM. SFs are indicated by arrows.

Once the thickness of the Ge layer reaches 10 ML (1.42 nm according to TEM data), the morphology of the heterostructures changes again: The SK mechanism of the film growth can be seen in the Fig. 1(f), where all the Si–Ge interfaces (except for the Ge/Si buffer) are not flat, and inverted pyramids appear at the bottom of the Ge layers [Figs. 1(e) and 1(f), Fig. 4(b)]. The dimensions and density of inverted pyramids in the layers increase toward the surface of the heterostructures. The shape of the pyramids was of various types: Some of them were covered with truncated pyramids and they look like jeweler diamonds, and in most cases the upper part had brighter contrast. The shape of these hut islands is very close to the ones described by Schülli et al.Reference Schülli, Vastola, Richard, Malachias, Renaud, Uhlík, Montalenti, Chen, Miglio, Schäffler and Bauer31 for the Ge islands formed on the substrate with pits. The thinner parts of the Ge layer were not completely flat. We observed staggering of the Ge layer within 2–3 unit cell parameters. The defects such as stacking faults (SFs), twins and MDs, release the strains. These defects were studied in BF HRTEM mode [Fig. 5(b)]. The Ge/Si lattice misfit was accommodated by:
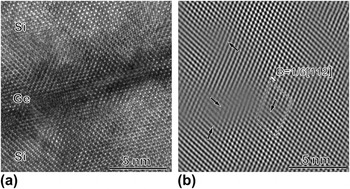
(i)The formation of a 60º dislocations with Burgers vector a/2 < 011>. On the BF HREM image these dislocations were found at the Si/Ge interfaces having the projection of Burgers vector B = 1/6 < 112> and one example is shown in Fig. 6(a). The (111) extra plane is clearly visible in the HREM image after Fourier filtering with a mask around the (111) reflections [Fig. 6(b)].
(ii)The second mechanism of misfit accommodation was the formation of SFs and twins accompanied by dislocations with the same Burgers vector projection (B = 1/6 < 112>) in the Ge12ML heterostructures. BF HRTEM images demonstrate that Ts and SFs threaded one or two (Si + Ge) layers of the heterostructure, but in most cases, these defects were terminated at the Si/Ge interface.
(a) BF HRTEM image of the Ge10 ML heterostructure and (b) filtered image. The cores of dislocations with the projection of Burgers vector b = a/6[112] are indicated by arrows.

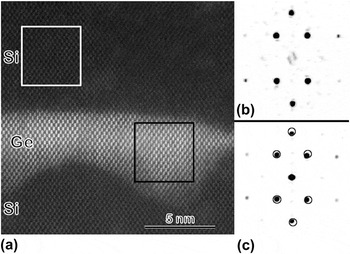
We estimated the density of defects from the BF TEM images to be ∼3 × 1013cm−2 in the Ge10 ML heterostructure and become three times higher (up to 1014cm−2) in the Ge12ML heterostructure. The lowest defect density in that sample was found in the Ge layer closest to the substrate, while in all other layers the defects density was nearly the same. The HAADF HR STEM image of an inverted pyramid is presented in Fig. 7(a) along with fast Fourier transforms (FFT) obtained from the Si spacer layer [Fig. 7(b)] and the pyramid [Fig. 7(c)]. The shift of Ge reflexes relative to the Si ones was observed, and its value depends on the position of FFT frame in the Ge layer: it was slightly lager in the areas close to the top of the Ge layers.

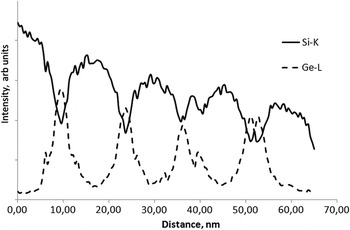
The EDXS profile obtained for the Ge12ML in the direction of the growth is presented in Fig. 8. Surprisingly, the profile across the inverted pyramid sometimes exhibited not only one but two maxima. The peak splitting could be caused by superimposition of the staggered Ge layer along the direction parallel to the electron beam.
The EDXS profile obtained for the Ge12ML [see Fig. 1(f)] in the direction of the growth.

B. X-ray reflectivity
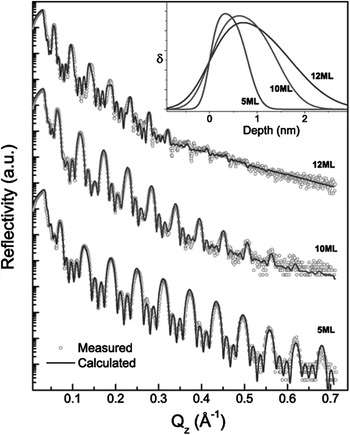
Experimental XRR curves consist of diffraction peaks due to Si/Ge layers' pair periodicity together with short-period oscillations determined by the complete heterostructure thickness (Fig. 9). A typical feature of the XRR curves is a different number of thickness oscillations between the diffraction peaks of different orders. Initially, such an effect was associated with the heterostructure a periodicity or omission of some layers. Subsequent theoretical analysis of the experimental data together with the TEM data demonstrated that this effect was caused by the Ge surface layer, which could have a lower electron density and consisted of oxide layer having a thickness of ∼3.5 nm. Another peculiarity of the XRR curves is a decrease of the intensity of higher order diffraction peaks with an increase of thickness of Ge layers. The diffraction peaks were blurred due to the increase of the diffuse scattering component caused by the formation of pronounced relief at the interfaces or by diffusion of Ge into the spacer layers. This was taken into account in the theoretical simulations by introducing a transition layer at the interfaces with a normal distribution of electron density. The theoretical and experimental curves along with their corresponding electron density distributions in Ge layers are presented in Fig. 9. Quantitative results of XRR data analysis are shown in Table I. The thicknesses of transition layers on the top and bottom of the Ge layers calculated for Ge2ML, Ge3ML, Ge5ML, and Ge7ML heterostructures were found to be almost equal. For the other samples, namely Ge10ML and Ge12ML, an increase was observed in the thickness of the bottom transition layers to 1.26 and 2.16 nm, correspondingly.
Experimental (dots) and best fit (lines) XRR curves for Ge5ML, Ge10ML and Ge12ML heterostructures. The inset is the electron density profile for a single Ge layer.

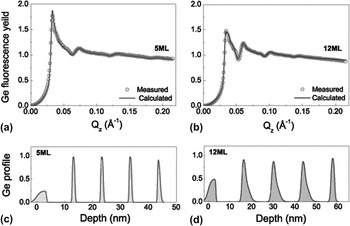
The XSW angular dependence of the Ge fluorescence yield demonstrated high phase sensitivity depending on the layer thickness even for the Ge3ML heterostructure, which is displayed as a specific modulation in a range of superlattice diffraction peaks [Figs. 10(a)–10(b)]. Detailed analysis of experimental data revealed depth distribution profiles of Ge. A symmetric profile for Ge distribution was observed for the Ge5ML heterostructure with a typical thickness for the transition region at the top and bottom interfaces was about 0.5 nm [Fig. 10(c)]. In contrast a sharply asymmetrical profile of Ge distribution with a strong broadening of the bottom interface was found in the Ge12ML heterostructure [Fig. 10(d)].
Experimental and calculated XSW curves for: (a) Ge5ML and (b) Ge12ML heterostructures. Ge depth distribution profile in: (c) Ge5ML and (d) Ge12ML.

C. Photoluminescence
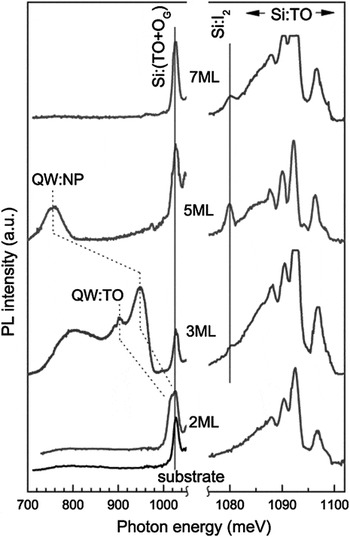
PL spectra of the investigated Ge2ML to Ge5ML heterostructures are shown in Fig. 11. The Si substrate spectrum is presented in the left part of Fig. 11 for comparison. Since the characteristic diffusion length of exitons in Si is about 0.1 mm, PL spectra demonstrated lines from Ge and Si layers together with lines from the buffer layer and the substrate. The TO line, which is caused by recombination radiation of free excitons (with an energy E = 1097 meV) and associated exciton (E = 1093 meV) lines of Si is shown together with lines of the associated multi-exciton complex (E < 1093 meV) in the right side of Fig. 11. The emission lines of bound excitons consisted of two optical phonons - a cross phonon TO and a phonon in the center of the Brillouin zone OG [line Si: (TO + OG)] and these lines are shown in the left side of Fig. 11. We observed two lines, designated as QW:NP and QW:TO, which are the phonon free line of the exciton emission and TO-phonon replica of the Ge wetting layer, respectively. The increase of the Ge layer thickness led to the shift of these lines toward lower energies due to the reduction of the hole quantization energy in the quantum well formed by the layer in the valence band. Once d nom was increased, the intensity of the phonon line QW:TO was reduced compared to the intensity of the zero-phonon line. The QW:TO line was not observed in the Ge5ML sample and a possible reason was the poor spectral sensitivity of the detector in the range of photon energy E < 750 meV. The TO-line was split into two lines with E = 58 meV and E = 48 meV for the Ge3ML heterostructure. These energies correspond to phonons TOSi–Si and TOSi–Ge in Si.Reference Sturm, Manoharan, Lenchyshyn, Thewalt, Rowell, Noël and Houghton32 With increasing the Ge layer thickness, the TOSi–Si component decreases compared to the TOSi–Ge component. The TOSi–Si component was not observed for the Ge layer thickness d nom ≥ 3 ML. For the Ge3ML heterostructure broad emission lines are observed for E = 750–850 meV. Since the PL from the wetting layer of Ge and from Ge islands was observed only at T g > 620 °C,Reference Stoffel, Denker, Kar, Sigg and Schmidt33 we assume that these lines are related to the presence of point defects. The high density of point defects is revealed by the presence of a narrow peak (its half-width of 1–3 meV) at an energy of 1080 meV for the structures with d nom from 3 to 7 ML. It is well-known that this line (I2 in Fig. 11) appears because of defects in silicon related to the presence of boron.Reference Thonke, Weber, Wagner and Sauer34 With d nom > 7 ML the PL from Ge layers almost disappears.
PL spectra of Ge2ML, Ge3ML, Ge5ML, and Ge7ML heterostructures. Notations of the peaks are in the text of the paper.

IV. DISCUSSION
EM, XRR, and XSW data demonstrate that the growth of Ge2ML to Ge5ML layers and the Si spacer layers follows the FvdM growth mechanism, forming atomically smooth interfaces between the layers. The crystal lattice of Ge thin layers is tetragonally distorted by the underlying Si substrate. Strain is most likely relaxed via a substantial chemical intermixing process taken place at the Ge/Si interface. According to our data, it could occur in 1–3 MLs and may cause the difference in the observed and predicted thickness of the layers. Atomic steps (1 ML thick) at both sides of the interfaces were found by STEM, which is in agreement with XRR and XSW data and indicates that the thickness of the intermediate (intermixing) layer does not exceed 0.6 nm. Upper interfaces of Ge layers are slightly thicker due to some roughness of the interfaces below. The PL spectra demonstrate the increase of point defects in the heterostructures starting from thinner Ge layers (Ge3ML) and up to the thickest one (Ge12ML). The high energy part of the PL spectra for Ge2ML is similar to that of the Ge5ML sample. The fluctuations of thickness give rise to inhomogeneous broadening of the peaks in the PL spectra. With increasing dnom to 3 ML, the half-width of QP-NP increased from 21 to 46 meV (Fig. 9). The behavior of TO and NP components in the PL spectra of Ge layers with various thickness can be explained on the basis of results by Leitão et al.Reference Leitão, Fonseca, Sobolev, Carmo, Franco, Sequeira, Burbaev, Kurbatov, Rzaev, Pogosov, Sibeldin, Tsvetkov, Lichtenberger and Schäffler13 and Sturm et al.Reference Sturm, Manoharan, Lenchyshyn, Thewalt, Rowell, Noël and Houghton32 In the conduction band the height of the barrier caused by the strained wetting layer of Ge is rather small and even decreases after the formation of a mixed Si1−xGex intermediate layer.Reference Van de Walle and Martin35 The direct excitons in such layers could tunnel through the barrier reaching the maximum of the electron and hole density in the center of the Ge layer. The exciton Bohr radius is larger than the thickness of the layers in all studied heterostructures. When the thickness of the layers is less than 3 ML (see Fig. 9), the exciton wave function penetrates significantly into the neighboring Si layers and the TOSi−Si phonon mode was preferred. With increasing Ge layer thickness, the exciton wave function penetrates less and less into the Si layers, resulting in the dominance of the TOSi–Ge phonon mode over the TOSi-Si one. With further increase of the Ge layer thickness, the TOGe–Ge phonon mode dominates the spectra (Ge5ML heterostructure). For the same reason, the QP-NP peak in PL spectra becomes more intense than the QP-TO peak.
The Ge layer growth mechanism changes to SK for the Ge7ML heterostructure. HAADF STEM data demonstrate “wavy” interfaces and the Ge layer thickness changed by a factor of 2. However, the defects like MDs, twins and SF were not found in the heterostructure and the stress could be realeased through the tetragonal distortions together with surface topography and Si/Ge intermixing of the layers. The lattice of Ge remains tetragonally distorted and that promotes subsequent layer by layer growth of the Si spacer (FvdM growth mechanism). XRR and XSW study and simulations revealed the increase of interface roughness to more than 0.6 nm. The PL spectra of that sample are significantly different, especially in the low energy region, also confirming the changes of the growth mechanism.
A further increase in the thickness of Ge layers to more than 7 ML caused the appearance of MDs, twins and SFs at the Si/Ge interfaces. This led to stress relaxation in the Ge layers and changes in growth mechanism from FvdM to SK. Sequentially, the growth mechanism of the Si spacer layers switched to SK. The appearance of SFs and twins enhanced the roughness of the Si spacer layer surfaces during their growth: the growth rate of Si along <001> and <221> differs by a factor of 10.Reference Csepregi, Kennedy, Mayer and Sigmon36 That was the reason for the appearance of faceting on the surface of the spacer layers and inverted Ge pyramids formation. The growth temperature was low and that causes the smoothing of the subsequent Ge layer surface, so that the inverted pyramids were formed. The preferential nucleation of Ge islands at the bottom of the artificial pits was found by Chen et al.Reference Chen, Lichtenberger, Bauer, Jantsch and Schaffler37 and Grydlik et al.Reference Grydlik, Brehm, Hacki, Groiss, Fromherz, Schäffler and Bayer38 The roughness of bottom interfaces was increasing from 1.26 to 2.16 nm for Ge10 ML and Ge12 ML heterostructures, respectively. We associate this effect with the increase of Si–Ge lattice mismatch due to the stress release for the thicker Ge layers and the increasing unevenness on the top surface of the Si layers.
The significant decrease of the size and changes in the shape of the nanoislands of Ge grown at T g = 600 °C and covered by layers of Si at T s = 550–600 °C was observed by TEM,Reference Schmidt, Denker, Eberl, Kienzle and Ernst39,Reference Schmidt and Eberl40 as well as by AFM.Reference Zhong, Stangl, Schäffler and Bauer41 In our case, however, the smoothing effect is more noticeable because of the low growth temperature (T g = 300 °C) limiting the mobility of adatoms.
The interface between Si and first Ge layer in 10 and 12 ML samples was always smooth and that indicated that the Si–Ge intermixing mechanism was not the reason for the formation of inverted pyramids. As was discovered by Soo et al.,Reference Soo, Kioseoglou, Huang, Kim, Kao, Peng, Kuan and Cheng17 due to the formation of the MDs, samples with a larger Ge layer thickness tend to have lesser extent of the Si–Ge intermixing. We observed an increase of inverted pyramid dimensions and their density in the 12 ML sample relative to 10 ML sample which was another indication that intermixing was unlikely the mechanism of inverted pyramid formation.
V. SUMMARY
A comprehensive study of the structural, morphological and optical properties of multilayer Si/Ge heterostructures grown by MBE at a temperature T g = 300/450 °C was performed. For the Ge layer of thicknesses up to 1 nm the formation of heterostructures occurs through the FvdM mechanism. Further increase of the Ge layer thickness up to 1.1 nm leads to a change of the Ge layer morphology and growth mode to SK causing the formation of 60° MDs, SFs and twins, and the change of the Si surface morphology and switching of the Si spacer growth mechanism to SK. These growth changes results in the formation of the inverted Ge pyramids. An explanation of the influence of the observed structural peculiarities on the PL spectra of the heterostructures is given.
ACKNOWLEDGMENTS
This work was partially supported by RFBR Grant No. 09-02-12 207-ofi_m(a,b), as well as State Contract No. P546(c). The authors are grateful to Prof. M. Aindow for fruitful discussions and support.