INTRODUCTION
In recent years, parasites have been recognized as an important component of global biodiversity (Poulin and Morand, Reference Poulin and Morand2004). Given the integral roles played by parasites in natural ecosystems, identifying hotspots of high parasite diversity, as well as areas of relatively low parasite diversity, is crucial for a complete understanding of the functioning of the biosphere. However, there are now too many parasite species to identify by too few remaining systematists (Brooks, Reference Brooks2000). As parasites can only be studied after their host species are known to science, good estimates of parasite biodiversity for any geographical area always lag behind those of their hosts (Poulin and Morand, Reference Poulin and Morand2004). There have been a few attempts to extrapolate total diversity of certain taxa of parasites in certain taxa of host species in given geographical areas (Cribb, Reference Cribb1998; Pérez-Ponce de León, Reference Pérez-Ponce de León2001; Pérez-Ponce de León et al. Reference Pérez-Ponce de León, García-Prieto and Razo-Mendivil2002; Poulin, Reference Poulin2004) and on a global scale (Poulin and Morand, Reference Poulin and Morand2004). These studies have focused on metazoan parasites and they reinforce the importance of several international initiatives calling for more extensive documentation of parasite biodiversity (Brooks, Reference Brooks2000; Brooks and Hoberg, Reference Brooks and Hoberg2000; Pérez-Ponce de León, Reference Pérez-Ponce de León2001; Poulin and Morand, Reference Poulin and Morand2004).
This study focuses on the diversity of the metazoan parasites of fishes from Latin America and the Caribbean. This region stretches from Mexico in the north, to Tierra del Fuego at the southern tip of South America, including 42 countries and territories and an extraordinary biological wealth. Biogeographically, this region includes the whole Neotropical Region, the southern part of the Neartic region, and 2 transition zones (Mexican and South American). Also, the subdivision of Latin America and the Caribbean into 70 biogeographical provinces reveals its intrinsic complexity (Morrone, Reference Morrone2004, Reference Morrone2005). Latin America and the Caribbean also include 6 (Brasil, Colombia, Ecuador, Mexico, Peru, Venezuela) of the 17 so-called megadiversity countries, and 8 of the 34 recognized biodiversity hotspots, adding up to 40% of the total plant and animal species on the planet (Heywood, Reference Heywood1995). This high biodiversity is reflected also in the ichthyiological fauna, with the inclusion of regions with the highest number of known species of fishes on the planet and with a high degree of endemism, e.g. Amazon, Orinoco, and some Mexican river basins. In addition, the region studied is home to the world's largest wetland, the Pantanal, which covers 3 countries (Brasil, Bolivia, and Paraguay). High biodiversity also characterizes the marine fish fauna from the Pacific and Atlantic Ocean in the studied region. The waters off Chile and Peru support one of the top 5 commercial fisheries, and the world's fastest growing fishery is off the coast of Argentina and Uruguay (Anon, 2000a).
In sharp contrast, estimates of the biodiversity of the region suggest that the number of free-living animal species that have been described is very low, e.g. 16·7% in Brasil (Anon, 2003). Currently, the biodiversity of marine and freshwater ecosystems of Latin America and the Caribbean is threatened, mainly by environmental problems resulting from the degradation of the ecosystems. In this context, parasite biodiversity can be very important because parasitism plays key roles in ecosystems, regulating the abundance or density of host populations, stabilize food webs and structuring animal communities (Poulin and Morand, Reference Poulin and Morand2004). Thus, a good knowledge of parasite diversity and whether or not it is declining is crucial for environmental management and conservation (Poulin, Reference Poulin2004).
Early parasitological studies of Latin American and Caribbean fishes date back to the 19th century, and were initially the result of naturalist expeditions into given territories (e.g. Diesing, Reference Diesing1850; Krøyer, Reference Krøyer1863; Heller, Reference Heller1865; Bouvier, Reference Bouvier1897). For a long time the ichthyoparasitological research in this region was exclusively taxonomic (Vidal-Martínez and Salgado-Maldonado, Reference Vidal-Martinez, Salgado-Maldonado, Salgado-Maldonado, Garcia and Vidal-Martinez2000; Luque, Reference Luque, Ranzani-Paiva, Takemoto and Lizama2004). In the last few decades a remarkable effort has been made to catalogue Latin American and Caribbean fish parasites through numerous regional check-lists, books and compilations including almost all known main groups of parasites (Vidal-Martínez and Salgado-Maldonado, Reference Vidal-Martinez, Salgado-Maldonado, Salgado-Maldonado, Garcia and Vidal-Martinez2000). In the last 12 years in particular, the scope of these contributions has increased significantly (Nahhas and Carlson, Reference Nahhas and Carlson1994; Bunkley-Williams and Williams Jr., Reference Bunkley-Williams and Williams1994; Williams Jr. and Bunkley-Williams, Reference Williams and Bunkley-Williams1996; Boxshall and Montú, Reference Boxshall and Montú1997; Lamothe-Argumedo et al. Reference Lamothe-Argumedo, García-Prieto, Osorio-Sarabia and Pérez-Ponce de León1997; Kohn and Cohen, Reference Kohn and Cohen1998; Moravec, Reference Moravec1998; Young, Reference Young1998; Rego et al. Reference Rego, Chubb and Pavanelli1999; Vicente and Pinto, Reference Vicente and Pinto1999; Kohn and Pinto-Paiva, Reference Kohn, Pinto-Paiva, Salgado-Maldonado, Garcia and Vidal-Martinez2000; Rego, Reference Rego, Salgado-Maldonado, Garcia and Vidal-Martinez2000; Thatcher, Reference Thatcher, Salgado-Maldonado, Garcia and Vidal-Martinez2000, Reference Thatcher2002, Reference Thatcher2006; Vidal-Martínez et al. Reference Vidal-Martínez, Aguirre-Macedo, Scholz, González-Solís and Mendoza-Franco2001; Rodriguez-Ortiz et al. Reference Rodriguez-Ortiz, Garcia-Prieto and Pérez-Ponce de León2004; Caspeta-Mandujano, Reference Caspeta-Mandujano2005; Garrido-Olivera et al. Reference Garrido-Olivera, García-Prieto and Pérez-Ponce de León2006; Kohn et al. Reference Kohn, Cohen and Salgado-Maldonado2006; Salgado-Maldonado, Reference Salgado-Maldonado2006). At the same time, there has been an increase in the number of papers about macroecological (e.g. Timi and Poulin, Reference Timi and Poulin2003; Vidal-Martinez and Poulin, Reference Vidal-Martinez and Poulin2003; Luque et al. Reference Luque, Mouillot and Poulin2004; Takemoto et al. Reference Takemoto, Pavanelli, Lizama, Luque and Poulin2005) and biogeographical aspects (e.g. Pérez-Ponce de León and Chouhdhury, Reference Pérez-Ponce de León, García-Prieto and Razo-Mendivil2002, Reference Pérez-Ponce de León and Choudhury2005; Boeger and Kritsky, Reference Boeger and Kritsky2003; Aguilar-Aguilar et al. Reference Aguilar-Aguilar, Contreras-Medina and Salgado-Maldonado2003; González and Moreno, Reference González and Moreno2005, among others) of fish parasites in Latin America and the Caribbean.
This increased effort toward a compilation and inventory of the fish parasite fauna in Latin America and the Caribbean allows qualitative and quantitative analyses of the level of our knowledge of parasite biodiversity in the region, using fish parasites as indicators. Here, we examine the known parasite diversity of fishes from Latin America and the Caribbean. We determine how the distribution of metazoan parasite diversity varies as a function of the habitat, aiming at an assessment of the current status of parasitological studies in fishes from the region. In addition, we compared the richness and composition of the parasite fauna among 3 subregions (Brasil, Mexico and the Caribbean) selected as potential hotspots because of their high number of recorded host-parasite associations, high host biodiversity and because also they have been well studied; these analyses allow the detection of the possible influence of local factors on known parasite diversity and on parasitological research.
MATERIALS AND METHODS
The data set used here included all known metazoan parasite species from freshwater and marine fishes in Latin America and the Caribbean. The following parasite taxa were included: Monogenea, Aspidogastrea, Digenea, Cestoda, Acanthocephala, Nematoda, Pentastomida, Mollusca (larvae or glochidia of certain bivalve taxa), Hirudinea, Copepoda, Branchiura and Isopoda. The data set resulted from a combination of 3 approaches. First, a search was performed through the Zoological Records and CAB Abstracts databases up to August 2006. Electronic versions of these databases were reviewed from 1978 (Zoological Record) and 1989 (CAB Abstracts) onwards, using several combinations of key words. Second, monographs as well as articles published in Spanish or Portuguese, not covered by the electronic databases but known to the authors, also contributed entries into the data set. Third, in the case of helminths, copepods and branchiurans, information provided in Yamaguti's series of monographs (Yamaguti, Reference Yamaguti1959, Reference Yamaguti1961, Reference Yamaguti1963a, Reference Yamagutib, Reference Yamagutic, Reference Yamaguti1971) was also used to supplement the searches with older records. The complete list of references used to generate the data set is available upon request from the authors. All these sources of information allowed the creation of a data set in which each entry was a host-parasite record, i.e. a known association between a parasite species and a fish species. Parasitological records from hosts identified only by their common name, or without specific mention of the host species, were not included. Several synonymies in the nomenclature of parasite species were detected during the searches and, where possible, species names from the most recent taxonomic literature were adopted. The possibility remains that some parasite species were incorrectly identified in the original surveys; since our analyses focus on species richness, however, errors of identification or taxonomy have little bearing on our results.
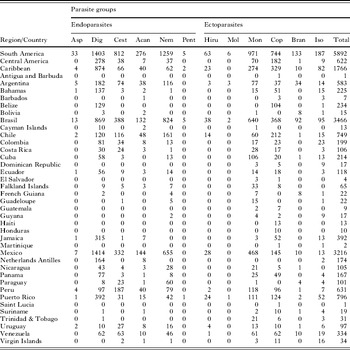
Latin America and the Caribbean include 42 countries and territories, 37 of them with fish parasite records (see Table 1). Parasitological information for Caribbean countries and territories include strictly data from the islands themselves and their coastal areas. Some countries such as Colombia, Venezuela and Mexico have a coast on the Caribbean Sea, but their parasitological records were lumped with the country's data and not treated as Caribbean data. The Florida peninsula and Bermuda, both regions with a fish fauna influenced by the Caribbean Sea, were not included in the present study as they were associated with North America.
Geographical distribution of host-parasite associations from Latin American and Caribbean fishes
(Asp. Aspidogastrea, Dig. Digenea, Cest. Cestoda, Acan. Acanthocephala, Nema. Nematoda, Pent. Pentastomida, Hiru. Hirudinea, Mol. Mollusca, Mono. Monogenea, Cop. Copepoda, Bran. Branchiura, Iso. Isopoda.)

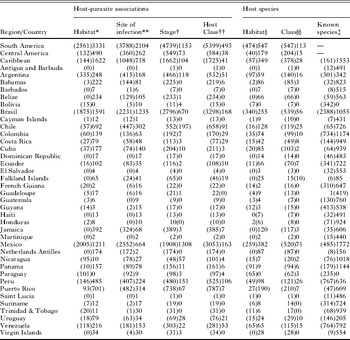
The data set included parasite records from fish species of 2 large taxa, Actinopterygii (ray-finned fishes) and Chondrichthyes (cartilaginous fishes: chimaeras, sharks and rays), and the 2 groups were compared in the analysis. Introduced freshwater species, e.g. cichlids (Oreochromis spp., Tilapia spp.), cyprinids (Carassius spp., Cyprinus spp.) and salmonids (Salmo spp., Oncorhynchus spp.) were excluded, because the parasite fauna of exotic fishes is not necessarily the one they have acquired over evolutionary time in their area of origin. In order to solve numerous cases of synonymies among fish species, valid species names according to FishBase (Froese and Pauly, Reference Froese and Pauly2006) were adopted. In addition to parasite species richness (known number of metazoan parasite species per fish species), the area of origin (i.e. country), habitat (freshwater or marine), and the maximum body length (in cm) of each fish species were recorded. This information was obtained from FishBase (Froese and Pauly, Reference Froese and Pauly2006), although for a number of fish species about which information was missing, length data were obtained from several Museums and fish websites and/or from specific local literature. Data on the total known number of fish species for each country included in Table 2 were extracted from Froese and Pauly (Reference Froese and Pauly2006), although this information might be incomplete because exhaustive inventories of fish species have not been concluded for many countries.
Characteristics of the host-parasite associations and of the fishes from Latin America and the Caribbean

* Number of freshwater (shown in parentheses) and marine parasite-host associations.
** Number of host-parasite associations involving endoparasites (in parentheses) and ectoparasites.
† Number of host-parasite associations involving adult parasites (in parentheses) and larval stages.
†† Number of parasite-host associations in actinopterygian fishes (shown in parentheses) and chondrichthyans.
§ Number of freshwater (in parentheses) and marine fish species in the data set.
§§ Number of actinopterygian (in parentheses) and chondrichthyan species in the data set.
‡ Total known number of freshwater (in parentheses) and marine fish species per region or country. Data from Froese and Pauly (Reference Froese and Pauly2006).
As a measure of the extent of our knowledge about the different fish species, an index of study effort was used, taken as the number of publications on each fish species found in a search of the Zoological Record (1978–2006) electronic database. The Latin names, including all known synonyms, of each species were used as keywords during the searches. This measure of study effort also provides an indirect estimate of the number of fish individuals that were actually examined specifically for parasites (Poulin, Reference Poulin2004). Host sample size is often an important correlate of known parasite species richness (Walther et al. Reference Walther, Cotgreave, Price, Gregory and Clayton1995), and a correction for study effort can serve to control for spurious sampling effects.
The 3 continuous variables investigated here, i.e. parasite species richness, maximum host body length, and study effort, all required log-transformation (log x+1 if zeros were present) to meet the assumptions of parametric statistical tests.
RESULTS
The data set included 10 904 host-parasite associations involving 1660 fish species from Latin America and the Caribbean (mean 6·6±9·6 parasite records per fish species), distributed in 211 families (149 marine and 62 freshwater; and 182 actinopterygian and 29 chondrichthyan families). The data set is available upon request from the authors. The data set shows a predominance of endoparasite associations (7464, mean 4·5±7·2 per fish species) over ectoparasites (3440, mean 2·1±3·7) (paired two-tailed t-test=18·604, P<0·0001). Also, the number of host-parasite associations involving adult parasite stages (8278, mean 5·0±7·1) was higher than those involving larval stages (2626, mean 1·6±4·1) (paired two-tailed t-test=42·459, P<0·0001). These patterns are similar for marine and freshwater fishes.
There are no differences between the number of host-parasite associations in marine (6228 in 977 host species, mean 6·4±8·8) and freshwater fishes (4676 in 683 host species, mean 6·8±10·5) (two-tailed t-test=0·511, P=0·609). However, there is a difference between the actinopterygians (10 185 in 1489 hosts, mean 6·8±9·9) and chondrichthyans (719 in 171 hosts, mean 4·2±4·5) (two-tailed t-test=2·636, P=0·008).
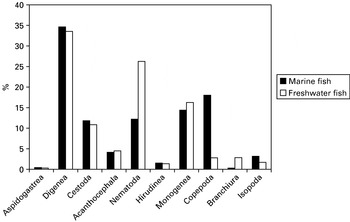
In relation to the main taxonomic groups of fish parasites, the digeneans were the most frequent (34·1%) among all recorded associations. Their higher frequency remains in subsets of marine (34·6%) and freshwater (33·5%) fish species, but not among chondrichthyans where cestodes are the most frequent (51·4%) parasites. Among ectoparasites, monogeneans (15·2%) represent the most frequent group, followed by copepods, though the latter are more frequent in chondrichthyans. In general, the most frequent groups are the digeneans followed by copepods and monogeneans in marine fishes. In freshwater fishes, the digeneans are also the most frequent group followed by nematodes and monogeneans (Fig. 1). Data on the distribution of host-parasite associations among the different countries and regions of Latin America and the Caribbean are detailed in Tables 1 and 2.
Percentage distribution of the host-parasite associations involving fishes from Latin America and the Caribbean among different parasite taxonomic groups. Larvae of Mollusca and Pentastomida (freshwater parasites) are not shown as they only account for a small percentage of all associations (0·1 and 0·9, respectively).

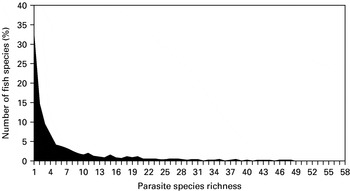
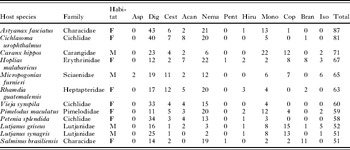
The frequency distribution of parasite species richness values among the 1660 fish species with parasitological records from Latin America and the Caribbean shows clearly that the majority of fish species have between 1 and 4 parasite records (Fig. 2). The highest number of host-parasite associations in the region was recorded for the freshwater fish Astyanax fasciatus (Characidae), which had 87 records. Freshwater fishes included the majority of species among those with more than 50 host-parasite associations recorded (Table 3).
Percentage distribution of parasite species richness values among fish species from Latin America and the Caribbean (N=1660 fish species).

Distribution of host-parasite associations in the fish species with the highest known values of parasite species richness from Latin America and the Caribbean
(Asp. Aspidogastrea, Dig. Digenea, Cest. Cestoda, Acan. Acanthocephala, Nema. Nematoda, Pent. Pentastomida, Hiru. Hirudinea, Mono. Monogenea, Cop. Copepoda, Bran. Branchiura, Iso. Isopoda. F. freshwater, M. marine.)

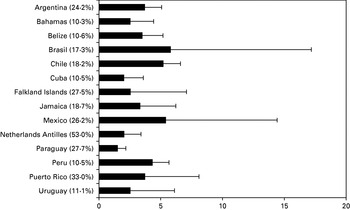
Only 14 of the 37 countries or territories with fish parasite records (Table 1) have had more than 10% of their known fish species surveyed for parasites. Higher percentage values of host species studied were recorded for the Netherlands Antilles and Puerto Rico, though higher mean numbers of host-parasite associations per fish species were reported from Brasil and Mexico (Fig. 3).
Mean parasite species richness (±s.e.) in fishes from countries in Latin America and the Caribbean (percentage of the known fish species with parasitological records in parentheses. Only countries with values higher than 10% were included).

Across all fish species, study effort ranged from 0 to 1892 published studies per fish species, with an average of 27·1. There was only a small difference between marine (average 25·5, 0–1134) and freshwater fishes (29·5, 0–1892). As expected, the number of host-parasite associations is strongly correlated with study effort in marine (r=0·361, N=884, P<0·0001) and freshwater fishes (r=0·441, N=617, P<0·0001). Looking at the relationship between the number of host-parasite associations and the body size of the hosts, using the raw data, a strong correlation was observed among both marine (r=0·205, N=884, P<0·0001) and freshwater fishes (r=0·255, N=617, P<0·0001). When correcting for study effort (taking the residuals of the linear regression between parasite species richness and study effort), this correlation becomes weaker for both marine fish (r=0·065, N=884, P=0·055) and freshwater fish (r=0·154, N=617, P=0·0001).
Brasil, the Caribbean and Mexico were the regions with the highest values of study effort and numbers of host-parasite associations recorded. In order to detect possible quantitative differences in the parasite species richness of fish among these regions, a two-way ANOVA was performed, with regions and habitat (marine or freshwater) as class variables. This revealed differences among regions (F 2,1590=7·677, P<0·0001), and a slight difference between marine and freshwater fishes (F 1,1590=2·931, P=0·087); there was also a significant interaction between these factors (F 2,1590=34·368, P<0·0001). Using the Tukey HSD post-hoc test, it appeared that differences among the regions resulted from a significant difference in fish parasite species richness between Brasil and the Caribbean (P=0·024).
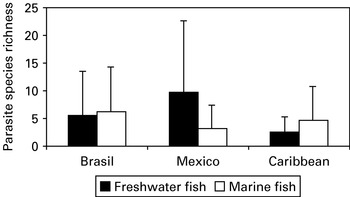
In general, the trends detected in the whole data set of host-parasite associations from Latin American and Caribbean fish were repeated within each of these 3 regions, with few discrepancies probably reflecting regional tendencies in fish parasitology research. With respect to endoparasites only, there was a significant difference in parasite species richness among the 3 regions (two-way ANOVA F 2,1590=17·481, P<0·0001), and between marine and freshwater fishes (F 1,1590=7·043, P<0·001) (see Fig. 4); this came from a significant difference between both Brasil and Mexico versus the Caribbean (P=0·011 and P=0·009, respectively), with no difference between Brasil and Mexico (P=0·997). A similar picture emerged with ectoparasites (Table 2), with strong differences among the 3 regions (two-way ANOVA F 2,1590=13·509, P<0·0001) and between fish habitats (F 1,1590=5·228, P=0·022), and a posteriori Tukey test showing significant differences between Mexico and both Brasil (P<0·0001) and the Caribbean (P=0·001) but not between Brasil and the Caribbean (P=0·975). Differences in mean parasite species richness between marine and freshwater fishes are illustrated in Fig. 4, where Mexico emerges as the only region where parasite richness is higher among freshwater than among marine fishes. Another factor influencing these results may be the significant difference in average host size among the 3 regions (Brasil 65·9 cm±82·4; Mexico 74·9±105·9; Caribbean 92·6±146·6; two-way ANOVA F 2,1439=14·163, P<0·0001), and between marine (86·6 cm±125·2) and freshwater fish species (30·2 cm±37·0) (F 1,1439=346·144, P<0·0001). Tukey a posteriori tests show differences in host size between both Brasil and Mexico versus the Caribbean, but no difference between Brasil and Mexico.
Mean parasite species richness (±s.e.) in fishes from Brasil, Mexico and the Caribbean.

Another interesting comparison is that between the number of host-parasite associations involving either adult or larval stages of parasites. For adult parasites, differences in species richness are more substantial among the 3 regions (two-way ANOVA F 2,1590=7·767, P<0·0001) than between habitats (F 1,1590=3·912, P=0·048). A posteriori comparisons showed that these results came from differences between Mexico and both Brasil (P<0·0001) and the Caribbean (P=0·013), with no difference between Brasil and the Caribbean (P=0·725). For the larval stages, there were differences among regions (two-way ANOVA F 2,1590=54·075, P<0·0001) and between habitats (F 1,1590=61·276, P<0·001), with all pairwise contrasts between regions being significant.
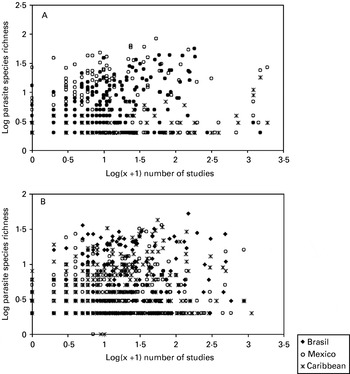
Study effort values also differ among fish from Brasil, the Caribbean and Mexico (F 2,1439=24·859, P<0·0001) but not between habitats (F 1,1439=0·026, P=0·871), although there was an interaction between the two factors (F 2,1439=24·301, P<0·0001). The main difference, indicated by Tukey tests, lies between the Caribbean and Mexico (P<0·0001). These results are not surprising given the clear differences between the mean study effort values in each region for freshwater and marine fishes (Brasil: freshwater fish 26·5±115·6, marine 42·9±97·2; Mexico: freshwater 62·5±239·9, marine 30·0±79·7; Caribbean: freshwater 184·6±402·8, marine 36·4±98·1). There are weak, though significant and positive, correlations between parasite species richness and study effort in marine and freshwater fish species in each of these regions (Fig. 5).
Known parasite species richness as a function of study effort among fish species from Brasil, Mexico and the Caribbean. (A) Freshwater fish (y=0·161x+0·522, r 2=0·075); (B) Marine fish (y=0·120x+0·472, r 2=0·046).

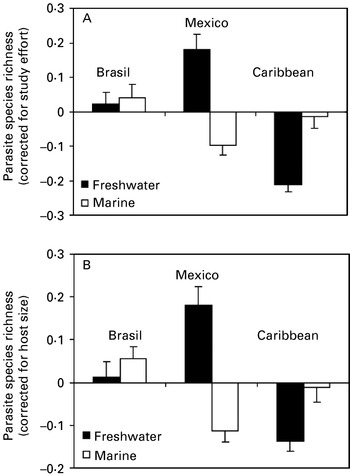
Given the relationships reported above between parasite species richness and both host body size and study effort, it is necessary to control for these factors when comparing the 3 regions. The residuals from regressions of richness against host body size and study effort were therefore used to compare marine and freshwater fishes from Brasil, Mexico and the Caribbean. Species richness corrected for study effort was different among freshwater fishes from the 3 regions (one-way ANOVA F 2,543=22·056, P<0·0001), with a Tukey post-hoc test showing significant differences among all pairs of regions. In marine fishes, there was also a significant difference (F 2,895=12·508, P<0·0001), but the only significant pairwise differences were between Brasil and Mexico (P=0·005) and Mexico and the Caribbean (P=0·0001). When the parasite species richness was corrected using residuals from a regression against host size, a significant difference emerged among the freshwater fish from the 3 regions (one-way ANOVA F 2,543=10·912, P<0·0001), with pairwise differences between Brasil and Mexico (P=0·0001), and Mexico and the Caribbean (P=0·033). The same trend was observed for marine fishes, with overall differences (F 2,894=7·140, P=0·001) resulting from pairwise differences between Brasil and Mexico (P=0·019) and Mexico and the Caribbean (P=0·001) (Fig. 6). Thus, independently of how much they have been studied and how large they are, among freshwater fish species those from Mexico have richer parasite faunas, and among marine fish species those from Brasil have richer parasite faunas (Fig. 6).
Mean (±s.e.) parasite species richness for freshwater and marine fish species from Brasil, Mexico and the Caribbean. (A) Species richness per fish species, where values are residuals from the regression on log-transformed data between parasite species richness and study effort, and are thus values of parasite species richness corrected for study effort. (B) Species richness per fish species, where values are residuals from the regression on log-transformed data between parasite species richness and host body length, and are thus values of parasite species richness corrected for host body size.

Another approach to assess the differences among these 3 regions involves using only the fish species common to all 3 regions, in order to limit the possible influence of host phylogenetic relationships on the differences described above. There are 59 fish species common to Brasil, Mexico and the Caribbean, only 2 of which (Astyanax fasciatus and Poecilia reticulata) occur in freshwater; therefore, this comparison was performed using marine fish species only. The average parasite species richness of these 57 fish species in the 3 regions are: Brasil 7·9±7·8; Mexico 4·7±6·0 and the Caribbean 8·9±9·4. A statistical analysis revealed significant differences between Brasil and Mexico (paired two-tailed t-test=2·566, P=0·013, D.F.=56) and between Mexico and the Caribbean (t=3·682, P=0·001, D.F.=56), but not between Brasil and the Caribbean (t=0·718, P=0·476, D.F.=56). When these analyses were performed using the residuals from the regression between parasite species richness and study effort, different patterns emerged [Brasil-Mexico (paired two-tailed t-test=0·958, P=0·342, D.F.=56), Mexico-Caribbean (t=0·414, P=0·0001, D.F.=56), Brasil-Caribbean (t=2·560, P=0·013, D.F.=56)]. The same is true of analyses controlling for host size, again using residuals from a regression [Brasil-Mexico (paired two-tailed t-test=0·050, P=0·961, D.F.=56); Mexico-Caribbean (t=2·611, P=0·012); Brasil-Caribbean (t=2·109, P=0·040, D.F.=56)]. These results based on corrected species richness values indicate that, after controlling for potentially confounding variables, fish populations of the same species tend to harbour more parasites in the Caribbean than in the other two regions.
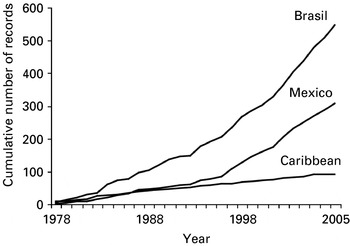
As shown in Fig. 7, there has been an increase in the number of publications on fish parasitology in Brasil, Mexico and the Caribbean since 1978. There appear to be differences in research trends among the 3 regions, with steep increases in new records having occurred from the late 1980s or early 1990s in Brasil and Mexico, but not in the Caribbean.
Cumulative number of published records of fish parasites as a function of time for Brasil, Mexico and Caribbean fish. Numbers of records for each year were obtained from the Zoological Record (1978–2006) electronic database.

DISCUSSION
One of the main steps toward conservation of biodiversity requires systematic inventories (Anon, 2000b), and parasites have only recently been included in this evaluation of biodiversity (Poulin and Morand, Reference Poulin and Morand2004). Therefore, it is not surprising that the parasite faunas of large areas of the planet are grossly underestimated components of their biodiversity (Poulin, Reference Poulin2004). For fishes, the situation is peculiar: on the one hand, fish are the group of hosts with the best-known parasite faunas, while on the other hand, they are the vertebrate group with the highest estimated number of unknown species, mainly in Neotropical ecosystems where current estimates indicate that the majority of fish species are yet to be described (Anon, 2003). For instance, a look at the percentage of known fish species for which parasites have been recorded in the megadiversity countries from Latin America and the Caribbean (Brasil 17·3%, Colombia 5·7%, Ecuador 7·2%, Mexico 26·2%, Peru 10·5% and Venezuela 8·3%), we get a clear indication that the total parasite biodiversity of fishes from the whole region is grossly underestimated.
When comparing Latin America and the Caribbean with other previously studied regions, this tendency is clearer. Poulin (Reference Poulin2004) examined the parasite species richness of actynopterygians of Canada and New Zealand with an approach similar to that used here. In these two countries the total numbers of host-parasite associations recorded are lower than in Latin American and Caribbean fishes, but the mean parasite species richness of the latter fishes (6·8) is clearly lower than in Canada (15·6), and not much higher than New Zealand (5·2). The parasite biodiversity of Canadian fish species is possibly the best known in the world (McDonald and Margolis, Reference McDonald and Margolis1995), and the percentage of known Canadian fishes for which parasites have been recorded is quite high (42·5%) out of a total of 805 fish species catalogued by Froese and Pauly (Reference Froese and Pauly2006). This confirms that our knowledge of the parasite biodiversity of Latin American and Caribbean fishes is still in its infancy.
Given the continental dimension of the region studied, its high biodiversity and the high heterogeneity in study effort across countries, 3 regions were selected in order to search for possible patterns in the distribution of parasite diversity. Brasil, the Caribbean Islands and Mexico are the regions with the most parasitological studies of fish. Brasil and Mexico are considered megadiversity countries, and the Caribbean islands are considered a biodiversity hotspot for plants and animals (Heywood, Reference Heywood1995). These regions have high fish species biodiversity and peculiar biogeographical characteristics. Brasil is the country with the largest area of exclusively Neotropical territory, and is the principal home of the Amazon river basin which has the highest freshwater fish biodiversity on the planet. In terms of marine ecosystems Brasil possesses the longest littoral in the south Atlantic Ocean, with the highest biodiversity in the region. Mexico is a region with complex biogeographical patterns (Morrone, Reference Morrone2005). Its position in the transition zone between the Neotropical and Nearctic regions not only contributes to its high biodiversity but also raises interesting biogeographical questions regarding faunal exchange, particularly with respect to its diverse fish fauna (Pérez-Ponce de León and Choudhury, Reference Pérez-Ponce de León and Choudhury2005). The Caribbean hotspot consists mainly of 2 large groups of islands, the Lesser Antilles and the Greater Antilles (Puerto Rico, Jamaica, Cuba, and Hispaniola, which includes the Dominican Republic and Haiti). While the hotspot spans more than 4 million square kilometers of ocean, the 4 islands of Cuba, Hispaniola, Jamaica and Puerto Rico make up around 90% of the land area (information extracted from www.biodiversityhotspots.org). In addition, 2 of these 3 large regions are home to classical parasite schools of helminth taxonomy under the original leadership of Lauro Pereira Travassos (Brasil) and Eduardo Caballero y Caballero (Mexico) and collaborators, whose work has resulted in the foundation of 2 major parasite species collections (Coleção Helmintológica do Instituto Oswaldo Cruz in Brasil, and Colección Nacional de Helmintos in Mexico) (Lamothe-Argumedo et al. Reference Lamothe-Argumedo, García-Prieto, Osorio-Sarabia and Pérez-Ponce de León1997; Noronha et al. Reference Noronha, Frisso and Mattos2003).
We found no differences in parasite species richness between marine and freshwater fishes, with most parasite-host associations involving actinopterygian fishes, endoparasites (mainly digenean) and parasites at the adult stage. However, not all of these patterns remained when we focused on the 3 selected regions mentioned above. No significant differences were found in the general parasite richness between Brasil and Mexico, and the parasite species richness in these countries was higher than in the Caribbean. Nevertheless, Mexico is the only country where the number of host-parasite associations in freshwater is higher than in marine fishes. Brasil is the country with the highest biodiversity of freshwater fish in the region (freshwater fish represent 69·4% of the total fish species known) while Mexico (with 19·0%) and the Caribbean (with only 9·4%) showed a proportionally much lower biodiversity. However, the percentage of known freshwater species for which parasites have been recorded is higher in Mexico (53·4%) than Brasil (14·2%) and the Caribbean (35·4%); thus, these differences may originate from differences in the intensity of parasitology surveys in each region. Prior to the work of Lamothe-Argumedo et al. (Reference Lamothe-Argumedo, García-Prieto, Osorio-Sarabia and Pérez-Ponce de León1997), the majority of parasite records in Mexico were on marine fishes. However, since the first compilation of helminth parasites of freshwater fishes by Pérez-Ponce de León et al. (Reference Pérez-Ponce de León, García-Prieto, Osorio-Sarabia and León-Regagnon1996), numerous studies have followed, with inventories of the parasites in species from many families of freshwater fish, e.g. Cichlidae, Goodeidae, and Ictaluridae (Vidal-Martínez et al. Reference Vidal-Martínez, Aguirre-Macedo, Scholz, González-Solís and Mendoza-Franco2001; Pérez-Ponce de León and Choudhury, Reference Pérez-Ponce de León and Choudhury2002; Mejia-Madrid et al. Reference Mejía-Madrid, Domínguez-Domínguez and Pérez-Ponce de León2005) and from different river basins (Salgado-Maldonado et al. Reference Salgado-Maldonado, Cabañas-Carranza, Caspeta-Mandujano, Soto-Galera, Mayén-Peña, Brailovsky and Baéz-Valé2001a, Reference Salgado-Maldonado, Cabañas-Carranza, Soto-Galera, Caspeta-Mandujano, Moreno-Navarrete, Sánchez-Nava and Aguilar-Aguilarb, Reference Salgado-Maldonado, Mercado-Silva, Cabañas-Carranza, Caspeta-Mandujano, Aguilar-Aguilar and Íniguez-Dávalos2004a, Reference Salgado-Maldonado, Cabañas-Carranza, Soto-Galera, Pineda-López, Caspeta-Mandujano, Aguilar-Castellanos and Mercado-Silvab, Reference Salgado-Maldonado, Aguilar-Aguilar, Cabañas-Carranza, Soto-Galera and Mendoza-Palmero2005). These also included analyses of biogeographical patterns using large databases of freshwater fish parasites (e.g. Aguilar-Aguilar et al. Reference Aguilar-Aguilar, Contreras-Medina and Salgado-Maldonado2003; Pérez-Ponce de León and Choudhury, Reference Pérez-Ponce de León and Choudhury2005). Recently, a full compilation of the parasitological records in Mexican freshwater fish has been published (Salgado-Maldonado, Reference Salgado-Maldonado2006).
A similar picture emerges in relation to marine fish parasites, with Brazil showing the highest number of host-parasite associations per fish, when the effect of confounding variables is taken into account. This may reflect the recent increased effort in the study of Brasilian fish parasites (see Luque, Reference Luque, Ranzani-Paiva, Takemoto and Lizama2004; Luque et al. Reference Luque, Mouillot and Poulin2004). Interestingly, when the focus shifts to the subset of marine fish species common to all 3 regions, it is in the Caribbean region that parasite species richness per fish is highest. The parasites of Caribbean marine fishes have been the subject of numerous monographs on the taxonomy of digeneans, copepods and isopods, with many classical papers (e.g. Sogandares-Bernal, Reference Sogandares-Bernal1959; Siddiqi and Cable, Reference Siddiqi and Cable1960; Nahhas and Cable, Reference Nahhas and Cable1964; Fischthal, Reference Fischthal1977) supplemented by the recent monograph by Williams Jr. and Bunkley-Williams (Reference Williams and Bunkley-Williams1996) and numerous papers on marine copepods. So is the biodiversity of parasites of marine fishes higher in Brasil, or in the Caribbean? Identifying hotspots of parasite biodiversity is not straightforward, since the localized activity of a few dedicated parasitologists can generate apparent foci of diversity.
The relative contribution of adult and larval parasites to total parasite diversity is also interesting. Known host-parasite associations include a higher frequency of adult stages, but still confirm the importance of larval stages as components of fish parasite communities (see Luque and Poulin, Reference Luque and Poulin2004). The presence of helminth larvae in fishes is particularly high in freshwater fishes from Mexico, perhaps reflecting the great study effort on fish parasites at intermediate levels in food webs (see papers cited above).
We used values of parasite species richness corrected for both host body size and study effort. Host body size is often a better predictor than other host traits of how many parasite species are harboured by a host species, but it is not always a reliable predictor (Poulin, Reference Poulin1997; Morand, Reference Morand, Poulin, Morand and Skorping2000). In Latin America, two studies have performed a comparative analysis of parasite diversity in fish with a correction for host phylogeny; host body size was not a good predictor of parasite species richness in either study. Luque et al. (Reference Luque, Mouillot and Poulin2004) found that, across marine fishes from Rio de Janeiro, Brasil, parasite species richness correlated with host size when considering all parasites but not when endoparasites and ectoparasites were analysed separately. Takemoto et al. (Reference Takemoto, Pavanelli, Lizama, Luque and Poulin2005) did not find a correlation between parasite species richness and host body size among fishes from Upper Paraná River, Brasil. In the present study, host body size proved to be a good predictor of parasite species richness because strong positive correlations were detected across all fish species studied in Latin America and the Caribbean, and within various subsets of fish from different habitats or areas of origin (country). Moreover, clear differences between the size of marine and freshwater fish species did not influence the comparison of parasite richness between these 2 groups of hosts.
As a rule, the number of known parasite species per fish species also increased with study effort in Latin American and Caribbean fishes. When analysed separately for each of the 3 regions selected for comparison, this relationship is weaker than in the overall correlation, mainly among freshwater fishes. This is because Caribbean freshwater fishes have been the subjects of intense study effort, mostly seen as a high number of publications about a few taxa of freshwater fish. In any event, the differences in parasite species richness among the 3 regions remained after correction of parasite species richness using residuals from the respective regressions against host body size and study effort.
Another possible confounding influence might come from the different phylogenetic origins of the Brazilian, Mexican and Caribbean fish fauna. Closely related host species are likely to harbour a similar number of parasite species, and possibly taxonomically-related parasite species, because these were inherited from a recent common ancestor; it is important to take phylogenetic relationships into account when trying to determine which host features are associated with the parasite faunas (Poulin, Reference Poulin1997; Morand, Reference Morand, Poulin, Morand and Skorping2000). This study assesses and compares the mean parasite species richness in fish species of different areas and not the specific effects of host traits. Still, in the comparison of the parasite species richness using the marine fish species common to Brasil, Mexico and the Caribbean, it was possible to achieve a test completely independent of fish phylogeny. The finding of the highest parasite species richness in fishes from the Caribbean provides perhaps the most compelling evidence for a potential hotspot of parasite biodiversity. This result should still be interpreted with caution because the analysis was restricted to marine fishes, and several Caribbean marine fish have a geographical distribution extending to the littoral areas of Brasil and Mexico. A more robust test of the intrinsic ‘hotspot potential’ of the Caribbean would involve a comparative analysis of the parasite faunas of freshwater fishes, given their high endemicity in the 3 regions (Pavanelli et al. Reference Pavanelli, Machado, Takemoto, Guidelli, Lizama, Thomaz, Agostinho and Hahn2004; Salgado-Maldonado, Reference Salgado-Maldonado2006; Thatcher, Reference Thatcher2006).
In conclusion, the differences observed in the number and distribution of host-parasite associations among the 3 regions shows both significant effects of local phenomena and differences in the local priorities of research programs. Nevertheless, the biogeographical differences among these 3 regions are clear, and should extend to all existing fish host-parasite associations in the regions, considering that the majority of known fish species have not been examined for parasites. In this context, fish parasitological research is increasing mainly in Brasil and Mexico, less so in the Caribbean. Other Latin American countries have a rich biodiversity but lack the resources necessary to survey the biodiversity of free-living hosts, let alone that of parasites. To archive this biodiversity and understand its role in the functioning of marine and freshwater ecosystems, in time to incorporate it in plans to preserve natural resources, it will be necessary to accelerate our rate of study by an order of magnitude.
Thanks are due to Ângela T. Silva e Souza (Universidade Estadual de Londrina, Brasil), Anna Kohn and Luís C. Muniz (Instituto Oswaldo Cruz, Brasil), Daniele Rosim, Luiz E. Tavares, Rodney K. Azevedo and Vanessa D. Abdallah (Universidade Federal Rural do Rio de Janeiro, Brasil); Marcelo Oliva (Universidad de Antofagasta, Chile); Gerardo Pérez-Ponce de León, Guillermo Salgado-Maldonado and Rafael Lamothe-Argumedo (Universidad Nacional Autónoma de México); and Lídia Sánchez (Museo de Historia Natural “Javier Prado”, Peru) for their valuable help in obtaining literature and other information for the database used in this study. J. L. L. was supported by a fellowship (N° 200906-2005.4) of the Conselho Nacional de Desenvolvimento Científico e Tecnológico (CNPq) of Brasil for one year of Postdoctoral research in the Department of Zoology at the University of Otago, New Zealand.