INTRODUCTION
Flour colour is one of the most important factors in assessing flour quality and determining end product quality. For most consumers, white flour lacking major pigmentation is preferred, motivating the practice of bleaching flour with additives such as benzoyl peroxide in order to increase flour whiteness (FW), despite the potential health hazards (Kruger & Reed Reference Kruger, Reed and Pomeranz1988; Lamsal & Faubion Reference Lamsal and Faubion2009). In fact, FW is an integrated sensory indicator with holistic reflection of flour colour. Different final products may require different FW. For example, flour with high levels of yellow pigmentation is preferred for Chinese and Japanese alkaline noodles, while higher FW is desirable for Chinese steamed and baked bread (He et al. Reference He, Yang, Zhang, Quail and Penã2004). Moreover, FW may be affected by grain and flour quality traits (Zhang & Tian Reference Zhang and Tian2008), such as grain protein content and grain hardness. Negative correlations have been observed between FW and protein content (Li et al. Reference Li, Liu, Liu, You, Liu and Li2011, Reference Li, Cui, Ding, Zhao, Wang, Wang, Bao, Qi, Li, Gao, Feng and Wang2012): FW is higher from wheat with low rather than high protein content at the same flour milling extraction ratio. The most widely used colorimetric measurement assay for FW is based on L* (brightness), a* (greenness or red-green chromaticity) and b* (yellowness). For a pure white flour, L* should be 100, and a* and b* should be 0 (Sun et al. Reference Sun, Wang, Ren and Lan2002). Flour with low L* and high a* value is undesirable because it has a dull grey colour.
For wheat breeders, phenotypic measurements and selection of FW and colour are laborious because they require many grain samples to be milled, and it is very difficult to practice selection in early wheat breeding generations. Therefore, studies have been conducted on the genetic basis of FW and colour in order to help breeders select at early stages of breeding. Previous work on flour colour, FW, yellow pigment content, polyphenol oxidase (PPO), etc. has been focused on unconditional quantitative trait locus (QTL) mapping on common wheat and durum wheat using different populations. Quantitative trait loci controlling flour colour and its related traits have been found on 16 chromosomes: 1A (Patil et al. Reference Patil, Oak, Tamhankar, Sourdille and Rao2008; Zhang et al. Reference Zhang, Wu, Xiao, He, Zhang, Yan, Zhang, Xia and Ma2009b ; Tsilo et al. Reference Tsilo, Hareland, Chao and Anderson2011), 1B (Zhang et al. Reference Zhang, Wu, Xiao, He, Zhang, Yan, Zhang, Xia and Ma2009b ; Tsilo et al. Reference Tsilo, Hareland, Chao and Anderson2011), 2A (Blanco et al. Reference Blanco, Colasuonno, Gadaleta, Mangini, Schiavulli, Simeone, Digesu, De Vita, Mastrangelo and Cattivelli2011; Li et al. Reference Li, Liu, Liu, You, Liu and Li2011), 2B (Sadeque & Turner Reference Sadeque and Turner2010; Roncallo et al. Reference Roncallo, Cervigni, Jensen, Miranda, Carrera, Helguera and Echenique2012) , 2D (He et al. Reference He, He, Zhang, Sun, Morris, Fuerst and Xia2007), 3A (Parker et al. Reference Parker, Chalmers, Rathjen and Langridge1998; Mares & Campbell Reference Mares and Campbell2001; Sadeque & Turner Reference Sadeque and Turner2010; Blanco et al. Reference Blanco, Colasuonno, Gadaleta, Mangini, Schiavulli, Simeone, Digesu, De Vita, Mastrangelo and Cattivelli2011; Li et al. Reference Li, Liu, Liu, You, Liu and Li2011; Roncallo et al. Reference Roncallo, Cervigni, Jensen, Miranda, Carrera, Helguera and Echenique2012; Crawford & Francki Reference Crawford and Francki2013), 3B (Li et al. Reference Li, Cui, Ding, Zhao, Wang, Wang, Bao, Qi, Li, Gao, Feng and Wang2012), 4A (Li et al. Reference Li, Liu, Liu, You, Liu and Li2011; Roncallo et al. Reference Roncallo, Cervigni, Jensen, Miranda, Carrera, Helguera and Echenique2012), 4D (Zhang et al. Reference Zhang, Yan, Xia, He and Sutherland2006), 5A (Hessler et al. Reference Hessler, Thomson, Benscher, Nachit and Sorrells2002; Blanco et al. Reference Blanco, Colasuonno, Gadaleta, Mangini, Schiavulli, Simeone, Digesu, De Vita, Mastrangelo and Cattivelli2011; Tsilo et al. Reference Tsilo, Hareland, Chao and Anderson2011), 5B (Patil et al. Reference Patil, Oak, Tamhankar, Sourdille and Rao2008; Sadeque & Turner Reference Sadeque and Turner2010; Tsilo et al. Reference Tsilo, Hareland, Chao and Anderson2011; Li et al. Reference Li, Cui, Ding, Zhao, Wang, Wang, Bao, Qi, Li, Gao, Feng and Wang2012), 5D (Li et al. Reference Li, Liu, Liu, You, Liu and Li2011; Tsilo et al. Reference Tsilo, Hareland, Chao and Anderson2011), 6A (Mares & Campbell Reference Mares and Campbell2001; Zhang et al. Reference Zhang, Yan, Xia, He and Sutherland2006; Roncallo et al. Reference Roncallo, Cervigni, Jensen, Miranda, Carrera, Helguera and Echenique2012), 6B (Pozniak et al. Reference Pozniak, Knox, Clarke and Clarke2007), 7A (Parker et al. Reference Parker, Chalmers, Rathjen and Langridge1998; Mares & Campbell Reference Mares and Campbell2001; He et al. Reference He, Zhang, He, Wu, Xiao, Ma and Xia2008; Patil et al. Reference Patil, Oak, Tamhankar, Sourdille and Rao2008; Zhang et al. Reference Zhang, Chen, Zhao, Liu, Xu and Tian2009a ; Blanco et al. Reference Blanco, Colasuonno, Gadaleta, Mangini, Schiavulli, Simeone, Digesu, De Vita, Mastrangelo and Cattivelli2011; Roncallo et al. Reference Roncallo, Cervigni, Jensen, Miranda, Carrera, Helguera and Echenique2012) and 7B (Pozniak et al. Reference Pozniak, Knox, Clarke and Clarke2007; Zhang & Dubcovsky Reference Zhang and Dubcovsky2008; Tsilo et al. Reference Tsilo, Hareland, Chao and Anderson2011; Roncallo et al. Reference Roncallo, Cervigni, Jensen, Miranda, Carrera, Helguera and Echenique2012). Ficco et al. (Reference Ficco, Mastrangelo, Trono, Borrelli, DE Vita, Fares, Beleggia, Platani and Papa2014) reviewed the literature for colours of durum wheat and summarized the important markers. Up to now, some functional markers, especially those controlling yellow pigment, have been used for wheat flour colour (Crawford & Francki Reference Crawford and Francki2013; Ravel et al. Reference Ravel, Dardevet, Leenhardt, Bordes, Joseph, Perretant, Exbrayat, Poncet, Balfourier, Chanliaud and Charmet2013).
In 1995, Zhu demonstrated that the conditional QTL mapping method could be used to exclude the contribution of a causal trait to the variation of the resultant trait (Zhu Reference Zhu1995). The remaining variation of the resultant trait is defined as conditional variation, or net variation, which indicates the net effects of genes that are independent of the causal trait (Liu et al. Reference Liu, Yang, Xu, Hayat and Zhu2008). Recently, the dynamic behaviour of developmental traits and the genetic interactions between the conditional variations of the resultant trait and its related traits have been studied using this method in many crops, such as cotton, rice, wheat, maize and rapeseed (Zhu Reference Zhu1995; Jiang et al. Reference Jiang, Jiang, Guo, Gao, Zeng, Zhu, Liang and Qian2008; Liu et al. Reference Liu, Yang, Xu, Hayat and Zhu2008, Reference Liu, Zhao, Zhang, Zhu, Tian and Tian2010; Wang et al. Reference Wang, Wu, Ren, Chang, Li and Jiang2010, Reference Wang, Cui, Wang, Jun, Ding, Zhao, Li, Feng, Gao and Wang2012; Cui et al. Reference Cui, Li, Ding, Zhao, Wang, Wang, Li, Bao, Li, Feng, Kong and Wang2011; Zhang et al. Reference Zhang, Liu, Cui, Hu, Wang and Tang2013). The genetic relationship among different related traits should be dissected at the QTL level. In wheat, conditional QTL mapping has been reported on different developmental stages for plant height, tiller number, grain protein content, starch content and other phenotypic characters (Liu et al. Reference Liu, Zhao, Zhang, Zhu, Tian and Tian2010; Wang et al. Reference Wang, Wu, Ren, Chang, Li and Jiang2010; Cui et al. Reference Cui, Li, Ding, Zhao, Wang, Wang, Li, Bao, Li, Feng, Kong and Wang2011; Tian et al. Reference Tian, Liu, Zhu, Xie and Tian2011; Zhu et al. Reference Zhu, Liu, Tian, Xie, Li and Tian2011). Moreover, genetic interactions among related traits in wheat were also dissected by conditional QTL mapping at the individual QTL level, such as the interactions between grain protein and starch content (Deng et al. Reference Deng, Hu, Chen, Li, Chen, Sun, Zhang, Wang, Song and Tian2015), and between wheat kernel weight and kernel length and width (Zhang et al. Reference Zhang, Deng, Wang, Li and Tian2014).
Although extensive QTL analyses for flour colour have been carried out, less information is available about the genetic inter-relationship between FW and flour protein content, flour colour, and flour ash content at QTL/gene level. Why does FW have a significant negative correlation with flour protein content and ash content? How can the genetic relationship between them be dissected? So far, no study has been carried out on the relationship at the QTL/gene level.
The objective of the current paper was to dissect the genetic relationship between FW and flour protein content, flour colour and flour ash content using unconditional and conditional QTL mapping analysis. By comparing unconditional and conditional QTLs, the genetic interdependencies between them can be identified at the individual QTL level. This comparison might provide valuable information for marker-assisted selection to improve FW without negative effects on flour protein content or with positive effects on flour L*.
MATERIALS AND METHODS
Plant materials
A recombinant inbred line (RIL) population of 256 lines was developed from a cross between two winter wheat cultivars Nuomai 1 (female, NM1) and Gaocheng 8901 (male, GC8901) by single-seed descent to the F10 generation. Cultivar NM1 (Jiangsubaihuomai/Guandong107), bred by China Agricultural University and released in 2005 in Beijing, has unique starch properties related to high-quality white salt noodles. Cultivar GC8901 (77546-2/Linzhang), with high gluten strength and good bread-making qualities, was bred by Gaocheng Agricultural Science Research Institute and was released in 1998 in Hebei Province.
Field trials
The RIL population along with the parents was grown in three different locations in the 2009/10, 2010/11 and 2011/12 growing seasons, respectively. E1 represents Tai'an, Shandong Province (36°12′N, 117°04′E, 800 m a.s.l.), China, in the 2009/10 growing season; E2 refers to Suzhou, Anhui Province (33°63′N, 116°97′E, 30 m a.s.l.), China, in 2010/11; E3 stands for Jiyuan, Henan Province (35°05′N, 112°36′E, 1711 m a.s.l.), China, in 2011/12.
These lines were sown in a randomized block design with two replicates at each location. Each replication in E1 was designed based on a six-row plot 2·3 m long and 26 cm between rows, whereas those in E2 were six-row plots 4 m × 25 cm and in E3 were three-row plots 2·6 m × 26 cm.
Fertilization was applied before planting and at jointing stages (Zadoks growth stage (GS) 31–32) (Zadoks et al. Reference Zadoks, Chang and Konzak1974) in all experimental locations (as described in Deng et al. Reference Deng, Hu, Chen, Li, Chen, Sun, Zhang, Wang, Song and Tian2015).
The crop was irrigated at stages of pre-overwintering (GS 27–29), jointing (GS 31–32) and grain filling (GS 71–74) in all experimental locations. All recommended local crop management practices were followed, and no damage attributable to lodging, disease or pests was observed during the growing seasons.
Phenotyping methods
Milling and flour colour measurements (L*, a* and b*) were carried out according to Zhang et al. (Reference Zhang, Wu, Xiao, He, Zhang, Yan, Zhang, Xia and Ma2009b ).
Flour whiteness was determined by a WSB-IV intelligent whiteness determination meter (Dajiguangdian Instruments, Hangzhou, China).
Flour protein content was measured by near-infrared reflectance spectroscopy (NIRS) on a Perten DA-7200 (Perten Instruments, Huddinge, Sweden) and expressed on a 14% moisture basis using AACC approved method 39–25 (AACC 2004).
Flour ash content in E1 and E3 was also measured by NIRS on the Perten DA-7200.
Data analysis and quantitative trait loci mapping
Statistical analyses (e.g., normal distribution and correlation) were performed using the software SPSS 17·0 (SPSS, Chicago, USA) and Excel 2010. Trait heritability was calculated by applying ANOVA of SAS program (SAS Institute, NC, USA).
Nine hundred and sixteen diversity arrays technology (DArT) markers developed by Triticarte Pty. Ltd. (http://www.triticarte.com.au, accessed 24 May 2016) in Australia and 183 simple sequence repeat (SSR) markers from Grain Gene 2·0 were used to test this population. The molecular genetic map was constructed by MAPMAKER/EXP ver. 3·0b (Lincoln et al. Reference Lincoln, Daly and Lander1993). The commands ‘group’, ‘sequence’ and ‘map’ were used to develop the linkage groups and the position of markers on each chromosome, and the command ‘try’ and ‘compare’ were located on the unlinked markers on the chromosomes. The Kosambi (Reference Kosambi1994) mapping function was used to convert recombination fraction into cM values as map distances. Finally, the linkage map was drawn by Mapchart ver. 2·1 (Voorrips Reference Voorrips2002).
Conditional genetic analysis was conducted based on the phenotypic values of FW conditioned on flour protein content, flour colour (L*, a* and b*) and flour ash content, which were obtained by the mixed-model approach (Zhu Reference Zhu1995; Wen & Zhu Reference Wen and Zhu2005). Conditional phenotypic values y (T1|T2) were obtained by the mixed model approach for the conditional analysis of quantitative traits described by Zhu (Reference Zhu1995), where T1|T2 means trait 1 conditioned on trait 2 (for example, FW|Pr = flour whiteness conditioned on flour protein content). The software QGAStation 1·0 (http://ibi.zju.edu.cn/software/qga/, accessed 24 May 2016) was used to calculate the conditional phenotypic values y (T1|T2), which were subsequently used as input data for conditional QTL mapping.
Unconditional and conditional QTL mappings were performed firstly using the composite interval mapping method in ICIMapping 4·0 (Wang et al. Reference Wang, Li, Zhang and Meng2014; http://www.isbreeding.net, accessed 24 May 2016) in individual environments, and then using the QTLNetwork version 2.0 (http://ibi.zju.edu.cn/software/qtlnetwork/, accessed 24 May 2016) based on the mixed linear model to analyse the interactions between QTL and environment. For ICIMapping 4·0, a walking speed of 1·0 cM and a logarithm of the odds (LOD) score of 2·5 (based on 1000 permutations) were used for detecting and declaring the presence of a putative QTL. For QTLNetwork 2·0, composite interval analysis was undertaken using forward–backward stepwise, multiple linear regression with a probability into and out of the model of 0·05 and a window size set at 10 cM. Significant thresholds for QTL detection were calculated for each data set using 1000 permutations and a genome-wide error rate of P < 0·10 (suggestive) and P < 0·05 (significant). The final genetic model incorporated significant additive and epistatic effects as well as their environmental interactions. A QTL was declared if the trait was associated with a marker locus at P < 0·05.
To clarify the designations of the examined QTLs, the following rules were adopted: ‘Q’ denotes ‘QTL’; the letter following ‘Q’ is an abbreviation of its corresponding trait; whereas a numerical number followed by a upper case letter, ‘A’, ‘B’ or ‘D’, is an indication of the chromosome number present in a given wheat genome where the corresponding QTL was detected; and if there is more than one QTL on a chromosome, a serial number behind a hyphen is added (e.g., Qfw6A-2 stands for the second QTL for FW on chromosome 6A).
Quantitative trait loci detected through unconditional and conditional QTL mapping methods are known as unconditional and conditional QTLs, respectively.
RESULTS
Genetic map
A total of 501 markers were mapped including 479 DArT, 17 SSR, 2 HMW-GS, and 3 Wx protein markers. Compared with the previous map used by Zheng et al. (Reference Zheng, Deng, Shi, Zhang and Tian2013), three SSR markers were added on 1D. It covered 4213·2 cM with an average distance of 8·4 cM, producing 25 linkage maps. These markers were identified on 21 chromosomes.
Phenotypic data and correlations analysis
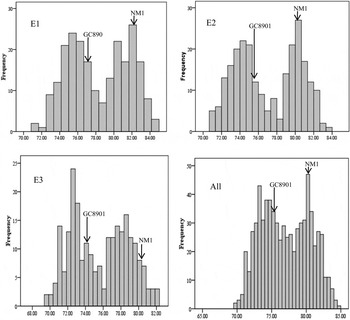
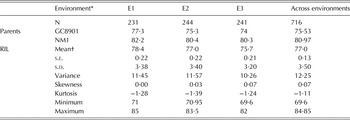
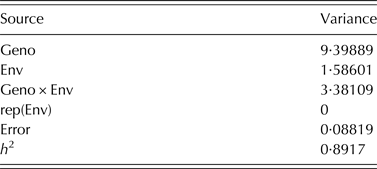
Continuous variation was found for FW in each environment (Table 1 and Fig. 1). Analysis of variance (ANOVA) showed that FW was significantly affected by genotype, environment and their interaction (Table 2). Its distribution was determined to be continuous (Fig. 1), indicating that it was a quantitative trait. The broad-sense heritability was 89·17% (Table 3). Transgressive segregation was observed on both the high and low sides of FW (Table 1 and Fig. 1), indicating that the alleles with positive effects were contributed by both parents.
Frequency distribution of flour whiteness (FW) in the recombinant inbred line (RIL) population derived from GC8901 and NM1 in three environments. E1:2009/10 Taian; E2: 2010/11 Suzhou; E3: 2011/12 Jiyuan; All: averaged data across three environments.

Phenotypic data of flour whiteness for the recombinant inbred line (RIL) population and the parents in different environments

* E1: 2009/10 Taian; E2: 2010/11 Suzhou; E3: 2011/12 Jiyuan.
† Mean value is RIL population in individual environments.
Analysis of variance (ANOVA) results of flour whiteness by using the general linear model (GLM) procedure

Geno, genotype; Env, environment.
Heritability of flour whiteness

Geno, genotype; Env, environment.
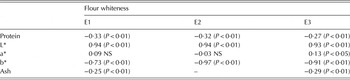
Significant negative correlation was observed between FW and flour protein under the three environments, and also between FW and flour ash (Table 4). While significant positive correlation coefficients between FW and flour L* in all three environments were very high, with r values ranging from 0·93 to 0·94, the negative correlation between FW and flour b* were also very high, with r values ranging from −0·73 to −0·97. No significant correlation was found between FW and a*.
Correlation analysis between flour whiteness and its related traits

E1: 2009/10 Taian; E2: 2010/11 Suzhou; E3: 2011/12 Jiyuan; L*, brightness; a*, greenness or red-green chromaticity; b*, yellowness; NS, not significant.
Additive effects of unconditional and conditional QTLs mapping of FW
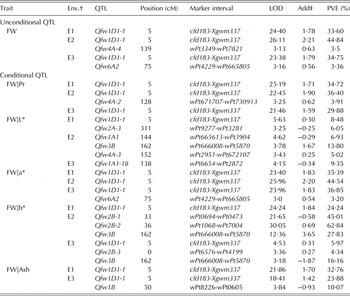
Three unconditional additive QTLs were found in different environments (Table 5). Of these QTLs, Qfw1D1-1, with 33·60–44·84% phenotypic variation explained (PVE), was detected in all the environments, which indicated a stable major QTL affected little by environment. Another two unconditional additive QTL (Qfw4A-4 and Qfw6A2) were detected but only in a single environment with PVE smaller than 10% (Table 5).
Additive effects of unconditional and conditional quantitative trait loci (QTL) of flour whiteness (FW) in individual environments*

LOD, logarithm of the odds; PVE, phenotypic variation explained.
* The results in this table were obtained with ICIMapping 4·0 software.
† E1: 2009/10 Taian; E2: 2010/11 Suzhou; E3: 2011/12 Jiyuan.
‡ Additive effect, positive and negative values indicate that high phenotypic values are contributed by NM1 and GC8901, respectively.
By removing the influence of flour protein, two conditional additive QTLs were found (Table 5) with PVE of 3·91–36·40%. Of these QTLs, the major conditional QTL Qfw1D1-1 was detected in all environments, and its additive effects remained similar as those in unconditioned QTL, indicating that it was independent of flour protein content. The appearance of one conditional QTL, Qfw4A-2, indicated that this QTL was very likely to be repressed by flour protein content. In addition, the disappearance of two unconditional QTLs, Qfw4A-4 and Qfw6A2, suggested that the expression of these two loci was associated with flour protein content.
When the influence of flour L* was removed, Qfw1D1-1 remained significant in only one environment with reduced PVE (Table 5), indicating that the locus was strongly affected by flour L*. Five other conditional QTLs emerged on chromosomes 1A, 2A, 3B and 4A (Table 5), indicating these loci were repressed by flour L*.
When the influence of flour a* was removed, the conditional QTL Qfw1D1-1 detected in all environments was the same as that in unconditional QTL with a similar additive effect (Table 5), suggesting that this locus was independent of flour a*. In E3, Qfw6A2 was also identified using conditional QTL mapping, whose additive effects remained similar as found in unconditioned QTL, indicating that it was independent of flour a*.
By removing the influence of flour b*, Qfw1D1-1 remained the same as those in unconditional QTL in E1 and E3, but their additive effects were different. Four new conditional QTLs on 2B and 3B chromosomes emerged (Table 5). Among them, there were three major conditional QTLs, Qfw2B-1, Qfw2B-2 and Qfw3B.
When the influence of flour ash was removed, Qfw1D1-1 remained the same as that in unconditioned QTL with markedly different additive effects (Table 5), indicating that this QTL was partially affected by flour ash. One unconditional QTL, Qfw6A2, disappeared and a conditional QTL, Qfw1B, emerged.
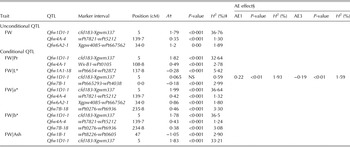
In order to check the accuracy of the results, the QTLNetwork2·0 was also used to analyse the data, and very similar results were obtained (Table 6). The main difference was an unconditional QTL, Qfw6A2-1, that was newly detected and four conditional QTLs, Qfw4A-1, Qfw7B-18, Qfw6A2-1 and Qfw4A-4 identified after removing the effect of flour protein, L*, a* and flour b*. In addition, no major interaction additive effect between QTL and environment (AE) was found in the current study.
Additive effects (A) and additive × environment (AE) interactions of unconditional and conditional quantitative trait loci (QTL) of flour whiteness (FW) *

NS, not significant.
* The results in this table were obtained with QTLNetwork 2·0 software.
† Additive effects, positive and negative values indicate that high phenotypic values are contributed by NM1 and GC8901, respectively.
‡ Contribution explained by filtrated putative additive QTL.
§ The interaction additive effect between QTL and environment.
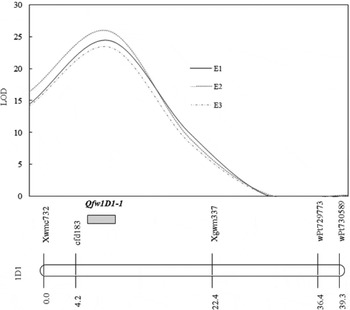
In summary, four unconditional additive QTLs and 16 conditional additive QTLs were found. Among them, a stable major additive QTL, Qfw1D1-1, was identified (Fig. 2), which could improve FW without being affected by the other four factors at the QTL/gene level. Another major conditional additive QTL, Qfw3B, was co-suppressed by flour colour L* and b*. The minor additive QTL, Qfw4A-4, was independent of flour colour a* and b*, but was co-affected by the remaining three quality traits. The remaining minor conditional additive QTLs were regulated by different traits. In addition, several new QTLs were identified after removing the corresponding factors, evidencing the ability of conditional QTL mapping in revealing masked QTLs.
Linkage map of chromosome 1D with logarithm of odds (LOD) curves obtained from inclusive composite interval mapping (ICIM) of flour whiteness (FW) in three environments. The LOD threshold of 3·0 determined by permutations is indicated by the horizontal dashed-dot line.

Epistatic effects of unconditional and conditional quantitative trait loci mapping of flour whiteness
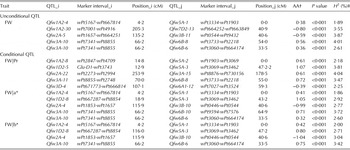
Unconditional mapping detected five pairs of epistatic QTLs located on chromosomes 1A, 2A, 3A, 3B, 5A, 6B and 7D (Table 7). Contributions of these epistatic QTLs ranged from 1·89 to 4·01%. The epistatic effect of each QTL seemed to be minor, but the total PVE was 15·93%.
Epistasis effects (AA) of unconditional and quantitative trait loci (QTL) of flour whiteness (FW) *

* The results in this table were obtained with QTLNetwork 2·0 software.
† AA: epistasis effects.
‡ H 2(%): contribution explained by filtrated putative epistasis QTL.
When the influence of flour protein was removed, these five pairs of unconditional epistatic QTLs disappeared, and five other pairs of epistatic QTLs emerged (Table 7). Total PVE of conditional epistasis was 15·75%.
By removing the influence of flour a*, five pairs of epistatic QTLs were identified. Of these, only the conditional epistatic QTLs Qfw3A-10/Qfw6B-6 remained the same as that in unconditioned QTL with similar epistatic effect value (Table 7), whereas another set of four pairs of epistatic QTLs emerged.
After removing the influence of flour b*, four pairs of epistatic QTLs were detected (Table 7). The conditional epistatic QTLs Qfw3A-10/Qfw6B-6 remained the same as that in unconditioned QTL but with largely different epistatic effect values, and other three pairs of epistatic QTLs emerged. However, there were no pairs of epistatic QTLs identified when the influences of flour L* and flour ash were removed.
Hence, only one pair of epistatic QTL (Qfw3A-10/ Qfw6B-6) was identified in both unconditional and conditional QTL mapping. It was independent of flour colour a* but partly affected by flour colour b* with greatly increased conditional epistatic effect.
DISCUSSION
In previous studies (Parker et al. Reference Parker, Chalmers, Rathjen and Langridge1998; Mares & Campbell Reference Mares and Campbell2001; He et al. Reference He, Zhang, He, Wu, Xiao, Ma and Xia2008; Patil et al. Reference Patil, Oak, Tamhankar, Sourdille and Rao2008; Zhang et al. Reference Zhang, Chen, Zhao, Liu, Xu and Tian2009a ; Li et al. Reference Li, Liu, Liu, You, Liu and Li2011, Reference Li, Cui, Ding, Zhao, Wang, Wang, Bao, Qi, Li, Gao, Feng and Wang2012; Tsilo et al. Reference Tsilo, Hareland, Chao and Anderson2011), QTL mapping of FW and flour colour were carried out using the unconditional mapping method, and most were conducted based on the additive-dominant model, usually ignoring the epistasis between QTLs. However, in the current research, the conditional QTL mapping method was used to analyse the genetic interactions between FW and its effectors at the QTL level by additive and epistasis models including the interactions between QTL and environment. The results provided more information than those of unconditional mapping. Using unconditional mapping, Li et al. (Reference Li, Liu, Liu, You, Liu and Li2011) reported three QTLs for FW distributed on 3A, 4A and 5D chromosomes with PVE less than 10%. Li et al. (Reference Li, Cui, Ding, Zhao, Wang, Wang, Bao, Qi, Li, Gao, Feng and Wang2012) found four major QTLs on 1D, 3B, 5B and 7D, of which the QTL on 1D with 11·90% of PVE was only detected under one environment using WY population. In the current work, only one major QTL was found, Qfw1D1-1, with flanking markers cfd183-Xgwm337 ranging from 4·2 to 22·4 cM on 1D chromosome, and the peak position of this QTL was very close to the maker cfd183 with a genetic distance of 0·8 cM. Meanwhile, this QTL was stable in all environments and therefore can be used in marker-assisted breeding. If it is transferred to other genotypes with low FW, then FW is expected to improve by 1·78–2·21. In the same marker interval, Zheng et al. (Reference Zheng, Deng, Shi, Zhang and Tian2013) also found a major QTL for mixograph peak value using unconditional QTL mapping. In addition, QTLs on 2B, 4A, 2A and 6A with minor effects were identified in the current study. Previous studies also reported some QTLs on these loci not only for FW (Li et al. Reference Li, Liu, Liu, You, Liu and Li2011, Reference Li, Cui, Ding, Zhao, Wang, Wang, Bao, Qi, Li, Gao, Feng and Wang2012) but also for flour colour L*, a* and b* (Zhang et al. Reference Zhang, Chen, Zhao, Liu, Xu and Tian2009a ; Sadeque & Turner Reference Sadeque and Turner2010; Blanco et al. Reference Blanco, Colasuonno, Gadaleta, Mangini, Schiavulli, Simeone, Digesu, De Vita, Mastrangelo and Cattivelli2011; Roncallo et al. Reference Roncallo, Cervigni, Jensen, Miranda, Carrera, Helguera and Echenique2012). Five pairs of epistatic QTLs were found on chromosomes 1A-5A, 1A-7D, 2A-3B and 3A-6B. Although Li et al. (Reference Li, Liu, Liu, You, Liu and Li2011) also found one epistatic QTL on 1A-7D chromosome, its locus was different from the current study.
By conditional QTL mapping, several QTLs were discovered, showing no, partial or complete association with FW. The major additive QTL, Qfw1D1-1, was found to be independent of flour protein content and flour colour a* and b*, and its expression was slightly affected by flour ash content. Hence this QTL was important for improving FW. It was noteworthy that in the same marker interval, the additive QTL Qgsc1D-1 for grain starch content was also detected in both unconditional and conditional QTL mapping, which was partly affected by grain protein content (Deng et al. Reference Deng, Hu, Chen, Li, Chen, Sun, Zhang, Wang, Song and Tian2015). Meanwhile Qgpc1D-1 for grain protein content was also found in the same marker interval but only by conditional mapping when the influence of grain starch content was removed (Deng et al. Reference Deng, Hu, Chen, Li, Chen, Sun, Zhang, Wang, Song and Tian2015). These results imply that an important gene with pleiotropic effects for FW, grain starch and protein content may be present in this chromosomal region. In addition, one important additive QTL for sedimentation volume on chromosome 1D with flanking markers XWMC93 and GLUD1 was found by comparing unconditional and conditional QTLs in a doubled haploid (DH) population (Deng et al. Reference Deng, Zhao, Liu, Zhang, Chen, Qu, Sun, Zhang and Tian2013).
In summary, four unconditional additive QTLs and 16 conditional additive QTLs for FW were detected across three environments, and five unconditional and ten conditional epistatic QTLs were identified. Although most of these QTLs have minor additive effects, FW might still be increased by pyramiding these QTLs, particularly Qfw1D1-1, through marker-assisted breeding.
The research was supported by the Natural Science Foundation of Shandong Province, China (Grant No. ZR2013CM004), the National Natural Science Foundation of China (Grant No. 31301315), the Shandong Provincial Agriculture Liangzhong Project Foundation of China (2013 No. 207 and 2014 No. 96) and the State Key Laboratory of Crop Biology Foundation (Grant No. 2013KF06).