The Medical Reserve Corps (MRC) was created to provide a national network of community-based units to promote the local identification, recruitment, training, and activation of volunteers, especially those with medical and public health backgrounds.Reference Hoard and Tosatto1 Overseen by the Office of the Civilian Volunteer Medical Reserve Corps (OCVMRC), the goal of the OCVMRC is to strengthen the nation's emergency preparedness and response infrastructure by using medical, public health, and other volunteers. In December 2006, the MRC program was included in the Pandemic and All-Hazards Preparedness Act (Public Law 109-417),2 and as of June 2010 has grown into an extensive national network comprising 885 MRC units made up of 207 891 volunteers.3
MRC volunteers have been involved in assisting local communities in responding to emergencies. During the response to Hurricane Katrina in 2005, 6000 MRC volunteers were activated nationally to support local response efforts, and an additional 1500 were deployed to the Gulf Coast region.Reference Franco, Toner, Waldhorn, Maldin, O’Toole and Inglesby4 In 2008, 63 units made up of 1500 volunteers were activated to support emergency response efforts for Hurricanes Gustav and Ike and Tropical Storm Hanna.Reference Schaffzin5 During autumn 2009, MRC units participated in a variety of activities related to the planning and response to influenza A (H1N1). As of September 2009, 60% of MRC units reported having participated in H1N1 public health educational activities, 53% helped their volunteers develop personal preparedness plans, and 37% assisted local health departments (LHDs) with response activities.3 Nationwide, MRC volunteers have been engaged in several other initiatives that support OCVMRC's mission to strengthen the local public health infrastructure in mass prophylaxis health literacy, disease prevention, and reduction of health disparities.3
In collaboration with the National Association of County and City Health Officials and the OCVMRC, Harvard School of Public Health and Georgetown University were asked to develop and validate a toolkit that MRC units could use in assessing the performance of volunteers engaged in public health activities and barriers experienced by those who were unable to participate. Influenza clinics were chosen as the setting for this research project because they simulate the notification and response capabilities of MRC units participating in public health activities. In addition, because of the annual recurrence of influenza, flu clinics present a convenient opportunity to track emergency response capabilities over time, and because these clinics are conducted nationwide, they allow for geographical and other comparisons.
METHODS
Site Selection
To select study participants, the National Association of County and City Health Officials and the OCVMRC assembled a list of potential MRC units to be surveyed. Based on this list, we selected 15 sites with 24 flu clinics in a variety of geographic locations that were able to participate on short notice.
Conceptual Framework and Item Pool Generation
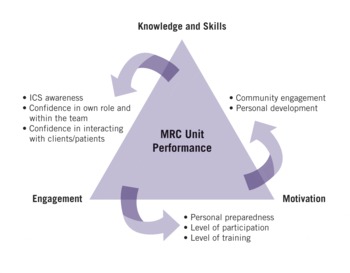
Through a consensus process involving MRC leaders, local health department representatives, MRC unit coordinators, and experts in the evaluation of public health preparedness activities we developed a conceptual framework to define the construct “MRC unit performance.” The framework includes 3 domains: motivation, knowledge and skills, and engagement. A graphic representation is provided in the Figure.
MRC Unit Performance: “Conceptual Framework”

The motivation domain includes 2 subdomains that reflect the motivations of volunteers who participate in public health activities: community service and personal and professional development. The knowledge and skills domain includes awareness of the incident command system (ICS), confidence in interacting with clients/patients, and confidence in the volunteer's own role and being part of a team. In contrast, the engagement domain includes factors such as personal preparedness, frequency of participation, attendance at training activities, and specific barriers preventing volunteering.
We tested this conceptual framework using data from influenza vaccination clinics. Two groups were studied: MRC volunteers participating in public health activities and MRC unit members invited to participate but were unable to attend. In addition, observations from LHD staff working with the volunteers, and external evaluators observing the flu clinics’ activities, were used to contextualize the individual MRC units' performance and validate the instruments. The use of multiple points of observation provided a comprehensive overview of the many aspects of performance related to MRC unit engagement.
To collect data from the volunteers participating in the flu clinics we developed the paper-based Volunteer Self-Assessment Questionnaire, which included sections that assessed ICS awareness, confidence in own role and interaction with clients and other team members, and motivation, and a set of items designed to assess factors such as personal preparedness, risk perception, and usefulness of training. A second questionnaire was developed to gather data on the level of motivation and specific barriers experienced by individuals who were recruited to participate but were unable to attend, the Barriers to Volunteering Questionnaire, was administered online. It addressed issues such as financial difficulties, safety concerns, child care, elder care, transportation, prior commitments, health problems, and volunteer's role clarification and feedback on services that could increase participation. Existing surveys, widely used by nonprofit organizations for managing volunteers, provided the basis for the item pool generation of both instruments.Reference McCurley and Vineyard6Reference Hall, Phillips and Meillat78Reference Yoshioka, Brown and Ashcraft9Reference Clary, Snyder and Ridge10Reference Esmond and Dunlop11 The survey instruments and instructions on how to implement them are available in a toolkit (http://www.hsph.harvard.edu/hcphp/mrc-toolkit).
Statistical Approach
In this study, we sought to assess the reliability and validity (face, content, construct, and criterion) of the instruments that we designed. Reliability reflects the consistency of an instrument when it is used under the same conditions with the same or different subjects. Internal consistency was the primary measure of reliability used in this study and tested by means of Cronbach alpha. Validity is the degree to which a scale measures what it was designed to measure. The colinearity of the intercorrelation matrix was tested using Bartlett's test of sphericity and by the Kaiser-Meyer-Olkin (KMO) measure of sampling adequacy. The validity of the scales was determined by principal component analysis using the Kaiser-Guttman rule (eigenvalue >1) and the corresponding screen plot results to identify the number of factors to be retained. Factors were rotated using varimax rotation. Instrument validity was assessed in terms of face, content, construct, and criterion-related validity by the study of the instrument domain structure, correlations between comparable domains and items, and by comparing participant responses to the observations of external evaluators and LHD staff. Statistical analysis was performed using SPSS version 16.0 (SPSS, Inc, Chicago, IL).
In addition, the factor analysis results were used to generate summary scales describing the following domains: ICS awareness, confidence in interacting with the client, confidence in own role and as part of a team, motivation related to community service, and motivation related to personal development. The factor scores for the above-mentioned scales were generated using a regression model, and all of the scales were subsequently converted into a 0 to 100 score. Hypothesis on the association between the scale and specific factors such as volunteer's characteristics were developed at the beginning of the study, and descriptive and analytical statistics were performed to identify differences in performance across units and categories of volunteers and frequencies of particular issues such as specific barriers to volunteering. These results helped in identifying practical uses of the instruments that we developed.
RESULTS
Flu Clinic Locations and Sample Size
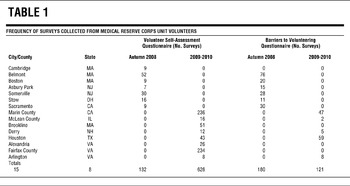
The instruments were implemented in the 2008-2009 and 2009-2010 flu seasons at 24 flu clinics in 15 locations in 8 different states (California, Illinois, Massachusetts, New Hampshire, New Jersey, Ohio, Texas, and Virginia). The 2008, and some of the 2009-2010, flu clinics administered seasonal influenza vaccines and the remainder of the 2009-2010 clinics administered H1N1 vaccines. A total of 1059 questionnaires were collected: 758 Volunteer Self-Assessment Questionnaires (132 in 2008 and 626 in 2009-2010) and 301 Barriers to Volunteering Questionnaires (180 in 2008 and 121 in 2009-2010). Details about the number of questionnaires collected and flu clinics visited can be found in Table 1.
Frequency of Surveys Collected From Medical Reserve Corps Unit Volunteers

Pilot Phase for the Volunteers Self-Assessment Questionnaire
Data from 132 subjects gathered in 2008 were used as a pilot study to test the face and content validity of the instrument and internal consistency of the scales. Based on the results of the pilot phase, revised instruments were implemented in 2009, and the results presented below reflect the data analysis performed on the questionnaires gathered during the flu clinics implemented in the 2009–2010 flu season.
Empirical Scales Development and Sample Characteristics
In the 2009-2010 flu season, 626 Volunteers Self-Assessment questionnaires were collected, of which 541 were completed. Seventy-nine percent of volunteers were women and 21% were men. The distribution of volunteers by age category was as follows: 20 to 30 years (7%), 31 to 40 years (15%), 41 to 50 years (16%), 51 to 60 years (33%), and older than 60 years (36%). The volunteers' occupational status was unemployed (7%), health care worker (46%), public health worker (5%), administrative/business role (9%), retired (7%), and other (25%). Items with >15% missing values were dropped from the analysis. Data from 482 subjects were suitable for principal component factor analysis by inspection of the anti-image covariance matrix, KMO measure of sampling adequacy, and the Bartlett test of sphericity. For these data the KMO value was 0.84 (satisfactory value), and the Bartlett test of sphericity, which tests for the presence of correlations among the variables, was significant (P < .001), indicating that the correlation matrix was consistent with the hypothesis that the measures were not independent.
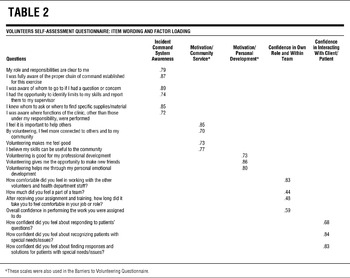
We determined, by means of Cattell scree test plot, that a 5-factor solution that accounted for 64% of the total variance was parsimonious, simply structured, and could be meaningfully interpreted. We defined these factors using items with factor loadings >0.40: 20 items met the criteria (abbreviated item wording and corresponding factor loadings are presented in Table 2). The first factor consisted of 6 items and accounted for 26% of the total variance. All 6 of these items were related to awareness of the ICS. The second factor, consisting of 4 items, accounted for 14% of the variance and described the volunteers' motivation driven by community engagement. The third factor included 3 items, accounted for 10% of the variance, and described confidence in interacting with clients/patients. The fourth factor included 3 items as well, accounted for 8% of the variance, and described volunteers' motivations related to personal development. Finally, the fifth factor included 4 items, accounted for 6% of the total variance, and described confidence in own role and within the team. The 2 motivation scales used in this questionnaire were also applied to the Barriers to Volunteering Questionnaire and the same factor structure, consisting of 2 factors, was confirmed.
Volunteers Self-Assessment Questionnaire: Item Wording and Factor Loading

Internal Consistency for the Volunteers' Self-Assessment Questionnaire
We calculated the Cronbach's coefficient for the 5 summary scales based on the factor analysis and for the total summative score based on all 20 items. The overall measure of internal consistency for the summative score was 0.80. Four of 5 scale coefficients were 0.77 or higher: ICS awareness (0.90), motivations/community engagement (0.81), confidence in interacting with clients/patients (0.78), motivations/personal development (0.77), and confidence in own role and as part of a team (0.50). These results indicated that questions within 4 of the 5 domains were correlated with one another and had robust internal consistency. The only scale lacking satisfactory reliability was the “confidence in own role and as part of a team” scale, likely due to the small number of items (α = .50 and 3 items).
Face and Content Validity
Feedback from MRC coordinators actively engaged in the development phase of the instruments led us to delete items from the final instruments that had consistent interpretation problems or high missing values. For example, during the pilot phase, several volunteers felt uncomfortable or had considerable difficulty in responding to questions designed to quantify the economic impact of volunteering, including the amount of time spent in training or in a specific activity. As a result, per MRC coordinators' request, we eliminated related items from the final questionnaires. Significant improvements were also made to the “confidence in interacting with the client” scale, which was reduced in the number of items in 2009-2010, maintaining internal consistency. The scale describing “confidence in own role and as part of team” was improved from the pilot phase as well; however, this scale stills shows low reliability in terms of Cronbach alpha value (α = .50) suggesting the need to add more items to better describe this domain.
Usefulness and Practicality of the Instruments
A summary of the data from the 2 questionnaires was used to write a technical report for each MRC unit coordinator participating in the project. The reports were presented by the research team that played the role of external evaluators during the pilot phase of the study (autumn 2008) and worked with the MRC unit coordinators and LHD staff representatives during a face-to-face meeting held in San Diego in February 2009. The purpose of this meeting was to assess the practicality and usefulness of the results derived by the implementation of the questionnaires, as well as to determine if the results were in accordance with observations by the external evaluators, the LHD staff, and MRC unit coordinators during the flu clinics. Results derived from the analysis of the surveys were reported by the MRC coordinators and LHD staff as easy to interpret with practical utility, and could be correlated with specific unit capabilities or challenges. This result is in support of the feasibility of the instruments and their criterion-related validity.
Examples of Use in Practice
In accordance with suggestions on the practicality and usefulness of the instruments from MRC unit coordinators and MRC national leaders, we performed a series of statistical analyses using the data collected in the 2009-2010 flu season and, as described below, found that the instruments were useful for identifying MRC units that stand out among their peers for high levels of performance, which can be used as models of best practice. The questionnaires also can be used to identify categories of volunteers who are more likely to participate, which is useful for recruitment and planning purposes; factors that motivate volunteers to participate, which can be used to increase participation; categories of volunteers who feel more confident than others in performing specific activities, which can be used to make assignments; and the reasons why volunteers do not feel confident in performing specific tasks.
Identification of High-Performing MRC Units
Performance across the 15 units was assessed using analysis of variance and differences were found across units (F test P < .001). In particular, 2 units were found to demonstrate the greatest difference in terms of level of personal motivation, with unit 4 having a mean value on the motivation/personal development scale of 55.4 (standard deviation [SD] 21.3) and unit 7 having a mean value of 68.5 (SD 20.1). The difference between these 2 units was found to be statistically significant by t test with Bonferroni correction (P < .001). Differences were also found comparing individual units with each other in terms of level of confidence of their volunteers' in their own role and in working as part of a team. In particular, unit 1 had more confident volunteers on the confidence in own role and as part of a team scale (mean value 88.5, SD 4.0) compared to unit 2 (mean value 67.9, SD 26.5) and unit 10 (mean value 73.3, SD 16.9). These differences were statistically significant based on a t test with Bonferroni correction P = .006 and P = .018 respectively. In the discussion section we address how high-performing units could be used as part of a “learning collaborative” to identify factors that can be used to improve overall performance across units.
Identification of Volunteers' Characteristics Influencing Participation
As expected, the level of motivation of the volunteers who participated in the flu clinics was higher than those who were called to participate but were unable to attend. In particular, motivation driven by a sense of community service was significantly higher between the MRC unit members who attended the event (factor scale mean value 84.9, SD 11.4) than those who did not (mean value 72.16, SD 17.6, t test P < .001). We found the same relation for level of motivation driven by personal development reasons: participating volunteers reported a higher score on that scale (mean value 62.6, SD 21.1), compared with nonparticipants (mean value 56.6, SD 22.7, t test PP <.001). This result is in support of the criterion-related validity of the instrument. Differences were found by age as well: The percentage of volunteers who reported having participated in an MRC unit activity in the previous 6 months increased with age: 20 to 30 years (38%), 31 to 40 years (49%), 41 to 50 years (63%), 51 to 60 years (67%), and older than 60 years (80%). Assuming that past participation predicts one's future participation, these data show that older volunteers are more likely to participate (χ2, P < .001). These results may be helpful in designing different campaigns to improve the engagement of younger and older volunteers that aim to reward their participation by targeting the different reasons that motivate them.
Identification of Reasons That Prevent Volunteers From Participating
Data from the Barriers to Volunteering Questionnaire from the 2008-2009 and 2009-2010 flu seasons were analyzed, with a total of 301 questionnaires, to identify reasons that prevented volunteers from participating in the flu clinic activities. For example, 60% were not able to participate because of job duties, which may suggest more availability of volunteers during weekends rather than weekdays or outside business hours. Other barriers to participation were as follows: 24% of volunteers would have been able to participate if child care were provided, 26% did not have transportation, and 28% believed they needed additional information on the activity they were required to attend. These data, along with differences across units in these matters and beyond our sample, may suggest strategies to increase participation such as provision of child care, transportation, or better communication. In addition, 15% of volunteers believed that they did not receive enough advance notice to be able to participate, which suggests that volunteers who are available for routine activities may not be available in an emergency.
Identification of Categories of Volunteers Who Are More Confident Than Others
Health care and public health workers reported higher scores on the scale describing confidence in interacting with the client/patient (mean value 67.0, SD 14.7) than volunteers not belonging to this professional category (mean value 61.2, SD 16.9); the difference in mean scores was statistically significant (t test P < .001). Health care and public health workers were also more likely to be motivated by the importance of community service than were others (t test P = .04). In addition, before collecting the data, we hypothesized that the level of motivation would be correlated with the perception of the severity of 2009 H1N1 and whether volunteers believed that they could make a difference in their community by volunteering. We found a positive and significant correlation between these 2 factors and the volunteers' level of motivation driven by a sense of community service (ρ = 0.17 and 0.27 respectively, P < .001). ICS awareness seemed not to differ across categories of volunteers defined by professional role or age; however, volunteers who reported that they were not assigned to an appropriate role during the flu clinic activities scored lower in ICS awareness compared with those who felt comfortable about the role to which they were assigned (t test P = .01). These volunteers also felt more confidence in interacting with the client/patient (t test P < .001). These results suggest that MRC coordinators should pay attention to identifying appropriate roles for their volunteers, taking into consideration that health care and public health workers feel more comfortable than others in interacting with the public.
COMMENT
The evaluation approach used in this project is a step toward the development and application of standard tools and methods for quality improvement in public health emergency preparedness volunteer activities. According to the Institute of Medicine, it has been difficult to objectively assess gaps and measure the progress that has been made in emergency preparedness. In particular, there is a critical need to establish and validate metrics and criteria that will enable public health systems to achieve continuous improvement and demonstrate the value of society's investment.12 Volunteer organizations are an important component of the public health system and are facing the same challenges in measuring their progress and performance over time. Goal-setting and measurement strategies, however, do not necessarily lead to improvements in quality.12 Indeed, a successful emergency preparedness plan requires the assignment of accountability and continuous improvement rather than one-time initiatives.Reference Seid, Lotstein and Williams13 Because they occur on a regular basis, flu clinics can be useful settings for measuring and improving emergency response capabilities.Reference Seid, Lotstein and Williams13
With demonstrated reliability, validity, comprehensiveness, utility, and practicality, the instruments we have developed can be used to improve the performance of MRC units and partially fill the gap that the Institute of Medicine identified. Beyond using the results of the instruments to make changes within their own unit, MRC units also could compare their survey results with other MRC units in their region or nationally—a form of benchmarking—to identify their strengths and weaknesses, in the context of learning collaboratives. Learning collaboratives are structured venues for organizations to improve their service delivery systems by testing and implementing changes and comparing them with those of other organizations.Reference ØVretveit, Bate and Cleary14 Modeled after the Breakthrough Series developed by the Institute for Healthcare Improvement,15Reference Lotstein, Seid and Ricci16Reference Nembhard17 learning collaboratives could help close the gap between the actual and the ideal performances in public health emergency preparedness.Reference Lotstein, Seid and Ricci16
Although developed for the specific use of MRC volunteers deployed to flu clinics, the instruments developed and tested in the present study could be applied to any type of volunteer organization, and with appropriate modifications, they could have applications that are broader than flu clinics.
CONCLUSIONS
Despite substantial investments in public health preparedness, validated metrics to ensure accountability, enable systems improvement, and advance knowledge remain largely nonexistent. To help fill this gap, we developed valid and reliable instruments to assess MRC volunteers' performance and barriers to participation. We developed 2 instruments and found them to be reliable with face and content validity and preliminary evidence of construct and criterion-related validity. MRC coordinators may thus be able to use these questionnaires to monitor the effectiveness and impact of engaging volunteers in public health activities.
Author Disclosures: The author reports no conflicts of interest.
Acknowledgements The authors thank the National Association of County and City Health Officials for funding this project (contract No. 2008-103003-4); Capt Robert J. Tosatto, director, Office of the Civilian Volunteer Medical Reserve Corps, and Charlie Ishikawa, regional public health planner, Advanced Practice Center for Cambridge, MA, for providing scientific and intellectual expertise during the design of the toolkit; and the staffs of the local health departments and MRC units from Sacramento and Marin counties (CA), McLean County (IL), the cities of Belmont, Boston, Brookline, and Cambridge (MA), the city of Derry (NH), the cities of Somerville and Asbury Park (NJ), the city of Stow (OH), Harris County (TX), and the cities of Alexandria, Arlington, and Fairfax (VA) for giving us the opportunity to implement the toolkit and for the valuable feedback.