





Background
Carbapenem-resistant Enterobacterales (CRE) infections are an urgent public health threat in the United States. 1 Recent 30-day crude mortality rates for CRE infections in the country vary from 9% to 24%. Reference Kirtz, Chan, McClanahan and Octaria2 – Reference Wang, Earley and Chen5 Colonization with CRE predisposes hospitalized patients to infection during their hospital stay Reference Willems, van Dijk and Vehreschild6,Reference Wang, Liu and Li7 and facilitates spread to non-colonized patients through direct or indirect contacts, with patients colonized with CRE acting as a source of transmission. Reference Mangalea, Halpin, Haile, Elkins and McDonald8 Despite updated recommended infection prevention and control (IPC) measures, Reference Siegel, Rhinehart, Jackson and Chiarello9 – Reference Shingler-Nace, Birch, Hernandez, Bradley and Slater-Myer16 CRE rates in US hospitals have not declined since 2012. Reference Jernigan, Hatfield and Wolford17,Reference Wolford, McCarthy and Baggs18 Therefore, novel pathogen reduction strategies Reference Septimus and Schweizer19 – 21 focused on patients colonized with CRE may decrease CRE incidence in healthcare. Reference Jernigan, Hatfield and Wolford17,Reference Woodworth, Walters and Weiner22
In addition to the direct patient benefit of reducing the risk of infection, pathogen reduction strategies also provide indirect benefits by reducing the risk of transmission to other patients. Reference Mangalea, Halpin, Haile, Elkins and McDonald8,Reference Toth, Samore and Nelson20,Reference Gussin, McKinnell and Singh23 An ideal pathogen reduction therapy would reduce colonization duration, bioburden, or progression to clinical infection in CRE-colonized patients and lower CRE transmission in the inpatient population. Examples include topical agents like chlorhexidine, Reference Gussin, McKinnell and Singh23,Reference Huang, Singh and McKinnell24 gut-based interventions like fecal microbiota transplant or fecal microbiota spores Reference Straub, Lombardo and Bryant25 – Reference Adamowicz, Kraft and Ward27 , or phage therapy. Reference Forsyth, Barron and Scott28 Although such drugs or agents are not yet commonly used for CRE pathogen reduction, mathematical models can assess their potential benefits under multimodal intervention strategies.
This study uses agent-based model (ABM) simulations to analyze CRE transmission in US acute-care hospital settings, allowing for a granular analysis of patient-and unit-level heterogeneities. Insights from this study may help guide the design of targeted strategies to reduce CRE transmission in acute-care hospitals.
Methods
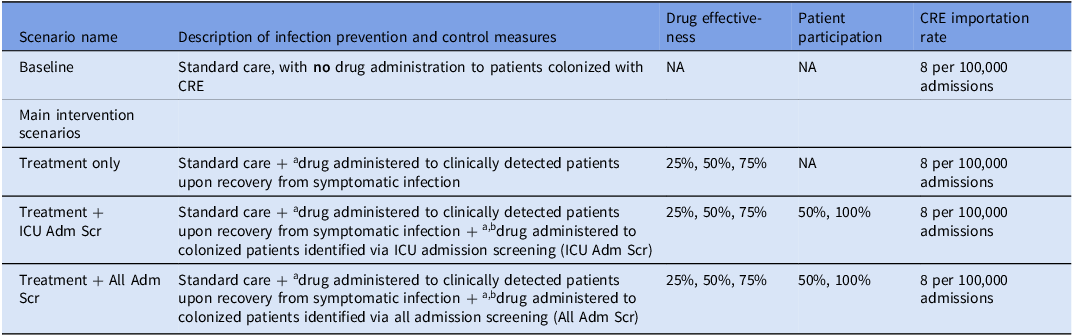
We developed an ABM of CRE transmission in an acute-care hospital to simulate baseline and intervention scenarios (Table 1). All scenarios included standard care—hand hygiene by healthcare personnel (HCP) before entering or after leaving patient rooms and contact precautions for patients colonized with CRE. In intervention scenarios, standard care was combined with a novel pathogen-reduction drug administered to patients detected as colonized with CRE, either through clinical detection or surveillance (ICU or all-hospital admission screening).
Scenarios/strategies examined in this study

Table 1. Long description
A table with four rows and five columns comparing infection prevention and control measures across different scenarios. The columns are Scenario name, Description of infection prevention and control measures, Drug effectiveness (DE), Patient participation (PP), and CRE importation rate. The rows are Baseline, Treatment only, Treatment + ICU Adm Scr, and Treatment + All Adm Scr. The Baseline scenario describes standard care with no drug administration, and the CRE importation rate is 8 per 100,000 admissions. The Treatment only scenario describes standard care with a drug administered to clinically detected patients upon recovery, with drug effectiveness values of 25 percent, 50 percent, and 75 percent, and the CRE importation rate is 8 per 100,000 admissions. The Treatment + ICU Adm Scr scenario describes standard care with a drug administered to clinically detected patients upon recovery and to colonized patients identified via ICU admission screening, with drug effectiveness values of 25 percent, 50 percent, and 75 percent, patient participation values of 50 percent and 100 percent, and the CRE importation rate is 8 per 100,000 admissions. The Treatment + All Adm Scr scenario describes standard care with a drug administered to clinically detected patients upon recovery and to colonized patients identified via all admission screening, with drug effectiveness values of 25 percent, 50 percent, and 75 percent, patient participation values of 50 percent and 100 percent, and the CRE importation rate is 8 per 100,000 admissions.
Note: Standard care (unchanged across scenarios) included hand hygiene and contact precautions. ICU, intensive care unit; Adm Scr, admission screening; CRE, carbapenem-resistant Enterobacterales; NA, not applicable.
a This scenario involved a hypothetical novel pathogen-reduction drug that cleared CRE carriage in an average of 3 days. Reference Toth, Samore and Nelson20 Patients identified via screening received the drug upon detection, whereas clinically identified CRE patients first received antibiotic treatment for 10 days on average to recover from symptomatic infection before receiving the drug.
b Two patient participation rates 50% (a rate likely attainable in real-world hospitals) and 100% (optimal) were assumed in ABM simulations.
Main intervention scenarios combined clinical and surveillance-based identification across three drug effectiveness (DE) levels and two patient participation (PP) rates (Table 1). We also modeled treatment plus a 60-day point prevalence survey (PPS) in the highest-census inpatient unit on the PPS day, and treatment plus a 60-day PPS combined with all-admission screening. Sensitivity analyses of the latter examined a slow-acting drug, more frequent PPS, and zero CRE importation. A universal strategy (administering the drug to all admitted patients) was also evaluated. All intervention strategies are detailed in Supplementary Table 1.
The ABM is briefly described using the nine elements of the Modeling Infectious Diseases in Healthcare Network (MInD-Healthcare) Framework, Reference Slayton, O’Hagan and Barnes29 with detailed information provided in Supplementary Materials.
Purpose and scope
The ABM simulated CRE transmission dynamics in an example US acute-care hospital to assess strategies for delivering a hypothetical novel drug to CRE-colonized patients to reduce transmission.
Entities, state variables, and scales
Patients, HCP, and people in the surrounding community (population 100,000) are entities/agents in the ABM. The model represented a 100-bed hospital with single-occupancy rooms: 85 in four general wards and 15 in an intensive care unit (ICU). Unit types differed in staffing ratios, length of stay (LOS), and transmission. Intra-ward HCP (e.g., nurses) provided care in one unit while inter-ward HCP (e.g., physicians) in multiple units. Patient health states (Figure 1), community members’ recent hospitalization history and postdischarge colonization status, and HCP contamination states (contaminated/non-contaminated) served as state variables of the model. Hospitalization history was tracked for up to 365 days after discharge; those discharged colonized remained colonized until spontaneous clearance. HCP contamination was assumed to be transient and did not lead to colonization or infection.
Flow diagram showing patient carbapenem-resistant Enterobacterales (CRE) state transitions. The diagram illustrates the states for a patient within the hospital: non-colonized (susceptible), colonized with CRE (not detected), detected colonized (identified via surveillance), or having an active CRE infection (identified via a clinical culture). Solid arrows indicate the primary pathways. Non-colonized patients could acquire CRE from the contaminated hands of healthcare personnel (HCP), becoming colonized. A colonized patient could then be identified through surveillance, moving to the “detected colonized” state, or they could develop an infection and be identified by a CRE-positive clinical culture. Patients who recover from an active infection also transition to the “detected colonized” state. Colonized patients could lose colonization spontaneously; loss of colonization is depicted by solid arrows for undetected colonized patients and dash-dotted arrows for detected colonized patients likely to receive the drug. Patients with clinical cultures positive for CRE and detected colonized patients were placed under contact precautions (dotted rectangles). The effectiveness of contact precautions was influenced by HCP adherence to standard infection prevention and control measures, including hand hygiene and the use of gloves and gowns, which were assumed to reduce CRE transmission. For clarity, admission and discharge processes are not shown. Patients could be admitted in either the non-colonized or colonized state and discharged in either state. Patients with active CRE infection were assumed to remain hospitalized while receiving antibiotic treatment for an average of 10 days. During this treatment period, they either would die due to the infection or survive, in which case they transition to the “detected colonized” state.

Initialization
We used a two-phase initialization. Phase 1 was a 5-year burn-in without CRE transmission to stabilize bed occupancy. Beginning with 20 colonized patients, Phase 2 simulated CRE transmission for 2 years; the first year as an additional burn-in to stabilize CRE transmission, and the second as the intervention/analysis period. All scenarios used standard care throughout Phase 2, and intervention-specific additional IPC measures (Table 1 and Supplementary Table 1) were introduced at the start of Year 2.
Process overview and scheduling
Dynamic processes/events were scheduled stochastically. Reference Keeling and Rohani.30 Independent events (e.g., admissions) advanced time, while dependent events (e.g., room assignment) followed immediately after and did not advance time. Rate-based events followed an exponential distribution; duration-based events used empirical data.
Input data
Parameters are listed in Supplementary Table 2. Age-stratified admission rates (Supplementary Table 4), LOS distribution (Supplementary Table 5), and daily rates of collection of clinical specimens for CRE detection (Supplementary Tables 6 and 7) were estimated from administrative healthcare databases.
Agent interactions and organism transmission
We modeled patient–HCP interactions with patients assumed to be confined to their rooms and HCP visiting them for care. Specific patient-care activities were not modeled explicitly. HCP visits triggered dependent processes: CRE transmission, and HCP compliance with hand hygiene and contact precautions. CRE transmission could occur only if patients and HCP were discordant in health states. Environment-mediated transmission was not considered.
Stochasticity
Both independent and dependent events were modeled stochastically, and each scenario was simulated 500 times, with outputs stored in a long-form event log (Supplementary Table 3).
Submodels
Submodels represented patient demographics, patient movement (admissions, discharges, and inter-unit transfers), HCP movements (shift changes and patient-care visits), CRE transmission under standard care (Supplementary Tables 8–10), and clinical specimen testing.
Model verification, calibration, and validation
We verified the expected functioning of the ABM by checking average bed occupancy, LOS, transfer probabilities between units, HCP visit rates, and sterile and nonsterile specimen collection rates. We also evaluated the effect of IPC measures on transmission: higher hand hygiene compliance reduced CRE spread as expected.
Following verification, we calibrated the model to match average CRE infection rates reported by Wolford et al. Reference Wolford, McCarthy and Baggs18 for 2022: 4.22 CRE infections per 10,000 hospitalizations overall—1.47 for hospital-onset and 2.75 for community-onset CRE infections. The calibrated model yielded a mean CRE colonization prevalence of 4.0%, falling within the 3.3% Reference Lin, Lyles-Banks and Lolans31 to 5.2% Reference Reuben, Donegan and Wortmann32 range reported for US acute care hospitals, thus supporting model validation. The model’s robustness was also tested via a recalibration using a 50% reduction in the 1-day readmission probabilities across age groups. Additional external validation using a compartmental ODE model is in Supplementary Materials.
Study outcomes and statistical analysis
The main outcome was incident CRE colonization; incident CRE infection was secondary. Both were expressed per 10,000 patient-days (PD), with the mean, median, and interquartile range (IQR).
Statistical analysis
We conducted three primary analyses on outcome data from the analysis period. First, we estimated the percent relative reduction in outcomes for each intervention scenario compared to baseline. Second, we assessed whether outcome distributions differed from baseline using the Mann–Whitney U test. Third, we used the two-sample Kolmogorov–Smirnov test for pairwise comparisons across all intervention scenarios to evaluate differences in the performance of each scenario relative to the rest. To do so, we compared the distributions of the main outcome. Both tests were applied in standard form to compare outcome distributions.
Estimation of percent relative reduction
Model outputs were not paired across scenarios because a given stochastic ABM run under one scenario did not follow the same trajectory under another scenario. We therefore treated each of the baseline and intervention outputs as separate empirical distributions and applied a nonparametric bootstrap. At each of 10,000 bootstrap iterations, we independently drew 1,000 samples with replacement from each of the baseline and intervention outputs, computed the resampled mean baseline rate and mean scenario rate, and calculated relative reduction as follows:
 $\small{\eqalign{ & {Relative\,reduction\,}\left(\% \right)\cr& =\left({{Resampled}\,mean\,{baseline}\,rate-{Resampled}\,mean\,{scenario}\,rate \over {Resampled}\,mean\,{baseline}\,rate}\right)\cr& \times 100. }}$
The resulting bootstrap distribution of these reductions was summarized by its mean, median, and IQR.
Data visualization
We visualized the main outcome rates as distributions using boxplots, along with mean percent relative reductions.
Calculation of clinical and surveillance specimens and drug administration
For each scenario, we also calculated the total number of admissions, clinical and surveillance specimens tested, and positive specimens during the analysis period. From these, we derived the median percentage of admissions screened (median surveillance specimens tested divided by median admissions) and the percentage of CRE-colonized patients administered the drug (median number of patients eligible for drug administration divided by median number of CRE-colonized patients). The number of patients eligible for drug administration was defined as the sum of positive clinical and surveillance specimens.
ChatGPT (OpenAI, GPT-5.1 Thinking) was used to assist with editing for clarity and conciseness, and all text was reviewed by the authors.
Results
CRE rates during intervention period
In baseline simulations, the mean CRE colonization incidence was 27.4 per 10,000 PD (IQR: 11.7–39.9). For the treatment-only strategy at 25% DE, the mean percent reduction in colonization incidence compared to baseline was 1.2% (IQR: −0.8%–3.2%). Figure 2 summarizes incident CRE colonization rates and percent reduction across all scenarios. Mean colonization rates declined as DE increased, with greater reductions in strategies involving colonization screening. Colonization and infection rates showed similar reduction patterns across scenarios (Supplementary Table 13). In treatment-only scenarios, colonization and infection rates decreased with increasing DE, but these reductions were not statistically significant.
Distribution of carbapenem-resistant Enterobacterales (CRE) colonization incidence rates. Each boxplot, drawn using MATLAB’s boxchart function, displays summary statistics: the mean (black filled circles), the median (mid-line of the boxplot), the interquartile range (IQR, defined by the lower and upper quartiles), the whiskers (dashed lines extending beyond the IQR), and the outliers (open circles). Whiskers extend to the smallest and largest values within 1.5 times the IQR from the quartiles. Scenarios are organized by two key factors: drug effectiveness (DE: 25%, 50%, 75%) and patient participation in ICU admission and all-admission screening programs at 50% and 100% rates. A horizontal dashed line, drawn at the baseline mean (y-axis), highlights percent relative reductions in incident CRE colonization rates across scenarios. Vertical solid black lines display the percent reduction in colonization incidence compared to baseline, with numeric labels indicating the mean of 10,000 bootstrap estimates of percent reduction, rounded to one decimal place, for each scenario. Box colors reflect DE levels, while screening-based scenarios are grouped by patient participation rates along the x-axis.

In screening-based scenarios, reductions were statistically significant across most DE and PP levels (Supplementary Table 13). For the treatment plus ICU admission screening scenario at DE = 50% and PP = 50%, the mean percent reduction was 9.0% (7.1%–11.0%), increasing to 13.2% (11.4%–15.1%) at PP = 100%. In most treatment plus scenarios, incident colonization/infection rates declined as PP rose from 50% to 100% (Supplementary Table 13).
Relative reductions increased with DE levels for treatment plus ICU admission screening and treatment plus 60-day PPS scenarios, except at 75% DE, where this trend differed in the former. In the ICU admission screening scenario, reduction was greater than in the 60-day PPS scenario as PP increased to 100% (Supplementary Table 13). Colonization rate distributions in both scenarios were not significantly different (p ≥ .05; Supplementary Table 14).
In all-admission screening strategies, mean incident CRE colonization rates ranged from 24.0 to 14.9 per 10,000 PD (Supplementary Table 13). For the treatment plus all-admission screening scenario at DE = 75% and PP = 100% but without PPS, the mean percent reduction was 38.5% (IQR: 37.1%–40.0%). The largest relative reduction, 45.5% (44.2%–46.8%), was observed at 75% DE and 100% PP with PPS, compared to 38.5% without PPS; again, the colonization rate distributions were not significantly different (p = .283; Supplementary Table 14). Adding 60-day PPS to Treatment + All Adm Scr further lowered CRE transmission, but its distributions were not significantly different from All Adm Scr without PPS in four out of six scenarios compared (p > .05; Supplementary Table 14).
Clinical and surveillance testing and administration of the drug
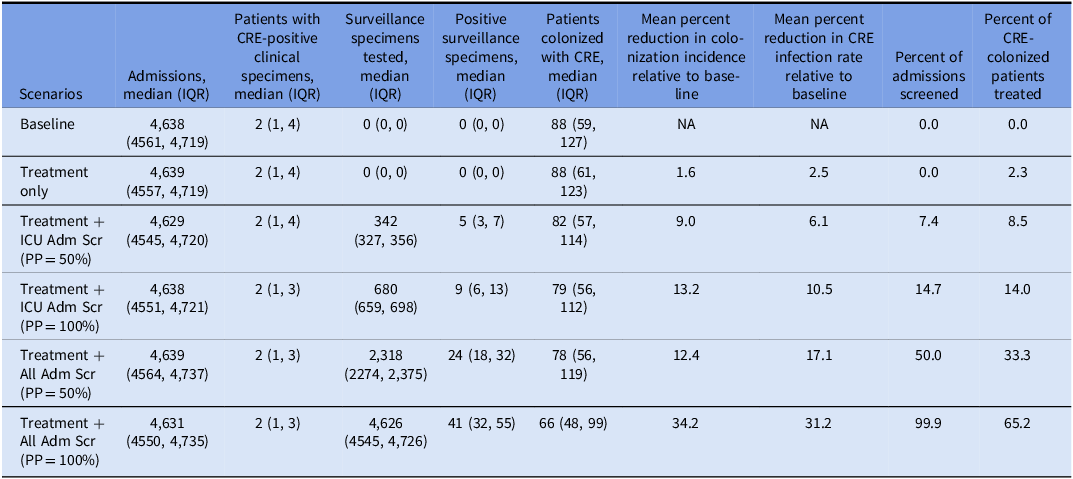
Table 2 shows that at DE = 50%, the treatment-only strategy resulted in a median number of 88 (61–123) CRE-colonized patients, the same as the baseline, with 2.3% of these patients receiving the drug. With PP = 50%, adding ICU admission screening increased patients screened from zero to 7.4% and the percentage of CRE-colonized patients receiving the drug to 8.5%, while reducing the median number of CRE-colonized patients to 82 (57–114) from 88. With PP = 100%, patients screened increased to 14.7% and the percentage of CRE-colonized patients receiving the drug to 14.0%, while reducing the median number of CRE-colonized patients to 79 (56–112). Patients screened in the all-admission screening strategy increased from 50.0% to 99.9% as PP rose to 100%. The corresponding median percentage of CRE-colonized patients administered the drug went up from 33.3% to 65.2%, while the median number of colonized patients declined from 78 (56–119) to 66 (48–99). This trend was seen across the other DE values across all admission screening scenarios (Supplementary Table 15).
Summary statistics of clinical and surveillance testing and drug administration for 50% drug effectiveness over the 1-year analysis period

Table 2. Long description
The table presents data on admissions, patients with CRE-positive clinical specimens, surveillance specimens tested, positive surveillance specimens, patients colonized with CRE, percent reduction in colonization incidence relative to baseline, percent reduction in CRE infection rate relative to baseline, percent of admissions screened, and percent of CRE-colonized patients treated across different scenarios. The scenarios include Baseline, Treatment only, Treatment + ICU Adm Scr (PP = 50%), Treatment + ICU Adm Scr (PP = 100%), Treatment + All Adm Scr (PP = 50%), and Treatment + All Adm Scr (PP = 100%). Each row provides median values and interquartile ranges (IQR) for these metrics. Notable trends include increases in the number of surveillance specimens tested and positive surveillance specimens with more comprehensive screening strategies, as well as reductions in the median number of CRE-colonized patients and increases in the percentage of CRE-colonized patients treated.
Medians and IQRs were calculated from 500 stochastic replicates. Count variables (admissions, specimens, positives, CRE-colonized patients) are totals over the 1-year analysis period. Mean percent reduction values are the mean of 10,000 bootstrap estimates of percent reduction. Values in the percent of admissions screened column were obtained by dividing the median number of surveillance specimens tested by the median number of admissions. For count data, we rounded medians and IQRs to the nearest whole number; percentages to one decimal place. “CRE-colonized patients” counts unique colonized patients present at any time during the analysis period (identified via clinical or surveillance testing). To calculate the “Percent CRE-colonized patients treated,” we divided the sum of the median numbers for patients with CRE-positive clinical and surveillance specimens by the median number of patients colonized with CRE. The sum represents the maximum number of patients eligible for the novel drug, including those who had recovered from a clinical infection. CRE, carbapenem-resistant Enterobacterales; ICU, intensive care unit; Adm Scr, admission screening; IQR, interquartile range; PP, patient participation; NA, not applicable.
Additional intervention scenarios
With a slow-acting drug (clearance time of 30 days), relative reductions (Supplementary Table 16) were lower compared to the original scenario, Treatment + 60-day PPS + All Adm Scr with clearance time of 3 days. At 75% DE, the mean relative reduction in colonization incidence decreased from 27.3% (25.6%–29.1%) to 19.0% (17.2%–20.7%) at PP = 50%, and from 45.5% (44.2%–46.8%) to 31.6% (30.0%–33.1%) at PP = 100%. In contrast, relative reductions in colonization incidence improved when the PPS interval was shortened from 60 days to 7 days or when the importation rate was set to zero, reaching up to 58.1% (57.2%–59.1%) and 66.4% (65.3%–67.6%) at 75% DE and 100% PP, respectively. Administering the drug to all admitted patients yielded better results than the scenario with the slow-acting drug, but not better than the original scenario. All sensitivity analyses produced significantly lower incidence rates compared to baseline (Supplementary Table 16).
Discussion
This modeling study demonstrates that a pathogen reduction drug could reduce the CRE incidence in US acute care hospitals. To be successful, patients who are colonized, but not yet infected or identified via clinical cultures, would also need to be treated. In this study, treating only patients identified via clinical cultures with a very effective and rapidly acting drug (DE of 75%) yielded only a small relative reduction in CRE colonization; however, a moderately effective drug (DE of 50%) administered to patients identified via ICU admission screening or clinical culture at PP = 100% (only 14.7% of all admissions were screened) yielded a 13.2% relative reduction in CRE colonization. Greater reductions in CRE colonization were observed when DE improved or as PP in screening increased. Applying this approach in other healthcare facilities (e.g., long-term care) could reduce the hospital importation rate, further amplifying these reductions. Reference Wolford, Khan and Paul33
The role of colonization in CRE infection is well established, Reference Willems, van Dijk and Vehreschild6– Reference Mangalea, Halpin, Haile, Elkins and McDonald8,Reference Shimasaki, Seekatz and Bassis34 but the benefits of treating asymptomatically colonized patients may be less appreciated. The reduction in methicillin-resistant Staphylococcus aureus and other multidrug-resistant organism infections observed with chlorhexidine and mupirocin suggest that this approach can work. Reference Gussin, McKinnell and Singh23,Reference Huang, Singh and McKinnell24,Reference Huang, Septimus and Kleinman35 In this study, we modeled the impact of pathogen reduction approaches by targeting asymptomatically colonized patients identified through admission screening, ICU screening, or single ward point prevalence surveys, demonstrating the potential value of treating these patients. Patient screening is one way that colonized patients can be identified but other approaches (e.g., treating all patients at regular intervals or using predictive algorithms to identify those likely to be colonized) may also work. Reference Huang, Septimus and Kleinman35– Reference Pei, Seeram, Blumberg, Shopsin, Uhlemann and Shaman40 Because reductions in CRE infection paralleled those in colonization, our results support strategies to improve patient safety by more effectively identifying colonized patients to receive the novel drug, rather than relying solely on routine clinical cultures.
The strengths of this study, unlike prior studies, Reference Kardaś-Słoma, Lucet and Perozziello41,Reference Pople, Kypraios and Donker42 include an evaluation of multiple pathogen reduction strategies, covering a wide range of DE and both realistic (50%) and optimal (100%) PP in screening programs. Our ABM accounted for inherent healthcare system complexities that affect CRE transmission dynamics. This detailed representation allowed us to assess how therapeutic-based interventions could reduce incident CRE rates under realistic conditions, offering insights into the development and implementation of patient-centric, targeted approaches to mitigate CRE in hospitals. Our study demonstrated that increasing the detection of colonized patients, and therefore the number of patients who receive the pathogen reduction therapy, results in larger reductions in facility CRE rates. These findings support recent calls Reference Talbot, Baliga and Crapanzano-Sigafoos43 to elevate IPC as a foundational healthcare function by demonstrating how integration of screening and therapeutic interventions can substantially reduce CRE rates, even under realistic adherence constraints.
There are several limitations. First, results rely on a calibrated model that may not fully capture real-world hospital complexities, such as environment-mediated transmission. While a fully validated ABM tailored to a particular hospital can address this limitation, Reference Scaria, Safdar and Alagoz44 the trend in relative reductions observed here is unlikely to differ significantly. Second, drug and screening effectiveness may vary with patient compliance and hospital-specific factors. For instance, a recent study Reference Sansom, Shimasaki and Dangana45 found 75% compliance with rectal/fecal swabs, midway between the realistic and optimal rates assumed. Consequently, the true impact of a novel drug may vary widely across settings. Nevertheless, our results, based on three drug-effectiveness levels and two patient-participation levels, show that adding a novel drug for colonized patients can significantly enhance CRE control in hospitals. Third, we do not explicitly model CRE transmission in the community. Although community-onset CRE cases appear persistent and are spreading geographically, outbreaks are still primarily observed in healthcare settings. Data to parameterize community models remain sparse, particularly for key parameters such as CRE acquisition and carriage clearance rates in otherwise healthy individuals. We accounted for this shortcoming by allowing a constant rate of importation of CRE-colonized patients into the facility, but this parameterization may be mis-specified if community dynamics play a larger role than assumed. Here, CRE importation was modeled at a constant rate, but because much of community-onset CRE is related to prior healthcare exposure, the treatment of colonized patients may decrease the importation rate, so our estimates may be conservative. This is consistent with our sensitivity analysis, in which eliminating importation led to larger reductions in incidence. In addition, although the treatment-only scenario did not substantially reduce facility-level CRE incidence, the drug may still confer patient-level benefits (such as decreasing the risk of infection in patients who received the drug) that are not fully reflected in our results. Extending the model to include community transmission and its influence on CRE spread in hospitals is an important direction for future research. Reference Kwon, Advani and Branch-Elliman46 Lastly, although this model assessed the intervention in an acute-care hospital, long-term care facilities play an important role in CRE transmission; the effect of pathogen reduction in these settings may be substantially greater. Reference Wolford, Khan and Paul33
In conclusion, this study demonstrates the potential of a novel pathogen reduction drug to strengthen efforts to reduce CRE incidence in hospital patients. The findings highlight the value of treating asymptomatically colonized patients and show that while more intensive screening strategies yield better results, they do so at a substantially higher operational cost to reduce CRE incidence. Therefore, future research and implementation efforts should focus on identifying pathogen reduction drugs, along with the best strategies to identify and administer the drug to asymptomatically colonized patients.
Supplementary material
The supplementary material for this article can be found at https://doi.org/10.1017/ice.2026.10472.
Acknowledgements
The authors declare that they have no known competing financial interests or personal relationships that could have appeared to influence the work reported in this paper. No funding source was used for this study.
Competing interests
The findings and conclusions in this report are those of the authors and do not necessarily represent the views and the official position of the Centers for Disease Control and Prevention.




 Open access

