INTRODUCTION
Parasitic flatworms (trematoda) are usually engaged in complex life cycles involving a molluscan first intermediate host (typically a gastropod), a second intermediate host of varying taxonomical identity and a definitive vertebrate host in which sexual reproduction occurs (Pechenik, Reference Pechenik2010). In the first intermediate host, a single invading parasite larva develops through asexual reproduction into a clonal colony of larvae (parthenitae) that eventually produces dispersal stages (cercariae) that leave the gastropod host in order to locate a suitable second intermediate host (Galaktionov and Dobrovolskij, Reference Galaktionov and Dobrovolskij2003).
Intramolluscan parthenitae colonies often occupy a substantial part of the host (c. 20% of soft-tissue across species), draining this limited resource for considerable amounts of energy (Hechinger et al. Reference Hechinger, Lafferty, Mancini, Warner and Kuris2009). However, a trematode colony is often forced to share the host with other con- or heterospecific parasites, and therefore faced with competition over host resources (Sousa, Reference Sousa1993; Kuris and Lafferty, Reference Kuris and Lafferty1994).
Theoretically, three basic parasite responses may be expressed under such exploitative parasite–parasite competition (Frank, Reference Frank1996; Jokela et al. Reference Jokela, Taskinen, Mutikainen and Kopp2005; Karvonen et al. Reference Karvonen, Rellstab, Louhi and Jokela2012). (1) Strategically increased rate of host exploitation (virulence) to achieve greater relative success within the host than the competitor; likely with host death as the ultimate outcome. (2) Continued exploitation of the host at a (perhaps) genetically fixed rate, which also may jeopardize the survival of multiple infected hosts. (3) Reduced rate of host exploitation, either as an adaptive strategy to keep the host alive under the virulent competitive regime or as an immediate metabolic response to reduced levels of available nutrients within the haemolymph of the host.
Among trematodes, the empirical evidence for any of these scenarios is limited indeed. No evidence supports the increased exploitation scenario, and only weak and equivocal support exists for an unchanged exploitation strategy (Curtis and Hubbard, Reference Curtis and Hubbard1993; Davies et al. Reference Davies, Fairbrother and Webster2002; Jokela et al. Reference Jokela, Taskinen, Mutikainen and Kopp2005). Reduced host exploitation has received most support as the colony fitness in terms of cercarial emission rate is found markedly reduced under competition in a range of distantly related trematode species (DeCoursey and Vernberg, Reference DeCoursey, Vernberg and Vernberg1974; Walker, Reference Walker1979; Karvonen et al. Reference Karvonen, Rellstab, Louhi and Jokela2012; Lloyd and Poulin, Reference Lloyd and Poulin2012).
Reduced food availability, leading to host starvation, can also decrease the amount of resources available to the parasite and in turn cause the colony fitness to decline. This may be particularly evident in multiple infections where the parasites already compete for available resources. Such effects of host starvation have found support in a handful of different trematode–snail systems (Kendall, Reference Kendall1949; Ataev, Reference Ataev1991; Keas and Esch, Reference Keas and Esch1997; Seppälä et al. Reference Seppälä, Liljeroos, Karvonen and Jokela2008; Lloyd and Poulin, Reference Lloyd and Poulin2013).
Trematodes sharing the same host individual may also launch direct antagonistic activities against the coexisting competitor for its elimination (Lie et al. Reference Lie, Basch and Umathevy1965; Basch et al. Reference Basch, Joe and Heyneman1970; Hechinger et al. Reference Hechinger, Wood and Kuris2011; Leung and Poulin, Reference Leung and Poulin2011; Miura, Reference Miura2012; Nielsen et al. Reference Nielsen, Johansen and Mouritsen2014; Mouritsen and Halvorsen, Reference Mouritsen and Halvorsen2015). Such competitor elimination, mainly attained through predation, appears a common outcome in light of lower in situ frequencies of multiple infections than expected by chance in most host populations (DeCoursey and Vernberg, Reference DeCoursey, Vernberg and Vernberg1974; Sousa, Reference Sousa1993; Kuris and Lafferty, Reference Kuris and Lafferty1994; Keeney et al. Reference Keeney, Boessenkool, King, Leung and Poulin2008; Mouritsen and Halvorsen, Reference Mouritsen and Halvorsen2015).
However, trematode species differ in their ability to eliminate competitors, which depends on their life-history characteristics (Sousa, Reference Sousa1993; Kuris and Lafferty, Reference Kuris and Lafferty1994; Galaktionov and Dobrovolskij, Reference Galaktionov and Dobrovolskij2003). Species having an intramolluscan parthenitae colony composed of sporocysts (e.g. Strigeidida and Plagiorchiida) are unable to engage in predatory attacks, as these larval stages are largely immobile sacs lacking a digestive system. In contrast, species that have redial stages (e.g. Echinostomida and Heterophyidae) have their highly mobile larvae equipped with a complete digestive system, including large mouthparts, pharynx and stomach, which allow direct predatory attacks on competitors.
New evidence even suggests that some redial species have evolved a functionally structured larval colony divided into two groups, a reproductive caste of large and less mobile rediae producing the cercarial dispersal stages, and a defensive caste of much smaller and highly mobile rediae (Hechinger et al. Reference Hechinger, Wood and Kuris2011; Leung and Poulin, Reference Leung and Poulin2011; Miura, Reference Miura2012; Nielsen et al. Reference Nielsen, Johansen and Mouritsen2014; Mouritsen and Halvorsen, Reference Mouritsen and Halvorsen2015). Although the small rediae likely have roles to play other than defence (see Galaktionov et al. Reference Galaktionov, Podvyaznaya, Kirill and Levakin2015; Mouritsen and Halvorsen, Reference Mouritsen and Halvorsen2015), a main function indeed appears to be seizing and killing co-occurring hetero- and conspecific competitors. Greater colony success in absence of competitors is a potential selective force driving the evolution of such apparent division of labour in redial colonies. The presence of a well-defined group of clonally produced defenders will potentially allow for a strategically adjustment of their relative frequency to counteract the competitive threat against the overall fitness of the colony.
Still very little is known about parasite resource allocation and fitness under competition, and how this is mediated by parasite life-history characteristics and environmental conditions (e.g. host condition). Extended knowledge on these issues is crucial to our understanding of host–parasite interactions in general and more specifically to qualify the resent unconventional ideas of socially organized trematode colonies as a parasite–parasite antagonistic measure (op. cit.). Hence, the aims of this study were to (1) quantify fitness consequences of competition between two trematode species with different life-history (redia vs sporocyst parthenitae colony) and exposed to different levels of host starvation, and (2) elucidate whether or not redial colonies respond strategically to the presence of a competitor by producing more defensive larval stages. As model system, we used host–parasite associations hitherto unstudied in this respect: common periwinkles, Littorina littorea, infected by Renicola roscovita (Renicolidae, sporocyst colony) and Himasthla elongata (Echinostomatidae, redia colony). The latter is known to display an age-structured parthenitae colony, where especially the juvenile rediae are engaged in colony defence (Nielsen et al. Reference Nielsen, Johansen and Mouritsen2014; Galaktionov et al. Reference Galaktionov, Podvyaznaya, Kirill and Levakin2015; Mouritsen and Halvorsen, Reference Mouritsen and Halvorsen2015).
MATERIALS AND METHODS
Collection, storage and acclimation of animals
Common periwinkles (L. littorea) were collected in March 2016 within 10 m of the mean high water line along the shores of the northern part of Knebel Bay, Denmark (56°13′41·2″N 10°27′47·4″E). Here, the periwinkles are known commonly to host parthenitae colonies (i.e. infrapopulations) of H. elongata and R. roscovita. Solely larger and hence mature snails were targeted (>15 mm in shell height), and in total 408 individuals were collected, returned to a temperature-controlled room and divided evenly between eight storage boxes (40 × 30 × 20 cm) containing natural seawater (10 L) and an air supply. The thermo-room was set at 5 °C corresponding to the in situ water temperature at the point of collection.
The snails were gradually acclimated to 16 °C by elevating water temperature in three steps: 5 days at 5 °C, 5 days at 10 °C and 5 days at 16 °C. The final storage temperature of 16 °C, well below average summer temperatures of 18–20 °C in Danish coastal waters, ensured development of cercariae within the trematode-infected snails without triggering massive release of these dispersal stages. Cercarial emission is particularly pronounced at temperatures above 20 °C (Galaktionov and Dobrovolskij, Reference Galaktionov and Dobrovolskij2003).
During the entire acclimation process, snails had ad libitum access to freshly collected and rinsed sea lettuce, Ulva lactuca, and the seawater (21–27 psu) was renewed every 5 days, where also snails that have died were removed.
Because littorinids established in storage tanks often show geonegative behaviour (i.e. moving out of the water), the first weeks after collection, even though food is offered at the tank bottom, escaped snails were regularly returned by placing them on top of the administered food source (when present) on the bottom. Despite that this procedure was executed throughout the study period, the escape behaviour likely resulted in great variance in the amount of food each individual periwinkle processed. Roughly estimated, one-third of the snails were not feeding at any given time when offered ad libitum food.
Fitness of trematode colonies
The fitness of individual trematode colonies was estimated as cercarial emission rate from host snails at elevated temperature. After the final 5 days of acclimation at 16 °C, each snail was numbered, their shell height (apex to aperture) measured using a digital caliper (0·1 mm) and then individually transferred to correspondingly numbered glass containers (70 mL) filled with freshly collected seawater (16 °C, 21–27 psu). Each glass container was equipped with a lid allowing gas exchange but preventing snails from escaping from the water column. The experimental glasses were then placed under light in a 23 °C thermo-room for 4 h.
Following the 4 h incubation period, snails were removed from the glasses and returned to their storage boxes at 16 °C, whereas the glasses containing shed cercariae were placed in a refrigerator (5 °C) until enumeration of cercariae under a stereomicroscope the following day. This cercarial emission procedure was repeated every third day during 27 days, resulting in 10 shedding trials.
After the first two shedding trials (days 1 and 4), those snails that had not shed cercariae in any of the two trials were considered as either uninfected snails or snails harbouring immature infections and consequently excluded from further processing.
Effect of host resources on cercarial emission
To evaluate the impact of the host's nutritional condition on trematode colony fitness, ad libitum food (sea lettuce) was offered to the snails during the period of the first five shedding trials (days 1–13) followed by starvation (no algae present) during the period of the last five shedding trials (days 13–27). No control treatment was established, neither for the period of ad libitum food (i.e. a control group of starved snails) or the period of starvation (i.e. a control group of ad libitum feed snails). This experimental design was chosen in order to avoid critical loss of statistical power as the frequency of multiple infected snails was expected to be low.
Post-experimental dissection: colony structure
After the 4 weeks repeated cercarial shedding trials, all 15 surviving double-infected snails (i.e. snails infected by both H. elongata and R. roscovita as judged by cercarial shedding) were dissected under a stereomicroscope to verify infection status and to estimate the size of the two harboured trematode colonies. The latter allowed correction of cercarial emissions for colony size. The snail shell was cracked with pliers without damaging the soft tissue, which was removed in one piece from the shell fragments. The drained wet weight of the snail soft parts (drained on tissue paper) was measured on a digital laboratory balance (±0·001 g), and the posterior visceral mass that contains the vast majority of the targeted trematode larvae was retrieved by cutting just behind the kidney.
By use of fine tweezers under a stereomicroscope, the interconnected light-yellow to orange coloured sporocyst mass of R. roscovita was then outdissected intact and its drained wet weight measured as a proxy for colony size. Wet weight rather than sporocyst numbers was targeted because separation of the renicolid larval colony into individual members is not possible without damaging the sporocysts, making accurate enumeration impossible. As a measure of colony maturity, also the colour of the sporocyst mass was judged by assigning it to one of two categories: whitish-yellow (immature) or orange (mature) (Clausen et al. Reference Clausen, Larsen, Iversen and Mouritsen2008). The remaining visceral tissue was then torn apart in a small seawater-containing plastic dish to release the embedded H. elongata rediae. The redial solution was cleared for snail-tissue remains and the number of reproductive and non-reproductive larvae was recorded. This allowed an analysis of the influence of infection type (single or double infection) on the colony structure of Himasthla. Non-reproductive rediae were distinguished from reproductive rediae by their much smaller size, lack of pigments, and lack of developing cercariae within their body (see Nielsen et al. Reference Nielsen, Johansen and Mouritsen2014; Mouritsen and Halvorsen, Reference Mouritsen and Halvorsen2015).
Aside from the 15 double-infected snails, also 27 haphazardly chosen experimental snails infected solely by H. elongata and 13 infected solely by R. roscovita were dissected and processed as above. All periwinkles initially entered in the sequence of cercarial shedding trials survived at least the first two trials, and comprised 155 individuals infected by H. elongata, 25 by R. roscovita and 26 by both species of trematodes.
Data analysis
As the 10 conducted cercarial shedding trials were separated into two host food treatments – ad libitum food (n = 5 trials) and no food (n = 5 trials) – the unit for analysis was mean cercarial emission rate by individual snails across the five shedding trials for each food treatment. General linear models (GLMs) with repeated measures (ad libitum food/starved) was then applied on raw data or if necessary on log-transformed data to normalize data and meet variance requirements (evaluated by residual plots, Box's test for equality of covariance matrices, Mauchly's test for sphericity and Levene's test for equality of error variance). Two separate GLMs were executed for each involved trematode species: one targeting mean cercarial emission rate per host individual (default measure) and one targeting mean cercarial emission rate corrected for colony size (i.e. per reproductive rediae in case of Himasthla and per mg sporocyst mass in case of Renicola) as dependent variable. Infection type (single or double infection) was entered as a fixed factor and host size (shell height) was entered as a covariate. Although mean shell height was deliberately achieved to be roughly similar in contrasted groups of periwinkles, host size (or age) is known to relate to colony structure and cercarial emission rate in comparable host–parasite systems (e.g. Poulin, Reference Poulin2006; Leung and Poulin, Reference Leung and Poulin2011). Hence, shell height was included in full model GLMs to elucidate this variable's impact on the emission data.
The repeated measure approach reduced effective sample sizes somewhat as solely host individuals that survived at least the first seven shedding trials (through day 19) were included. Furthermore, due to the great labour involved in acquiring data on colony size and structure, analyses of colony-corrected emission rates were completed only for a subset of host snails that managed to survive the entire experiment and thus could be dissected.
Because no controls were established for the two food treatments, the temporal development in cercarial emission (per host individual only) was further analyzed (when relevant) for all 10 shedding trials separated by using an analysis of covariance (ANCOVA) approach evaluating the interaction between food treatment (fixed factor) and time (day of shedding trial) as covariate. Because of the repeated measure design, data from individual shedding trials are not independent as required in standard analyses of variance. However, using the ANCOVA's interaction term for contrasting the rate of temporal change in cercarial emission during the two food regimes is nonetheless a fully valid approach. Data were log-transformed prior to analysis in order to meet requirements of normality and equality of error variance. For similar reasons, solely data from snails that actually emitted cercariae during the trials were included.
Aside from the above statistics, solely standard two-sample tests and frequency analyses were conducted. All tests were carried out in Statistical Package for the Social Sciences (IBM SPSS) 22·0.
RESULTS
During the 4 weeks of cercarial shedding trials, approximately one-third of the snails died. The mortality rate was statistically similar across infection types (single and double infections) as 28·4% Himasthla-infected, 36·0% Renicola-infected and 30·8% double-infected hosts circumvented (Pearson χ 2 test, χ 2 2 = 0·618, P = 0·734, n = 206).
Fitness of Himasthla colonies
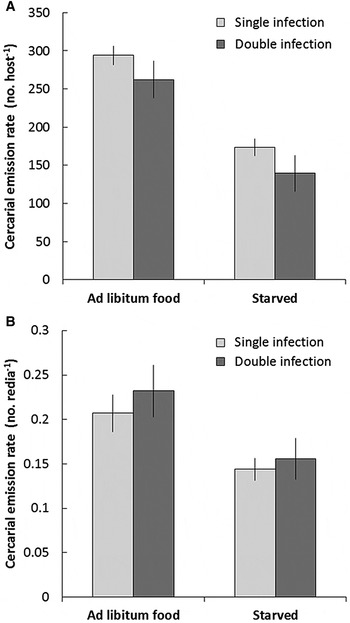
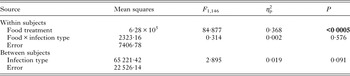
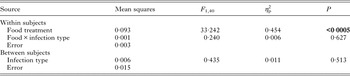
Considering all data available, Himasthla colonies of single-infected host snails produced slightly more cercarial dispersal stages on average than those coinfected by R. roscovita whether or not hosts were fed (Fig. 1A). Correcting cercarial emission rates for colony size, which mirrors the parasite colonies immediate fitness response more accurately than emissions per host individual, showed the opposite pattern: double-infected snails produced more cercariae than single-infected snails (Fig. 1B). None of these trends were statistically significant though, and the fitness of Himasthla colonies in terms of cercarial emission rate can be considered independent of the coinfecting parasite R. roscovita, explaining <2% of the variation (Tables 1 and 2). Food treatment, on the other hand, seemed to influence emission rates significantly with an almost 2-fold higher cercarial production during the period of ad libitum food than during starvation (Fig. 1, Tables 1 and 2). No interaction between food treatment and infection type was evident, and in total up to 45% of the variation in emission rates was explained by food treatment.
Cercarial emission rates (mean of mean no. 4-h−1 ± s.e.) of Himasthla elongata (A) per colony (i.e. per host individual) and (B) per reproductive rediae in colony for single-infected (Himasthla only) and double-infected (Himasthla and Renicola roscovita together) periwinkles Littorina littorea offered ad libitum access to sea lettuce Ulva lactuca (days 1–13) and starved (no algae present, days 13–27). Sample sizes (A; all available data): n single, feed = 155, n single, starved = 120, n double, feed = 26, n double, starved = 22. Sample sizes (B; dissected hosts only): n single = 27, n double = 15.

Summary statistics of reduced model GLM with repeated measures including cercarial emission rate by Himasthla elongata colonies (no. 4-h−1 host snail−1, untransformed data) as dependent variable, food treatment (repeated measure: ad libitum food followed by starvation) and infection type (single infection or coinfection with Renicola roscovita) as independent fixed factors

η p 2 denotes squared partial eta, i.e. proportion of variance explained. Statistically significant differences are highlighted in bold. Note that sample sizes are reduced in this GLM relative to Fig. 1A due to the repeated measure approach requiring valid data from both food treatments (i.e. only data from snails surviving at least through day 19 are included).
Summary statistics of reduced model GLM with repeated measures including cercarial emission rates by Himasthla elongata corrected for colony size (no. 4-h−1 reproductive redia−1, untransformed data) as dependent variable, food treatment (repeated measure: ad libitum food followed by starvation) and infection type (single infection or coinfection with Renicola roscovita) as independent fixed factors (see Fig. 1B for raw data)
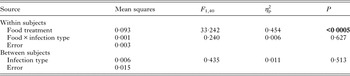
η p 2 denotes squared partial eta, i.e. proportion of variance explained. Statistically significant differences are highlighted in bold.
Mean shell height as a potentially interacting factor was generally similar between single- and double-infected hosts included in the above GLMs on uncorrected cercarial emissions (respectively, 24·0 ± 0·16 and 23·8 ± 0·55 mm; Student's t-test, t 134 = 0·482, P = 0·630) and emissions corrected for colony size (respectively, 24·1 ± 0·35 and 24·1 ± 0·51 mm; Student's t-test, t 40 = 0·118, P = 0·907). Furthermore, preceding full GLMs, including also host shell height as a covariate, demonstrated no significant host size effect on cercarial release nor any significant host size interactions (uncorrected for colony size: F 1,133 ⩽ 1·869, P ⩾ 0·174; corrected for colony size: F 1,39 ⩽ 0·112, P ⩾ 0·740), and host size was therefore ignored in the proceeding reduced GLMs (Tables 1 and 2).
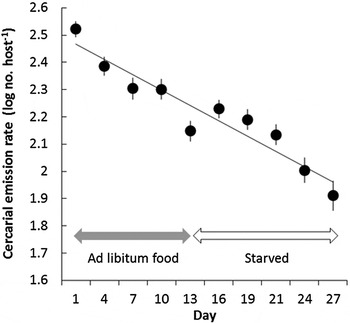
Because the sequentially administered food treatments influenced emission rates, the temporal development in cercarial shedding rates was analysed in detail for single- and double-infected hosts combined (in absence of statistical significant difference between infection types). This showed a steady declining trend in emission rates as a function of time (Fig. 2; see Supplementary material for emission rates separated into infection types). Using an ANCOVA entering mean cercarial emission rate as dependent variable, food treatment as a fixed factor (ad libitum or starved) and day as a covariate to evaluate the impact of food treatment on the slope of the emission-day regressions, revealed no significant interaction (i.e. no difference in slope; F 1,5 = 0·143, P = 0·721). This was statistically evident also when applying data from individual hosts instead of means across individuals (interaction term: F 1,1487 = 0·050, P = 0·945). Hence, the declining pattern in cercarial emission rates as a function of time appeared unaffected by the experimentally introduced food treatments as Fig. 1 otherwise indicates. However, interpreting this pattern as a temporal development entirely independent of host nutritional state will be erroneous. As emphasized (Materials and Methods), although snails were offered sea lettuce ad libitum many were not eating, likely resulting in an increasingly food-stressed host population during the course of the experiment. The removal of the food source from day 13 may thus have had limited further impact on the already declining nutritional state of the average host, mirrored in the also declining parasite fitness [Fig. 2; see Lloyd and Poulin (Reference Lloyd and Poulin2012) for similar temporal emission pattern in philophthalmids].
Cercarial emission rate (mean log no. 4-h−1 ± s.e.) of Himasthla elongata colonies infecting periwinkles Littorina littorea across the 27 days of experimentation (single and double infections combined; only data from colonies actually releasing cercariae when challenged are included, i.e. n cercariae > 0). Hosts were offered ad libitum food (Ulva lactuca) during the first 13 days followed by starvation (no algae present) for the remaining experimental period. Trend line based on the 10 mean values (n = 126–170 mean−1): Y = −0·056X + 2·52; r 2 = 0·906, P < 0·0005.

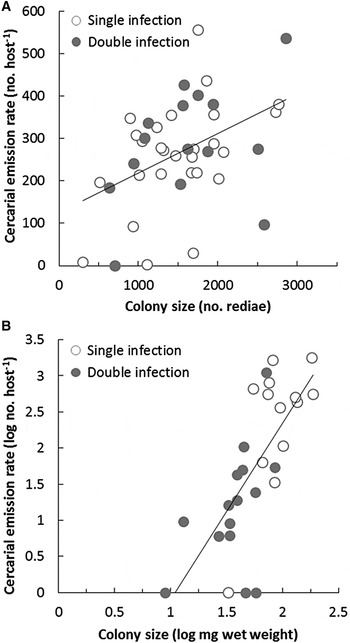
Irrespective of infection type, colony fitness was an expected positive function of colony size (Fig. 3A). However, the residual variation was large and colony size only accounted for 19% of the variance in cercarial emission rate.
Cercarial emission rates of (A) Himasthla elongata (mean no. host−1 4-h−1) as a function of colony size (no. rediae) and (B) Renicola roscovita (log mean no. host−1 4-h−1) as a function of colony size (log mg sporocyst wet weight) for single-infected (Renicola or Himasthla) and double-infected (Renicola and Himasthla together) periwinkles Littorina littorea offered ad libitum food only (days 1–13, five shedding trials). Sample sizes (A): n single = 27, n double = 15. Sample size (B): n single = 13, n double = 15. Trend lines are based on single and double infections combined: (A) Y = 0·093X + 125·2, r 2 = 0·196, P = 0·003; (B) Y = 2·448X–2·554; r 2 = 0·516, P < 0·0005.

Structure of Himasthla colonies
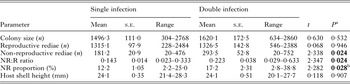
Although Himasthla colonies were unaffected by competition from Renicola in terms of cercarial production, the structure of the parthenitae colony differed considerably between single- and double-infected hosts. Whereas the mean number of reproductive rediae was similar, non-reproductive occurred in significantly higher numbers (62%) in double-infected than in single-infected snails, resulting in a correspondingly higher ratio between non-reproductive and reproductive rediae (NR:R ratio) in double-infected snails (Table 3). On average, the small non-reproductive rediae accounted for c. 12 and 17% of the redial colonies in single- and double-infected hosts, respectively. Despite the presence of more non-reproductive rediae in double infections, the expected greater colony size in these hosts was statistically insignificant (Table 3). Because the shell height distribution of single- and double-infected snails was close to identical (Table 3), the above patterns in colony structure are not influenced by host size as a potentially interacting factor.
Colony parameters of Himastla elongata parthenitae infecting periwinkles Littorina littorea alone (single infection, n = 27) and in competition with Renicola roscovita (double infection, n = 15)

Host sizes are also given. The NR:R ratio denotes the ratio between the number of small non-reproductive rediae (NR) and the number of the much larger reproductive rediae (R). Statistically significant differences are highlighted in bold.
a Student's t-test contrasting mean values (d.f. = 40).
b On arcsine-transformed data.
Himasthla fitness vs colony structure in double infections
Regardless experimental food treatment, there was no significant linear or non-linear relationship between Himasthla colony fitness and Renicola colony size (r and r s ⩽ 0·273, P ⩾ 0·325, n = 15). Moreover, Renicola colony colour had no influence on Himasthla colony fitness as no significant difference in mean fitness could be demonstrated between hosts coinfected by orange coloured (n = 7) and less coloured (n = 8) Renicola colonies (Student's t-test, t 13 ⩽ 0·419, P ⩾ 0·682).
In philophthalmids engaged in double infections, high proportions of non-reproductive rediae appear to promote colony fitness (Kamiya and Poulin, Reference Kamiya and Poulin2013). This, however, could not be demonstrated in the present system as no statistically significant linear or non-linear relationships exist between Himasthla colony fitness and the NR:R ratio (r and r s ⩽ 0·096, P ⩾ 0·437, n = 15).
Fitness of Renicola colonies
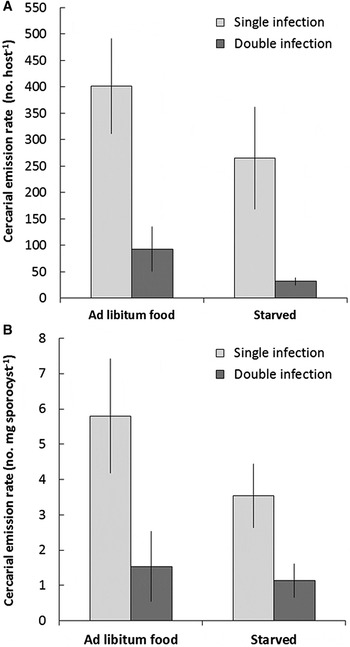
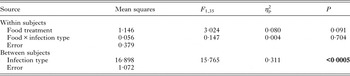
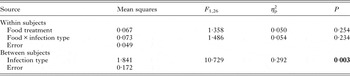
As opposed to H. elongata, colonies of R. roscovita were severely affected by coinfection. Average cercarial emission rates were 4–6-fold higher in single-infected than in double-infected snails, whether or not emission data were corrected for colony size and whether or not host snails were well fed (Fig. 4, Tables 4 and 5; see Supplementary material for data on individual shedding trials). No interaction between food treatment and infection type was evident, and in total c. 30% of the variation in emission rates was explained by infection type. Emissions also tended to be lower when host snails were food deprived, which might reflect an overall decreasing temporal trend independent of experimental food treatment as seen also for H. elongata (Fig. 2). Contrary to Himasthla, however, food treatment (or time) had no statistically significant impact on the emission of Renicola cercariae, explaining only 5–8% of the variation (Tables 4 and 5). This lack of significance may in part follow from the limited sample size and large variation in emission rates (type II error; see Fig. 4 and Supplementary material).
Cercarial emission rates (mean of mean no. 4-h−1 ± s.e.) of Renicola roscovita per colony (i.e. host individual) (A) and per mg wet weight of sporocyst colony (B) for single-infected (Renicola only) and double-infected (Renicola and Himasthla elongata together) periwinkles Littorina littorea offered ad libitum access to sea lettuce Ulva lactuca (days 1–13) and starved (no algae present, days 13–27). Sample sizes (A): n single, feed = 25, n single, starved = 22, n double, feed = 26, n double, starved = 22. Sample sizes (B): n single = 13, n double = 15.

Summary statistics of reduced model GLM with repeated measures including cercarial emission rate by Renicola roscovita colonies (no. 4-h−1 host snail−1, log-transformed data) as dependent variable, food treatment (repeated measure: ad libitum food followed by starvation) and infection type (single infection or coinfection with Himasthla elongata) as independent fixed factors

η p 2 denotes squared partial eta, i.e. proportion of variance explained. Statistically significant differences are highlighted in bold. Note that sample sizes are reduced in this GLM relative to Fig. 3A due to the repeated measure approach requiring valid data from both food treatments (i.e. only data from snails surviving at least through day 19 are included).
Summary statistics of reduced model GLM with repeated measures including cercarial emission rate by Renicola roscovita corrected for colony size (no. 4-h−1 mg sporocysts−1, log-transformed data) as dependent variable, food treatment (repeated measure: ad libitum food followed by starvation) and infection type (single infection or coinfection with Himasthla elongata) as independent fixed factors (see Fig. 3B for raw data)

η p 2 denotes squared partial eta, i.e. proportion of variance explained. Statistically significant differences are highlighted in bold.
Mean shell height was largely similar between single- and double-infected hosts included in the above GLM on cercarial emissions uncorrected (respectively, 22·9 ± 0·34 and 23·8 ± 0·55; Student's t-test, t 35 = 1·328, P = 0·193) and corrected for colony size (respectively, 22·9 ± 0·47 and 24·1 ± 0·51 mm; Student's t-test, t 26 = 1·651, P = 0·111). Furthermore, preceding full GLMs, including also host shell height as a covariate, demonstrated no significant host size effect on cercarial release nor any significant host size interactions (uncorrected for colony size: F 1,34 ⩽ 2·508, P ⩾ 0·123; corrected for colony size: F 1,25 ⩽ 1·601, P ⩾ 0·217), and host size was therefore ignored in the proceeding reduced GLMs (Tables 4 and 5).
Renicolid colony size had a clear positive influence on cercarial emission (Fig. 3B). Interestingly, the relationship appears similar in presences as well as in absence of a competing Himasthla colony, emphasizing the importance of colony size per se irrespective infection type. However, the double-logarithm linearity (that produced the best fit) also points at an underlying power function, which in turn suggests that cercarial emission rates are not solely a matter of colony size. A more advanced state of maturity of the larger and mainly single-infecting colonies may also be influential and/or predation on cercariae before they escape from hosts coinfected by Himasthla (see Discussion).
Size and colour of Renicola colonies
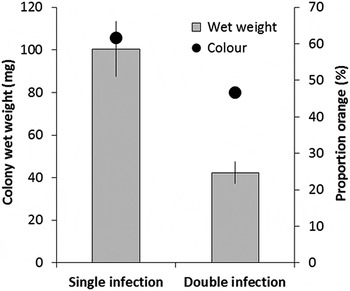
Renicola roscovita colonies had on average a more than 2-fold greater wet weight in single-infected than in double-infected hosts (Fig. 5, Student's t-test on log-transformed data, t 26 = 4·341, P < 0·0005), suggesting that growth and development of the renicolid sporocyst mass is stunted significantly by presence of coinfecting Himasthla parasites. This collaborates well with a tendency of single-infecting Renicola colonies being more orange coloured, and hence more mature, than those harboured by double-infected hosts (Fig. 5). However, sample sizes were too limited for obtaining statistical significance on this colour variation (Fisher's exact test, P = 0·476).
Colony size (mean mg wet weight ± s.e.) and colour (proportion orange) of Renicola roscovita from single-infected (Renicola only, n = 13) and double-infected (coinfected by Himasthla elongata, n = 15) periwinkles Littorina littorea.

In terms of wet weight, the renicolid sporocyst colonies occupied averagely 6·9 and 14·9% of the soft tissue of double- and single-infected hosts, respectively.
DISCUSSION
Colony success
Present results demonstrate clear species-specific fitness responses to interspecific competition and host nutritional state (Figs 1 and 4). Regardless host food regime, the fitness of H. elongata colonies was in terms of released cercariae unaffected by presence of a coinfecting R. roscovita colony. The latter, on the other hand, released severalfold more cercariae when infecting the periwinkle host alone than co-occurring with Himasthla. Opposite, and irrespective of competition level, the fitness of Himasthla colonies were negatively influenced by deteriorating nutritional state of the host, whereas Renicola colonies appeared less affected. The steady decrease in emission of Himasthla cercariae with time (Fig. 2) is likely a consequence of the also declining host condition with time (see Results and below). However, the lack of an experimental food control (see Materials and Methods) opens for the influence of also other processes. For instance, cercarial regeneration takes time and the sequence of experimental shedding trials may increasingly have emptied particularly the Himasthla colonies for mature cercariae.
The observed species-specific responses can be interpreted in light of the two trematodes different life histories. The redial Himasthla colony is within certain limits capable of continuous self-reproduction and cercarial production, making the colony self-sustained and long-lived (probably equal to host longevity, i.e. several years) (Galaktionov and Dobrovolskij, Reference Galaktionov and Dobrovolskij2003; Galaktionov et al. Reference Galaktionov, Podvyaznaya, Kirill and Levakin2015). The cercariae develop unsynchronized within the redial body and are released singly into the host haemolymph as they mature. In contrast, the sporocysts of the entire Renicola colony are produced by the founder mother sporocyst from one or two reproductive bursts. The sporocysts are unable to self-reproduce or launch renewed cercarial production once the initially formed small but numerous cercariae have matured and emerged (Wright, Reference Wright1956; Galaktionov and Dobrovolskij, Reference Galaktionov and Dobrovolskij2003; Galaktionov et al. Reference Galaktionov, Podvyaznaya, Kirill and Levakin2015). Hence, Himasthla may in the intramolluscan stage be viewed as an ‘iteroparous’ species, whereas Renicola appears to express a more ‘semelparous’ strategy. Hence, the rate by which Himasthla cercariae emerge is likely determined by the immediate nutritional state of the host, resulting in a tight link between host food intake and cercarial emission, because new rediae and cercariae are continuously under development. The shedding rate from mature Renicola colonies, on the other hand, will be determined by the energy pool that had been available during the maturation process prior to cercarial emissions rather than the immediate host condition. All sporocyst and cercariae have already been formed and new ones are not under development.
This scenario collaborates well with the strongly depressed emission of Renicola cercariae from host snails also infected by H. elongata. Because the longevity of Renicola infections may be considerably shorter than those of Himasthla (apparently less than a year after maturity, see Galaktionov et al. Reference Galaktionov, Podvyaznaya, Kirill and Levakin2015), chances are that a Renicola colony found in double-infected hosts has competed with Himasthla over host resources for its entire lifetime. This may have stunted development significantly. Indeed, Renicola colonies from double-infected hosts were considerably smaller by weight, and less often held the orange colouration indicative of full maturity, than those from single-infected hosts (Fig. 5).
Whereas Renicola fitness is negatively affected by interspecific competition, the relationship is not reciprocal: the fitness of Himasthla colonies is puzzling unaffected by the presence of a coinfecting Renicola colony regardless the host's nutritional state (Fig. 1). As for Renicola infections, where the fitness seemed largely independent of immediate host condition, it is possible that the cercarial emission rate of Himasthla is unaffected by the coinfecting Renicola colony because the latter is approaching full maturity at the point of shedding trials. This might reduce the strength of the renicolid exploitative competition pressure on Himasthla. This interpretation predicts that the energy demand and hence the competitive impact on a co-occurring Himasthla infection will be greater in the presence of developing Renicola colonies than in the presence of fully mature ones. This is not the case as Himasthla colony fitness was entirely unrelated to Renicola colony size and colour indicative of colony maturity. Moreover, neither total colony size of Himasthla nor the number of reproductive rediae in the colony differed between single- and double-infected hosts (Table 3). This would be expected if a coinfecting Renicola colony indeed imposes a significant competition pressure on Himasthla during the formers earlier development.
What then explains Himasthla’s resilience to Renicola competition? Perhaps Himasthla is more effective than Renicola in extracting the necessary resources from the host (superior competitor hypothesis). Whereas the Renicola colony is a spatially limited and densely packed sphere of sporocysts, probably making transfer of nutrients into the central parts of the colony challenging (see Clausen et al. Reference Clausen, Larsen, Iversen and Mouritsen2008), the well-separated Himasthla rediae are widely dispersed throughout the body of the host (Hechinger et al. Reference Hechinger, Wood and Kuris2011; Nielsen et al. Reference Nielsen, Johansen and Mouritsen2014). This may facilitate nutritional uptake over the redial body wall wherever these parasite larvae reside in the host. Moreover, Himasthla rediae have, as opposed to Renicola sporocysts, a complete digestive system allowing direct ingestion of host tissue. This can be an effective alternative feeding strategy meeting necessary nutritional requirements if nutrient levels in the host's haemolymph drop due to the presence of an exploitative competitor. Along similar lines, Poulin and coworkers studying the comparable Philophthalmus–Zeacumantus association suggested that one function of the non-reproductive Philophthalmus rediae besides colony defence could be intracolonial nutrient transfer (Kamiya and Poulin, Reference Kamiya and Poulin2012; Lloyd and Poulin, Reference Lloyd and Poulin2012, Reference Lloyd and Poulin2014). The small size and high mobility of the non-reproductive rediae allow them to reach and return nutrients from narrow or distantly located host tissues otherwise unreachable by the much larger and sluggish reproductive rediae. How such nutrient transfer might be realized in practice remains unanswered though.
Because Himasthla rediae readily seize and consume Renicola sporocyst in vitro (Mouritsen and Halvorsen, Reference Mouritsen and Halvorsen2015), it is also plausible that Himasthla colonies involved in heterospecific double infections benefit directly from the presence of the competitor as an additional food source (predatory compensation hypothesis). Although most Himasthla rediae are spatially separated from the Renicola sporocyst mass, Renicola cercariae released from sporocysts in order to find their way out of the host will be easy targets for the highly dispersed Himasthla parthenitae. Such predation could return significant amounts of energy to the Himasthla colony for sustained cercarial production without further debilitation of the host. In fact, such predatory activity may be an additional and direct factor decreasing the cercarial output of Renicola colonies in double infections (Fig. 4). Similar predatory compensation of competition losses has been recorded in the echinostomid Paryphostomum segregatum infecting the freshwater snail Biomphalaria glabrata. Here, predation on sporocyst parthenitae of coinfecting cathaemasiid Ribeiroia marini results in larger Paryphostomum rediae than those found in hosts infected solely by Paryphostomum (Basch et al. Reference Basch, Joe and Heyneman1970).
The above two offered explanations – the superior competitor and the predatory compensation hypothesis – are not mutually exclusive and we expect both to operate simultaneously. However, it should be noted that the studied infections were naturally established. Thus, uncontrolled host-specific factors may in principle have affected the host–parasite interactions in single- and double-infected host differently. For instance, double-infected hosts may be particularly weakened individuals with little ability to support the growth of the latest invading parasite (likely Renicola). This might create differences in the performance of coexisting parasites without direct competitive interactions. However, this particular scenario is not supported by the similar mortality rates among single- and double-infected snails, neither by the lack of impact of double infections on the colony fitness of Himastha.
The observed fitness responses of Himasthla and Renicola are partly in agreement with results obtained in the comparable system where Philophthalmus sp. (redial colony) and the microphallid Maritrema novaezealandensis (sporocyst colony) coinfect the mud snail Zeacumantus subcarinatus. Regarding host nutritional state, Lloyd and Poulin (Reference Lloyd and Poulin2013) found reduced cercarial emission from both parasite species when host snails were unfed, which together with our results indicate that intramolluscan trematode colonies generally reduce the exploitation of hosts under stress. This may be viewed as a parasite adaptation keeping the host alive (the bet hedging hypothesis; see Karvonen et al. Reference Karvonen, Kirsi, Hudson and Valtonen2004; Jokela et al. Reference Jokela, Taskinen, Mutikainen and Kopp2005). Regarding competition, both Philophthalmus and Maritrema produce fewer transmission stages in double than in single infections (Lloyd and Poulin, Reference Lloyd and Poulin2012). In another study, however, the colony success of Philophthalmus was found unaffected by the presence of the microphallid competitor (Kamiya and Poulin, Reference Kamiya and Poulin2013). In the same host–parasite system, Keeney et al. (Reference Keeney, Boessenkool, King, Leung and Poulin2008) also found the infrapopulation of Maritrema to be negatively affected by Philophthalmus, whereas the opposite was not the case. Comparable results have been obtained also in other host–parasite systems. DeCoursey and Vernberg (Reference DeCoursey, Vernberg and Vernberg1974) studying Himasthla–Austrobilharzia interactions in the snail Nassarius obsoletus (=Ilyanassa obsoleta) found that contrary to Austrobilharzia sporocysts, the fitness of the redial Himasthla quissetensis colony was unaffected by coinfection. Regarding infrapopulation size, Hendrickson and Curtis (Reference Hendrickson and Curtis2002) found the colony size of H. quissetensis unaffected by coinfecting sporocyst parthenitae (Zoogonus rubellus), whereas the latter was reduced in numbers.
Together, present results and the above lines of evidence emphasize that intramolluscan redia–sporocyst competition is inherently asymmetrical, affecting sporocyst species to a greater extent than redial species. Interestingly, this resilience to competition by redial colonies seems partly linked to the occurrence of non-reproductive rediae (see below).
Himasthla colony structure under competition
Although the cercarial emission rate of the H. elongata colonies was unaffected by competition from Renicola, the structure of the redial colonies differed between infection types: the total number as well as the relative proportion of non-reproductive rediae in the colony was markedly higher in double infections (Table 3). Three not mutually exclusive possibilities may explain this pattern: non-reproductive rediae are produced in higher numbers in double infections in order to (1) eliminate the competitor (defence), (2) increase the pool of reproductive rediae and thus colony fitness (recruitment), and (3) exploit the additional food source made available by the presence of the competitor as well as eliminating the greater pool of dead and dying cercariae (predation/cleaning).
The first possibility (defence) requires that Renicola represents a threat to Himasthla. In terms of colony fitness, Renicola appears of limited importance to Himasthla. However, the life span of the Renicola infection is according to Galaktionov et al. (Reference Galaktionov, Podvyaznaya, Kirill and Levakin2015) considerably smaller than that of Himasthla, and when the Renicola sporocysts are emptied for cercariae the snail host is likely to perish soon after (Galaktionov et al. Reference Galaktionov, Podvyaznaya, Kirill and Levakin2015). Present data do not suggest different host mortality rates between infection types during the 1 month of experimentation. However, this time frame did not allow for an evaluation of mortality after the Renicola colonies were spent. So, if Galaktionov and coworkers are correct, the presence of Renicola represents an elevated risk of imminent host death, jeopardizing also the survival of the co-occurring Himasthla infection. Hence, Himasthla may respond to this threat by producing more non-reproductive (juvenile) rediae that evidently are better defenders than reproductive rediae (Mouritsen and Halvorsen, Reference Mouritsen and Halvorsen2015).
The second possibility (recruitment) may be relevant for similar reasons as defence. In light of the apparent high pathogenicity of Renicola infections that might result in early host death, Himasthla may produce more juvenile rediae with the purpose of boosting the pool of reproductive rediae in the colony. This will increase cercarial emission before it is too late, thereby compensating in part for lost future reproduction.
The third possibility (predation/cleaning) is relevant because the renicolid competitor represents a food source that can be exploited without further weakening of the host. The small and highly mobile non-reproductive rediae will be particularly suitable for targeting Renicola cercariae moving through the host tissue in their quest to emerge. An additional functional role of the non-reproductive rediae may be to consume dying and dead rediae as well as cercariae that did not emerge successfully (Gorbushin and Shaposhnikova, Reference Gorbushin and Shaposhnikova2002; Galaktionov et al. Reference Galaktionov, Podvyaznaya, Kirill and Levakin2015; Mouritsen and Halvorsen, Reference Mouritsen and Halvorsen2015). Such cleaning activity will avoid release of toxic substances and development of secondary microbial infections during larval degradation, in turn promoting host survival. In double-infected snails, Himasthla are faced with the task of cleaning the host not only for own colony members but also heterospecific larvae and may therefore invest in a greater pool of small non-reproductive rediae better suited to reach and clean narrow and distantly located blood vessels and sinuses within the host.
The above three scenarios infer that the additional non-reproductive rediae found in double infections are strategically produced by Himasthla as a direct response to the presence of Renicola in order to meet the arisen competition challenge and/or feeding opportunity. As none of them are mutually exclusive, they may act in concert to select for the same strongly adaptive responds, namely production of more non-reproductive rediae. By doing so, Himasthla harvest all potential fitness benefits simultaneously.
Because the studied infections were all naturally established, the alternative possibility exists that the greater NR:R ratio in double infections is a Renicola response rather than a Himasthla response: for whatever reason, Renicola may more successfully infect snail hosts that harbour Himasthla colonies expressing a high NR:R ratio. However, we dismiss this possibility upon lack of supportive evidence and because we are unable to envisage the underlying mechanism. Whereas evidence suggests that Himasthla infections depress the periwinkle hosts internal defence system (haemocyte function), there are no indications that this relates particularly to the action of the small non-reproductive rediae in the colony (Iakovleva et al. Reference Iakovleva, Shaposhnikova and Gorbushin2006; Gorbushin and Iakovleva, Reference Gorbushin and Iakovleva2008). Moreover, total colony size was similar in single- and double-infected hosts (Table 3), suggesting that the concentration of immuno-depressing secretory products released by the parthenitae may also be similar.
Viewing the clonal Himasthla parthenitae as a social colony with division of labour, here manifested by a temporal caste for defence (non-reproductive juvenile rediae) and a caste for reproduction (cercariae-producing rediae) (Hechinger et al. Reference Hechinger, Wood and Kuris2011; Nielsen et al. Reference Nielsen, Johansen and Mouritsen2014; Mouritsen and Halvorsen, Reference Mouritsen and Halvorsen2015), production of more juveniles in double infections collaborates well with caste allocation theory that predicts increased investment in defenders under an elevated threat regime (Oster and Wilson, Reference Oster and Wilson1978). Such adaptive change in caste ratios has been documented in certain social insects, for instance Pheidole pallidula ants (Passara et al. Reference Passara, Ronchin, Kaufmann and Keller1996).
Even if the idea of socially organized trematode colonies is dismissed in echinostomatids, as advocated by Galaktionov et al. (Reference Galaktionov, Podvyaznaya, Kirill and Levakin2015), it is an intriguing novel observation that a clonal colony of rediae is able to strategically adjust its structure to optimize colony success when challenged by a heterospecific competitor. Similar evidence have been pursued in the parallel philophthalmid/microphallid system with limited success: three separate studies found no impact of intra- or interspecific competition on philophthalmid NR:R ratio (Leung and Poulin, Reference Leung and Poulin2011; Kamiya and Poulin, Reference Kamiya and Poulin2013; Lloyd and Poulin, Reference Lloyd and Poulin2014), whereas a fourth investigation showed elevated NR:R ratio in double-infected compared with single-infected snails; but solely when hosts were experimentally offered excess food (Lloyd and Poulin, Reference Lloyd and Poulin2013).
SUPPLEMENTARY MATERIAL
The supplementary material for this article can be found at https://doi.org/10.1017/S003118201700107X.
ACKNOWLEDGEMENTS
We wish to thank Victoria Beasley for her kind assistance during the laboratory work. We are also in dept to two anonymous reviewers for improving the paper.
FINANCIAL SUPPORT
This research received no specific grant from any funding agency, commercial or not-for-profit sectors.