


1. Introduction
The deployment of sensing technologies has changed both the everyday life of human beings and the manner in which data can be acquired across a wide range of scientific and practical domains. Sensors are devices that detect changes in the health and performance of human beings, smart machines, buildings and cities, manufacturing, daily life, and the measurement of the environment and climate. In healthcare, there has been considerable research in the usage of sensors, with a detailed survey in Antunes et al. (Reference Antunes, Seewald, Rodrigues, Costa, Righi, Maier, Eskofier, Ollenschläger, Naderi, Fahrig, Bauer, Klein and Campanatti2018); many examples can be found on the usage of sensors to drive performance in sport with recent examples of the adoption of machine learning (De Beéck et al., Reference De Beéck, Meert, Schütte, Vanwanseele and Davis2018); smart cities (Santana et al., Reference Santana, Chaves, Gerosa, Kon and Milojicic2018); and in climate, the capture of micrometeorological data using a range of ongoing sensors has been in place for a considerable number of years (World Meteorological Organization, 2021b). A more general recent overview can be found in Javaid et al. (Reference Javaid, Haleem, Rab, Singh and Suman2021).
In this research, we focus on the generation and acquisition of climate data and on accelerating its usage by adopting FAIR principles. The current state of weather-induced agricultural losses, water use for irrigation, the appearance of new invasive species and disease vectors (strongly depending on micrometeorological conditions), new environmental zoning of plant diseases and pests, deforestation, increased urbanization, rural-to-urban migration, and increased urban energy consumption for cooling and heating impose scientific and societal demands for FAIR micrometeorological data.
Recent research (Hsieh, Reference Hsieh2022) predicting a significant rise in the acceptance and application of machine learning in environmental science does not address the important issue of available data in data-driven analytics. It is an important motivation for climate-based research to have access to as much interpretable data as possible and in that light, we now highlight the meaning of FAIR: Findability, Accessibility, Interoperability, and Reusability. This means that data and metadata should: be easily discoverable by humans or machines; accessible under specific conditions or restrictions; conform to recognized formats and standards to be combined and exchanged; and be licensed according to community norms allowing users to know what kinds of reuse are permitted. While open data is the ultimate goal, it is important to have in mind that the FAIR concept implies open metadata only. Measurement results should be stored in a repository chosen by the data owner, using a DOI as a persistent unique identifier and a preferred license, from closed to fully open with numerous options.
There is a distinct difference between open and FAIR data, related to the degree of accessibility and requirements for usability (Mons et al., Reference Mons, Neylon, Velterop, Dumontier, Bonino and Wilkinson2017). Open data is available without restriction, while FAIR data may have specific conditions for access and usage. Open Government Data refers to the information collected, produced or paid for by the public bodies and made freely available for reuse for any purpose (European Union, 2023), with a license specifying the terms of use. These principles for Open Data are described in detail in the Open Definition (Open Knowledge Foundation, 2015). Public sector information is information held by the public sector. The Directive on the re-use of public sector information provides a common legal framework for a European market for government-held data. It is built around the key pillars of the internal market: free flow of data, transparency, and fair competition. It is important to note that not all of the public sector information is Open Data.
A recent report (PwC EU Services, 2018) on the cost of non-FAIR research estimated that the lack of FAIR data costs approximately €10.2 billion annually, equivalent to 78% of the annual Horizon 2020 budget or 3% of total EU research expenditure. This report, targeted at research funders, data and related infrastructures and research organizations, identified the impact of research activities as most significant but also highlighted its impact on collaboration and innovation. In general, increased time and cost are repeatedly cited as the main negative impacts. This report provides detail on the different cost indicators: time, cost of storage, license costs, research retraction, double funding, interdisciplinarity, and potential economic growth. As the research presented in this paper emerges from EU Cost Action CA20108, an interdisciplinary action with climate researchers from different domains, data engineers, and machine learning researchers, an interesting finding was that the cost of its effect on interdisciplinary research was difficult to estimate. However, findings indicate that reproducibility is hampered if data is not FAIR; lack of access to data and the poor quality of data restrict interdisciplinarity; and the benefit of accessing “disparate data from other disciplines” is lost for these teams. Central to reproducibility is the provision of metadata so that practitioners may obtain greater context from a given dataset. Several standards exist for the provision of FAIR data, such as the Dublin Core Metadata element set (DCMI, 2018) and standards for publishing such data, such as FAIR Data Point (FDP) (da Silva Santos et al., Reference da Silva Santos, Burger, Kaliyaperumal and Wilkinson2023).
This cost to research of non-FAIR data can potentially be exacerbated when dealing with high-value data. For example, in the high-value datasets identified by the EU (EUR-Lex, 2022), the meteorological thematic category includes datasets on observational data measured by weather stations, validated observations (climate data), weather alerts, radar data, and numerical weather prediction (NWP) model data with the granularity and key metadata attributes listed in Table 1.
FAIR metrics and interpretation

Table 1. Long description
The table consists of three columns: I D, Original principal, and Metric interpretation. It is divided into four thematic sections.
Findable section:
* F 1.1: Data assigned globally unique I D; Essential directly or indirectly.
* F 1.2: Metadata assigned globally unique I D; Preferable directly or indirectly.
* F 2: Data are described by rich metadata; Should support different levels.
* F 3: Metadata explicitly includes the unique I D; Should be a metadata attribute.
* F 4.1: Data are searchable; Directly or indirectly.
* F 4.2: Metadata are searchable; Directly or indirectly.
Accessible section:
* A 1.1: Data retrieved using standard protocol; Query Portal or high level language.
* A 1.2: Metadata retrieved using standard protocol; Query Portal or high level language.
* A 2: System is open, free, universally implementable; Should be open and free to read and search.
* A 3: System includes authentication/authorization; Requires authentication for creating metadata.
* A 4: Metadata is accessible past the lifetime of data; Metadata and data are equally valuable.
Interoperable section:
* I 1: Metadata uses a formal, accessible, shared, broad applied knowledge representation language; Accepts X M L, J S O N, C S V, etc.
* I 2: Vocabularies follow F A I R principles; Standard metadata or ontology.
* I 3: Metadata includes qualified refs to other (meta)data; Expose your A P I and metamodel.
* I 4: System supports importing/exporting of metadata; Exportable as X M L, C S V, etc.
Reusable section:
* R 1: Metadata are richly designed with a plurality of accurate and relevant attributes; Facilitate rich metadata descriptions.
* R 2: (Meta)data have a clear data usage license; Articulate usage requirements.
* R 3: (Meta)data associated with detailed provenance; Description of data generation and manipulation.
* R 4: (Meta)data meet domain-relevant community standards; Must meet quality criteria.
1.1. Motivation and contribution
Developing a FAIR repository for climate science data is a multidisciplinary effort involving climate scientists who generate data; data engineers with skills to create federated digital assets; and machine learning researchers who provide expertise on tasks such as gap filling, predictive modelling and exploiting deep learning models for more complex machine learning tasks. One of the main goals of the CA20108 cost action (COST Action, 2021) was to design and build a knowledge portal that is fully compliant with the FAIR principles for scientific data management. In terms of environmental sciences, this is endorsed by the findings in McGovern et al. (Reference McGovern, Ebert-Uphoff, Gagne and Bostrom2022), who highlighted issues related to training data: understanding and interpreting data for use in machine learning experiments is crucial. Recently, the FAIR Micromet Portal (FMP) was developed to capture metadata for FAIR datasets (Roantree et al., Reference Roantree, Lalić, Savić, Milošević and Scriney2023). Its purpose was to provide detailed metadata descriptions for shareable micrometeorological data using the WMO standard (World Meteorological Organization, 2021a). While storing Network, Site, and Sensor metadata locally, the system passes climate datasets to Zenodo, receives back the DOI, and thus creates a permanent link between the FMP and the storage platform Zenodo. In this way, the user exploits the (metadata) search functionality of the FMP to obtain both detailed descriptions and links to data on the Zenodo platform. A comprehensive review of open repositories (Stall et al., Reference Stall, Martone, Chandramouliswaran, Federer, Gautier, Gibson, Hahnel, Larkin, Pfeiffer, Sedora, Sim, Smith, Van Gulick, Walker, Wood, Zaringhalam and Zigoni2023) confirms Zenodo’s suitability for this type of storage but does highlight the limitations of a current 50GB limit on datasets. This limitation is overcome by the FMP as it permits any number of Zenodo uploads for a single network site. Central to FAIRNESS within FMP is the Findability and Accessibility of the provided datasets. Using the metadata provided, users are able to search and filter relevant datasets using the defined minimum metadata required for each dataset on the platform.
There are numerous Environmental Observation (EO) platforms with the purpose of providing accessible data and real-time datasets, and trying to partly or fully contribute to the FAIR concept. Some well-known operable EO platforms with a focus on climate data are Copernicus (CDSE authors, 2023), (European Commission, 2023), (ECMWF Open Data, 2023), (University of Münster, 2023), and (Earth System Grid Federation, 2016). In the micrometeorological domain, established long-term networks such as the International Soil Moisture Network (ISMN), FLUXNET (focused on carbon, water and energy fluxes), and the Integrated Carbon Observation System (ICOS) provide valuable observational data. However, these networks generally operate through long-term institutional or project funding and use relatively standardized hardware, data structures, and metadata. In contrast, the FMP offers flexible metadata and data-quality frameworks to handle the diverse, long-tail micrometeorological data generated by varied monitoring and modeling campaigns. To the best of our knowledge, no existing micrometeorological repository combines the FAIR-oriented functionality and metrics proposed by the FMP. Thus, FMP complements established networks by supporting the publishing, evaluation, and reuse of heterogeneous micrometeorological data.
At present, users can perform searches either directly through a web browser interface or programmatically via dedicated APIs. These APIs support querying across the following fields and have been fully implemented and deployed within the Fairness Portal https://fairmicromet.eu/networks/894abd82-c49c-4b5e-8506-f600362cb4da. This dual-access approach ensures both usability for non-technical users and flexibility for developers who require automated or large-scale data retrieval.
-
• Country
-
• City/region
-
• Local environment
-
• Seasonality (year round, summer only, winter only)
-
• From date for measurements
-
• End date for measurements
Given that research clearly demonstrates that FAIR data has far greater impact than data which is not FAIR, it is therefore of considerable value to the research community if there is an automated or easy-to-use method for ensuring that data is FAIR. In essence, create a system where researchers can simply “file and forget,” confident that their data meet the FAIR principles and contribution more effectively to science. To achieve this, it is first necessary to understand and interpret the FAIR principles to help validate any proposed solution. Reusability and heterogeneity tend to be conflicting, rather than complementary properties. Thus, to enable a “file and forget” scenario, where data are often heterogeneous, reusability must be enabled firstly through standard metadata descriptions and secondly, data must be searchable and findable. In this paper, we begin with an interpretation of the FAIR principles and articulate what is required to meet the threshold for each principle. We then use a case study from an urban micrometeorological network and perform a step through the creation of FAIR metadata through the FMP, first introduced in Roantree et al. (Reference Roantree, Lalić, Savić, Milošević and Scriney2023), as essentially a form of software wizard, a user interface that takes the researcher through a sequence of small steps, in the creation of FAIR metadata. In the remainder of the paper, the term FAIRNESS is used to refer to the FAIRNESS CA20108 Cost Action and FMP refers to the FAIRNESS Micromet Portal, a system devised to deliver micrometeorological data FAIR compliant.
Paper structure. In Section 2, we provide a detailed discussion of the FAIR principles and our interpretation of these principles in order that appropriate metrics can be devised. In Section 3, we describe how the FMP meets FAIR requirements; In Section 4, a discussion is presented; and finally, in Section 5, we draw conclusions.
2. Is my data FAIR?
Since the original FAIR proposal (Wilkinson et al., Reference Wilkinson, Dumontier, Aalbersberg, Appleton, Axton, Baak, Blomberg, Boiten, da Silva Santos, Bourne, Bouwman, Brookes, Clark, Crosas, Dillo, Dumon, Edmunds, Evelo, Finkers, Gonzalez-Beltran, Gray, Groth, Goble, Grethe, Heringa, ’t Hoen, Hooft, Kuhn, Kok, Kok, Lusher, Martone, Mons, Packer, Persson, Rocca-Serra, Roos, van Schaik, Sansone, Schultes, Sengstag, Slater, Strawn, Swertz, Thompson, van der Lei, van Mulligen, Velterop, Waagmeester, Wittenburg, Wolstencroft, Zhao and Mons2016), there have been a number of papers which sought to explore and interpret the different metrics (Berman and Crosas, Reference Berman and Crosas2020); some authors suggested extensions and a tighter interpretation of the thresholds for compliance (Schultes et al., Reference Schultes, Magagna, Hettne, Pergl, Suchánek and Kuhn2020; d’Aquin et al., Reference d’Aquin, Kirstein, Oliveira, Schimmler and Urbanek2023); while there has also been a recommendation of how FAIR systems should be implemented using the concept of a FDP (Benhamed et al., Reference Benhamed, Burger, Kaliyaperumal, da Silva Santos, Suchánek, Slifka and Wilkinson2022). There have been a number of efforts at testing micrometerological data for FAIR compliance, including our own case study (Lalić et al., Reference Lalić, Koci and Roantree2022). What is clear is that some of the metrics and their proposed thresholds are inexact and open to interpretation. Thus, we begin with a discussion on the principles themselves, our interpretation of these, and how metrics can be devised from the principles to determine FAIRness. For simplicity, our discussion refers to a globally unique identifier as a Digital Object Identifier (DOI) but accept any equivalent form of globally unique ID.
2.1. Findable
There are six Findable principles presented at the top of Table 1, as F1 to F4, extended slightly from the original specification (Wilkinson et al., Reference Wilkinson, Dumontier, Aalbersberg, Appleton, Axton, Baak, Blomberg, Boiten, da Silva Santos, Bourne, Bouwman, Brookes, Clark, Crosas, Dillo, Dumon, Edmunds, Evelo, Finkers, Gonzalez-Beltran, Gray, Groth, Goble, Grethe, Heringa, ’t Hoen, Hooft, Kuhn, Kok, Kok, Lusher, Martone, Mons, Packer, Persson, Rocca-Serra, Roos, van Schaik, Sansone, Schultes, Sengstag, Slater, Strawn, Swertz, Thompson, van der Lei, van Mulligen, Velterop, Waagmeester, Wittenburg, Wolstencroft, Zhao and Mons2016). We adjusted F1 to clearly articulate 2 distinct requirements: F1.1 requires that data has a DOI; F1.2 requires that metadata has a DOI. Our interpretation is that F1.1 is mandatory while F1.2 requires a DOI in our interpretation. Our added stipulation to F2 (rich metadata description) is that different levels should be supported: (at least) a minimum level of metadata descriptions and advanced level(s) to support more sophisticated descriptions. Our interpretation for F3 is that the metadata should contain an attribute to capture the DOI. For F4, we again treat the two requirements separately: F4.1 and F4.2 advocate that data and metadata respectively are searchable. This may be facilitated directly through the system or indirectly using a separate (FAIR) system.
2.2. Accessible
Table 1 contains five Accessible principles extended slightly from the original specification, where A1 is now articulated as A1.1 and A1.2, where we again distinguish between access to data and metadata. Our interpretation is that this requires either a high-level query portal or a standard protocol such as a RESTful API publishing data in standard formats (XML, JSON, etc.). For A2, the term “universally implementable” is ambiguous, so we interpret that to mean “easy to use” and assume A2 to require the system to be free to read and search. For A3, we assume that authentication/authorization is required for the creation of FAIR data (otherwise it contradicts A2), but searching should require no such access to open and free data (A2). Our interpretation of A4 is that it is delivered through F1.2, which delivers an independent permanent DOI for metadata, and we interpret this principle as meaning: metadata and data are equally valuable.
2.3. Interoperable
Data interoperability is an important concept to understand as it is fundamental to the process of data integration. Its strategies are well understood now (Batini et al., Reference Batini, Lenzerini and Navathe1986) and in more recent times, methods have been devised to integrate data from both structured and semi-structured data (Scriney et al., Reference Scriney, McCarthy, McCarren, Cappellari and Roantree2019), a crucial feature as not all micrometerological data will have a single fixed structure. In Table 1, the three original Interoperable principles are extended here with a fourth principle (I4) to further enhance interoperability. In the original specification (Wilkinson et al., Reference Wilkinson, Dumontier, Aalbersberg, Appleton, Axton, Baak, Blomberg, Boiten, da Silva Santos, Bourne, Bouwman, Brookes, Clark, Crosas, Dillo, Dumon, Edmunds, Evelo, Finkers, Gonzalez-Beltran, Gray, Groth, Goble, Grethe, Heringa, ’t Hoen, Hooft, Kuhn, Kok, Kok, Lusher, Martone, Mons, Packer, Persson, Rocca-Serra, Roos, van Schaik, Sansone, Schultes, Sengstag, Slater, Strawn, Swertz, Thompson, van der Lei, van Mulligen, Velterop, Waagmeester, Wittenburg, Wolstencroft, Zhao and Mons2016), I1 required that both data and metadata adopt the same formal representation. However, here, we restrict that formality to the metadata, as one cannot make assumptions about the data, which often requires a form of data wrapper to deliver that level of formalization. Our interpretation is that metadata should be available in one of a small number of very popular standards, e.g., XML, JSON, or CSV. I2 states a requirement for a common vocabulary which we interpret as the adoption of a standard metamodel or ontology, such as (World Meteorological Organization, 2021b). Considerable detail is required when integrating data from unrelated, heterogeneous sources. In climate science, there are recent examples of single-use bespoke solutions (e.g., Brambilla et al., Reference Brambilla, Conforti, Simeone, Carrara, Lanucara and De Falco2019), but integration generally requires a (meta)data model to describe data, and in the FMP, the WMO guide provides the design and structure for metadata. I3 highlights an important feature of interoperability: the ability for two heterogeneous metamodels (or ontologies) to communicate, which we interpret as exposing or publishing details of each FDP (also highlighted in Benhamed et al. (Reference Benhamed, Burger, Kaliyaperumal, da Silva Santos, Suchánek, Slifka and Wilkinson2022)). We have added I4 as we believe that exporting metadata is a crucial feature in supporting I3, as we are in agreement with the FAIR analysis provided in d’Aquin et al. (Reference d’Aquin, Kirstein, Oliveira, Schimmler and Urbanek2023) and Peters-von Gehlen (Gehlen, Reference Gehlen2022).
2.4. Reusable
The four Reusable principles are broadly in line with the original specification, with some minor articulations. For R1, we restrict the rich description to metadata (and do not concern ourselves with data). For R2 and R3, we assume that usage requirements and a record of data creation and manipulation (for example, gap filling) are recorded. For R4, we assume a guarantee of minimum criteria (for example, key metadata attributes cannot be left blank).
2.5. Summary
In previous work presented in Lalić et al. (Reference Lalić, Koci and Roantree2022), a case study detailed the application of a FAIR test for micrometerological data using metrics very similar to those presented in Table 1. Conducted before the development of the FMP, it identified the Interoperability metric as the most difficult metric on which to achieve full conformance. Using a validation method of Yes, No, Partial for each test: Findable metrics scored 2 Yes and 2 Partial responses; Accessible metrics scored 2 Yes and 2 Partial responses; Interoperable metrics scored one Yes and 3 Partial responses; and Reusable metrics scored 2 Yes and 2 Partial responses. Thus, it is important to distinguish between data that has full FAIR compliance, partial FAIR compliance, and is not FAIR compliant. The outcome from this test was that full FAIR compliance is quite difficult to achieve, although partial (and potentially high levels of) FAIR compliance are quite achievable.
3. The FAIR micromet portal
In this section, we describe important features captured in the development of the FMP. In particular, we observed many of the insights into how FAIR principles are interpreted (Jacobsen et al., Reference Jacobsen, de Miranda Azevedo, Juty, Batista, Coles, Cornet, Courtot, Crosas, Dumontier, Evelo, Goble, Guizzardi, Hansen, Hasnain, Hettne, Heringa, Hooft, Imming, Jeffery, Kaliyaperumal, Kersloot, Kirkpatrick, Kuhn, Labastida, Magagna, McQuilton, Meyers, Montesanti, van Reisen, Rocca-Serra, Pergl, Sansone, da Silva Santos, Schneider, Strawn, Thompson, Waagmeester, Weigel, Wilkinson, Willighagen, Wittenburg, Roos, Mons and Schultes2020) in terms of a physical deployment such as the FMP. We begin with the capture of metadata for the micrometerological data stored and accessible through the FMP. The procedure for uploading data, described in Roantree et al. (Reference Roantree, Lalić, Savić, Milošević and Scriney2023) is that metadata is recorded in the FMP while the actual data is transferred immediately to Zenodo, creating the DOI that is subsequently captured in the FMP, as seen in the top right of Figure 1. The micrometerological data used in the earlier FAIR assessment provides a good case study for validating how the FMP conforms to FAIR principles while also ensuring that data meets and complies with the more difficult metrics. Data were generated as part of the Novi Sad Urban Network (NSUNET) system, where each site was equipped with multiple sensors and a variety of electronic and hardware devices (Milošević et al., Reference Milošević, Savić, Kresoja, Lužanin, Šećerov, Arsenović, Dunjić and Matzarakis2022). The project’s objective was to provide conditions for progressive urban climate research, for example, contributing to the thermal pattern differences of various urban surroundings. Metadata captured at the Network level is shown in Figure 1 and Figure 2.
Network metadata. © OpenStreetMap contributors 2017. Distributed under the Open Data Commons Open Database License (ODbL) v1.0.

Figure 1. Long description
The interface is divided into a metadata section and a map.
Top Navigation: A breadcrumb trail reads All Networks forward slash Novi Sad Urban Network - N S U N E T.
Metadata Tables:
Left Column:
- Institution: University of Novi Sad, Faculty of Sciences.
- Project: Novi Sad Urban Network.
- Network Code: N S U N E T.
- Contact email: stevan dot savic at d g t dot u n s dot a c dot r s.
- Country: Serbia.
- City forward slash Region: Novi Sad.
- Local Environment: U R B A N.
- Seasonality: YEAR ROUND.
Center Column:
- Start Date: Jan. 1, 2016.
- End Date: Dec. 31, 2017.
- Reference: Blank.
- Date Created: Nov. 8, 2022, 10:05 a.m.
- Last Modified: March 28, 2023, 6:27 p.m.
Right Column (Datasets):
- Created: April 27, 2023, 2:41 p.m.
- D O I: 10 dot 5281 forward slash zenodo dot 7738094.
Bottom Section:
A geographical map of Novi Sad, Serbia, powered by OpenStreetMap. Blue teardrop-shaped pins indicate sensor locations distributed across the urban area on both sides of the Danube River. A zoom control with plus and minus buttons is located in the top-left corner of the map.
Network metadata (sites).

Figure 2. Long description
The table contains seven columns: Name, Latitude, Longitude, Altitude (M), Time Zone, Macroscale Environment, and a View button.
* Row 1: s 2-3, 45.261388, 19.848888, 78.00000, U T C, Residential Area (Multi-Story Buildings).
* Row 2: s 3-2, 45.233333, 19.809722, 79.00000, U T C, Residential Area (Houses).
* Row 3: s 5-2, 45.25, 19.816111, 75.00000, U T C, Boulevard.
* Row 4: s 5-3, 45.2625, 19.826388, 78.00000, U T C, Residential Area (Multi-Story Buildings).
* Row 5: s 5-4, 45.238055, 19.832777, 81.00000, U T C, Residential Area (Multi-Story Buildings).
* Row 6: s 5-5, 45.253055, 19.8475, 80.00000, U T C, Residential Area (Multi-Story Buildings).
* Row 7: s 5-6, 45.2425, 19.847222, 78.00000, U T C, Residential Area (Multi-Story Buildings).
* Row 8: s 6-4, 45.233611, 19.791944, 76.00000, U T C, Residential Area (Houses).
* Row 9: s 6-8, 45.251388, 19.875555, 76.00000, U T C, Residential Area (Houses).
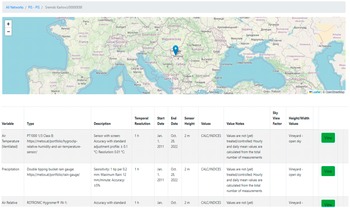
The Network is regarded as the highest level of abstraction and thus requires a relatively short metadata record. Figure 1 shows the capture of institution, project, network code, contact email, county, city/region, local environment, seasonality, start date, end date, and reference. These maps are generated by the FMP using two software libraries: the Leaflet library is free to use through the BSD-2-Clause license (LeafletJS, 2023), and OpenStreetMap is open data, provided through the Open Data Commons Open Database License (OpenStreetMap Contributors, 2017). The system creates the attributes: Date Created and Last Modified, and DOI creation dates. The Site is also at a high level of abstraction, requiring a relatively short metadata record. Figure 3 shows the capture of name, latitude, longitude, altitude, time zone, and macroscale environment. The Sensor requires the most descriptive metadata as it contains many parameters and settings and comes with a wide variety of functions, all of which require a description. Figure 4 shows the capture of variable, type, description, temporal resolution, start date, end date, sensor height, values, value notes, sky view factor, height/width values. For both Site and Sensor metadata, the system creates attributes for Date Created and Date Modified.
Site metadata. © OpenStreetMap contributors 2017. Distributed under the Open Data Commons Open Database License (ODbL) v1.0.

Figure 3. Long description
The top panel is a street map from OpenStreetMap showing a section of Novi Sad, Serbia. A blue location pin is placed at the intersection of Marka Miljanova and a smaller street. The map includes Cyrillic and Latin street names such as Milana Rakica and Kosovska. A zoom control is in the top-left corner.
The bottom panel is a table with eleven columns detailing site metadata for the N S U N E T station s 2-3.
- Variable: Air Temperature (Ventilated).
- Type: ChipCap 2 sensor by General Electric Measurement and Control Company, housed in a 200 by 240 millimeter radiation screen with plus or minus 0.3 degrees Celsius accuracy.
- Description: Measures every minute, sends data every 10 minutes to the University of Novi Sad server. 1-hour datasets were extracted for 2016-2017.
- Temporal Resolution: 1 h.
- Start Date: January 1, 2016.
- End Date: December 31, 2017.
- Sensor Height: 4.1 meters.
- Values: MEASURED/RAW.
- Value Notes: Dataset is Q C with 0 outliers and 0 percent missing data. Includes a Google Drive link for Q C procedures.
- Sky View Factor: Blank.
- Height/Width Values: Describes the site as a small square 41 meters with 50 meters surrounded by multi-story residential buildings.
- A green View button is at the far right.
Sensor metadata. © OpenStreetMap contributors 2017. Distributed under the Open Data Commons Open Database License (ODbL) v1.0.

Figure 4. Long description
The top panel is a geographical map of Europe. A blue location pin is placed in the Southeast, specifically in the Vojvodina region of Serbia, near Sremski Karlovci.
Below the map is a metadata table with eleven columns: Variable, Type, Description, Temporal Resolution, Start Date, End Date, Sensor Height, Values, Value Notes, Sky View Factor, and Height/Width Values.
Row 1: Air Temperature (Ventilated). Type is P T 1000 1/3 Class B. Description notes a sensor with screen, accuracy plus or minus 0.1 degrees Celsius, and resolution of 0.01 degrees Celsius. Temporal resolution is 1 h. Dates range from Jan. 1, 2011, to Oct. 28, 2022. Sensor height is 2 m. Values are listed as C A L C / I N D I C E S. Sky View Factor is Vineyard - open sky.
Row 2: Precipitation. Type is Double tipping bucket rain gauge. Description notes sensitivity of 1 tip per 0.2 mm, maximum rain of 12 mm/minute, and accuracy of plus or minus 5 percent. Temporal resolution is 1 h. Dates range from Jan. 1, 2011, to Oct. 28, 2022. Sensor height is 2 m. Values are listed as C A L C / I N D I C E S. Sky View Factor is Vineyard - open sky.
Row 3: Air Relative Humidity. Type is R O T R O N I C Hygromer I N - 1. Temporal resolution is 1 h. Dates range from Jan. to Oct. Sensor height is 2 m. Values are listed as C A L C / I N D I C E S. Sky View Factor is Vineyard - open sky.
4. Case study based validation
In this section, we validate the FMP system against the FAIR principles using the NSUNET case study, as this data is freely available on Zenodo (Savić et al., Reference Savić, Šećerov, Dunjić and Milošević2023a) with a dataset description and statistical summary presented in (Savić et al., Reference Savić, Šećerov, Lalić, Nie and Roantree2023c). We begin with a discussion on FMP system functionality to understand how it automatically provides compliance with a large number of FAIR metrics. We then examine FMP metadata capture in detail to highlight how greater levels of FAIR conformance are obtained, followed by a discussion on NSUNET metadata and its conformance with FAIR principles.
4.1. FMP metadata structure
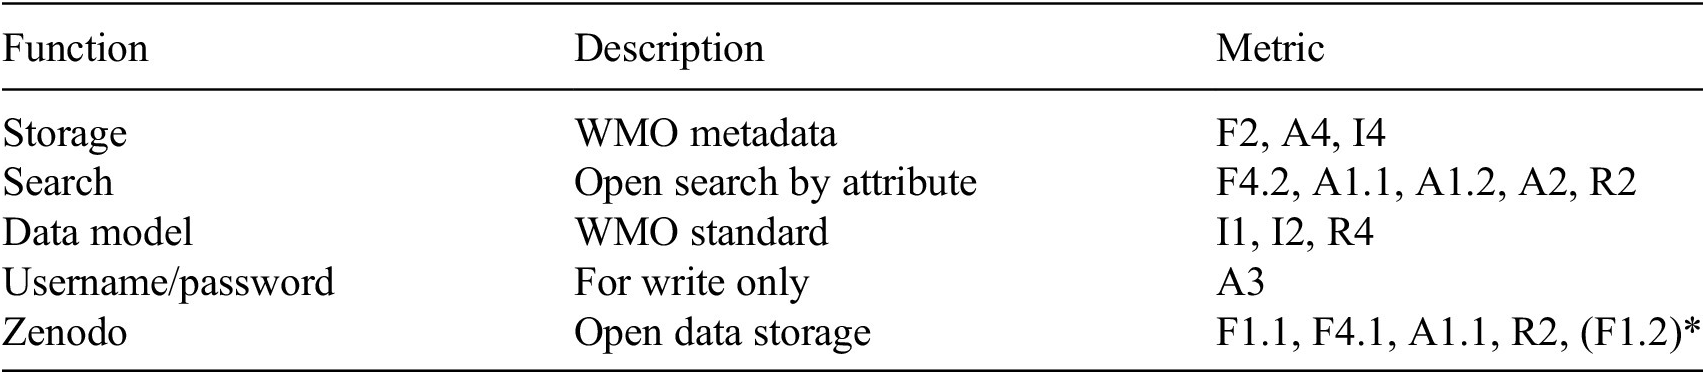
In Table 2, we can see the different FAIR metrics that are automatically delivered by the FMP system, once the user provides a description for each attribute. By providing storage for metadata descriptions of climate data, the requirements for F2, A4, and I4 are met: data is described by rich metadata; metadata is accessible past the lifetime of data (Zenodo DOI), and importing/exporting of metadata is facilitated. The FMP’s Search option means that both metadata and data (link to Zenodo) can be retrieved (F4.2, A1.1, A1.2, A2) with a clear usage policy (R2). By adopting the WMO description for climate data and measurements, I1 and I2 are achieved, but so is R4 (meeting a domain standard). The authentication screen ensures compliance with A3 while the adoption of Zenodo’s technology ensures that F1.1 (globally unique IDs), F4.1 (searchable data), A1.1 (standard access), and R2 (open data usage policy) are met. In addition, Zenodo could be used for metadata storage; for this case study validation, the FMP was used to export metadata for the entire NSUNET network, which was stored on Zenodo and subsequently provided with a unique DOI (F1.2). In summary, conformance to 15 of the 19 FAIR principles is provided through FMP functionality.
FMP functionality and FAIR conformance

Table 2. Long description
The table consists of three columns: Function, Description, and Metric.
Row 1: Function is Storage. Description is W M O metadata. Metric includes F 2, A 4, and I 4.
Row 2: Function is Search. Description is Open search by attribute. Metric includes F 4.2, A 1.1, A 1.2, A 2, and R 2.
Row 3: Function is Data model. Description is W M O standard. Metric includes I 1, I 2, and R 4.
Row 4: Function is Username forward slash password. Description is For write only. Metric is A 3.
Row 5: Function is Zenodo. Description is Open data storage. Metric includes F 1.1, F 4.1, A 1.1, R 2, and F 1.2 in parentheses with an asterisk.
4.2. NSUNET case study and discussion
The full metadata record used in this evaluation is openly available (Savić et al., Reference Savić, Šećerov, Dunjić and Milošević2023b), with extracts provided in Tables A1 and A2 in Appendices A and B of the Supplementary Material, respectively. In Table 3, we show each metadata variable used to describe climate datasets and highlight the four variables that were missing from the previous discussion on FMP functionality and compliance. The F3 metric is delivered by the DOI variable; I3 is covered by the many variables that contain references to other metadata; R1 is delivered by the totality of the metadata captured; and R3 provides some detail of provenance (dates, ownership, and the totality of metadata).
FMP datasets and FAIR conformance

Table 3. Long description
The table is organized into three primary metadata sections, each with a list of attributes and their corresponding F A I R metrics.
1. Network metadata: Includes institution, project, network_code, contact_email, country, city_region, local_environment, seasonality, start_date, end_date, reference, D O I creation dates, and is_public. All these map to metrics F2, I3, R1. date_created and date_modified map to F2, I3, R1, R3. D O I maps to F2, F3, I3, R1.
2. Site metadata: Includes name, latitude, longitude, altitude, time_zone, and macroscale_env, all mapping to F2, I3, R1. date_created and date_modified map to F2, I3, R1, R3. D O I maps to F2, F3, I3, R1.
3. Sensor metadata: Includes variable, type, description, temporal_resolution, start_date, end_date, sensor_height, values, value_notes, sky_view_factor, height_width_values, and photo. All these map to metrics F2, I3, R1. date_created and date_modified map to F2, I3, R1, R3.
While the validation supports the position that FMP usage ensures that scientific data is FAIR compliant, it relies on underlying technologies (e.g., Zenodo) to cover some of the metrics. While this does not necessarily require that data be open (minimal data uploaded to Zenodo still provides lifetime DOIs), it highlights that there are degrees of FAIR compliance. What this suggests is that while two datasets may be FAIR compliant, one of these datasets may be easier for users to find, search, and use. For this issue to be tackled, it will require more FAIR respositories, more scientists engaging with the process, and ultimately, a data flow process that becomes embedded as part of research data creation or acquisition and subsequent management.
The other issues that arise are whether or not FAIR data is actually interoperable. In other words, data can deliver on all four Interoperable metrics but still have low levels of interoperability. This is because true interoperability requires a fair higher level of data engineering, for example, to integrate two datasets from unrelated projects. Some efforts have used quite an extensive set of metadata descriptions to deliver data integration, for example, the research in Frémand et al. (Reference Frémand, Fretwell, Bodart, Pritchard, Aitken, Bamber, Bell, Bianchi, Bingham, Blankenship, Casassa, Catania, Christianson, Conway, Corr, Cui, Damaske, Damm, Drews, Eagles, Eisen, Eisermann, Ferraccioli, Field, Forsberg, Franke, Fujita, Gim, Goel, Gogineni, Greenbaum, Hills, Hindmarsh, Hoffman, Holmlund, Holschuh, Holt, Horlings, Humbert, Jacobel, Jansen, Jenkins, Jokat, Jordan, King, Kohler, Krabill, Kusk Gillespie, Langley, Lee, Leitchenkov, Leuschen, Luyendyk, MacGregor, MacKie, Matsuoka, Morlighem, Mouginot, Nitsche, Nogi, Nost, Paden, Pattyn, Popov, Rignot, Rippin, Rivera, Roberts, Ross, Ruppel, Schroeder, Siegert, Smith, Steinhage, Studinger, Sun, Tabacco, Tinto, Urbini, Vaughan, Welch, Wilson, Young and Zirizzotti2023) adopting the CF metamodel (Eaton et al., Reference Eaton, Gregory, Drach, Taylor, Hankin, Caron, Signell, Bentley, Rappa, Höck, Pamment, Juckes, Raspaud, Blower, Horne, Whiteaker, Blodgett, Zender, Lee, Hassell, Snow, Kölling, Allured, Jelenak, Soerensen, Gaultier, Herlédan, Manzano, Bärring, Barker and Bartholomew2023). This far stricter level of FAIR conformance (many mandatory metadata descriptions) leads to higher levels of interoperability but comes at a price. That price is related to resource overhead and acceptance of additional effort by the scientific community. This tradeoff requires a deeper discussion with scientists around the longer-term benefits and significant impact of highly interoperable FAIR data. However, it may also require funding agencies to separately fund this additional overhead while simultaneously making FAIR data processing activities a mandatory part of the funding process.
4.3. Mapping to FAIRSFAIR: A broader evaluation
As part of a broader and more objective evaluation, we used one of the evaluation tools, FAIRSFAIR, described in Peters-von (Gehlen, Reference Gehlen2022). This assessment is described in detail in Devaraju et al. (Reference Devaraju, Huber, Mokrane, Herterich, Cepinskas, de Vries, L’Hours, Davidson and White2020), with metrics presented in Table A3 in Appendix C of the Supplementary Material for ease of reference. For this exercise, we took all 15 metrics from the FAIRSFAIR evaluation and, rather than discussing how each metric is fulfilled, we mapped each individual metric to one or more attributes in the FMP schema. For reference, the entire schema is shown in Figure A1 in Appendix D of the Supplementary Material, with five key tables shown in Figure 5 together with mappings from each of the FAIRSFAIR metrics.
FsF metric to FMP schema mappings.

Figure 5. Long description
A relational schema diagram containing five database tables and various red-boxed labels indicating F s F metrics.
Top-left table: k s p _ s i t e d a t a u p l o a d. A red box to its left contains F s F dash F 1 dash 0 1 D, F s F dash F 1 dash 0 2 D, F s F dash A 1 dash 0 1 M, F s F dash A 2 dash 0 1 M, and F s F dash R 1 dot 2 dash 0 1 M, pointing to fields d o i T E X T and z e n o d o _ l i n k T E X T.
Top-center table: k s p _ n e t w o r k. A red box above it contains F s F dash F 2 dash 0 1 M and F s F dash F 3 dash 0 1 M. A red box to its right contains F s F dash R 1 dot 1 dash 0 1 M pointing to the project T E X T field.
Top-right table: k s p _ n e t w o r k d a t a u p l o a d. A red box to its right contains F s F dash F 2 dash 0 1 M and F s F dash F 3 dash 0 1 M, with arrows pointing to date _ c r e a t e d, date _ m o d i f i e d, d o i, z e n o d o _ l i n k, and c r e a t e d _ b y _ i d.
Bottom-left: Text labels ‘Relational schema metadata’ and ‘Machine retrievable using metadata tables’ are associated with F s F dash R 1 dash 0 1 M D and a group containing F s F dash F 4 dash 0 1 M, F s F dash I 1 dash 0 1 M, and F s F dash R 1 dot 3 dash 0 2 D.
Bottom-center table: k s p _ s e n s o r. Red arrows labeled F K Relationships and F s F dash I 3 dash 0 1 M point upward toward the network and upload tables.
Bottom-right table: k s p _ u s e r. To its right, the text WORLD METEOROLOGICAL ORGANIZATION is labeled with F s F dash I 1 dash 0 2 M and F s F dash R 1 dot 3 dash 0 1 M.
In summary, the five Findable metrics denoted by FsF-F (in Table A3 in the Supplementary Material) are (mapped to) captured by doi, zenodo_link (ksp_sitedataupload), institution (ksp_network), date_created, date_modified, doi, zenodo_link, created_by_id (networkdataupload) attributes and in the case of FsF-F4-01M by relational database metadata (data definition tables). Both Accessible metrics denoted by FsF-A are captured by doi, zenodo_link (ksp_sitedataupload). The Interoperable metric FsF-I1-01M (metadata is represented using a formal knowledge representation language) is captured by the fact that all data is created and manipulated by SQL. As the WMO model captures semantics for micrometeorological data, the FsF-I1-02M metric is satisfied. The FsF-I2-01M metric (metadata contains links between data and related entities) is captured through a combination of tables as foreign-primary key relationships. There are five Reusability metrics: two are satisfied by virtue of using a relational database model to capture metadata: FsF-R1-01 MD and FsF-R3-02D; one is satisfied by virtue of the WMO standard model (FsF-R1.3-01 M); and the remaining two metrics are captured by FMP attributes doi and zenodo_link (ksp_sitedataupload) and project (ksp_network). Note that while project is used to capture license information, the user is not explicitly requested to enter license information. The next version of the FMP will make that more explicit.
5. Conclusions and future work
In this paper, we articulated the motivation for making scientific data FAIR with a particular focus on climate research data, where long-term reuse, interoperability, and trust are critical. Achieving FAIR compliance in practice requires not only well-defined principles but also easy-to-use, robust tools that enable scientists to associate their datasets with a form of FAIR Certification without imposing excessive technical overhead. Our contribution demonstrates how the FMP can effectively deliver such certification for climate research data. Using an extended set of FAIR metrics, we show that 15 out of 19 metrics—almost 80%—are automatically satisfied by the system itself. This result is significant, as it implies that once researchers register high-quality data descriptions (FAIR metadata) within the FMP, a substantial level of FAIR compliance is inherently achieved, reducing both effort and potential for error. As part of the validation of this approach, we illustrated how the remaining FAIR metrics can be addressed through established WMO metadata standards, using a real-world case study of an urban micrometeorological network in Novi Sad comprising 12 observation sites. This case study confirms that the combination of FMP infrastructure and domain-standard metadata provides a comprehensive and practical pathway to FAIR certification for climate datasets.
Future development of the FMP will be organized at two complementary levels in order to deliver platform extensions in the meteorological domain and beyond. First, the platform will be extended to assimilate measurements from physical sensors that are currently not introduced into the system (leaf and soil wetness, for example) and virtual sensors. Data associated with virtual sensors could be obtained using different a physics-based approach, machine learning, or a hybrid of these approaches, such as PINNs Viet-Cuong et al. (Reference Viet-Cuong, Lalić, Petrić, Thanh-Binh and Roantree2024). Additionally, micrometeorological data of future weather, obtained by downscaling of NWP model outputs on a microscale, would be a significant addition to FMP and important for the broader community. An important feature describing the dataset, which will be added in future metadata as mandatory, is a standardized method used for gap filling if this procedure is applied. Second, the application of the FMP concept from the micrometeorological domain is equally important. In meetings with research from both agronomy and epidemiology domains as part of the European Cost Action CA20108, it was concluded that there is a significant need for standardization Lalic et al. (Reference Lalic, Eitzinger, Sremac, Scriney and Roantree2026). In the case of agronomy, it is the result of a combined lack of uniform metadata definition and certain reservations regarding data sharing. In the case of epidemiology, the problem is even more complex because sharing any information related to human health is an extremely sensitive topic.
Open peer review
To view the open peer review materials for this article, please visit http://doi.org/10.1017/eds.2026.10071.
Supplementary material
The supplementary material for this article can be found at http://doi.org/10.1017/eds.2026.10071.
Author contributions
Conceptualization: M.R., V.M.N., and B.L.; Data curation: S.S. and M.S.; Investigation: M.R.; Methodology: M.R.; Software: M.S.; Validation: S.S. and M.S.; Visualization: V.M.N.; Writing—original draft preparation: M.R. and V.M.N.; Writing—review and editing: V.M.N., S.S., B.L., and M.S.
Competing interests
The authors declare that they have no competing interests.
Data availability statement
Metadata used for the case study evaluation is openly available at https://www.zenodo.org/record/8237900 (Savić et al., Reference Savić, Šećerov, Dunjić and Milošević2023b). Both the cleaned hourly air temperature datasets from the NSUNET system and the raw 10-minute interval data (original data) are openly available at https://www.zenodo.org/record/7738093 (Savić et al., Reference Savić, Šećerov, Dunjić and Milošević2023a).
Funding statement
This publication has emanated from research conducted with the financial support of Taighde Éireann – Research Ireland, under Grant number [23/RC/13506] at Rinn Artificial Intelligence. Additionally, this work was also supported by the Ministry of Science, Technological Development and Innovation of the Republic of Serbia [Contract number 451-03-34/2026-03/200117 dated 05 February 2026]; by the European Union [Grant Agreements No.101136578 and 101156281].




 Open access


Comments
Dear Professor Monteleoni,
We are pleased to submit the manuscript entitled “Developing FAIR Functionality and Properties for Micrometeorological Data” for consideration for publication in Environmental Data Science.
The motivation for this work arises from the growing scientific and societal demand for high-quality, interoperable environmental data to address challenges such as climate-driven agricultural losses, water resource management, urbanisation, and the spread of invasive species and disease vectors. While the FAIR principles provide a widely accepted framework for improving the discoverability, accessibility, interoperability, and reusability of scientific data, their practical implementation—particularly for micrometeorological and climate datasets—remains challenging for many data providers.
In this manuscript, we present the FAIR Micrometeorological Portal (FMP), developed within the COST Action CA20108, as a practical and scalable solution to operationalising FAIR principles for micrometeorological data. The paper makes two primary contributions that we believe align closely with the aims and scope of Environmental Data Science. First, we demonstrate how FAIR compliance can be embedded into a working research infrastructure, providing data owners with a step-by-step pathway toward FAIR certification with minimal technical overhead. Second, we validate the system against an extended set of FAIR metrics, showing that 15 out of 19 metrics—approximately 80%—are automatically satisfied once FAIR metadata are registered within the portal.
To demonstrate real-world applicability, we further validate the remaining FAIR metrics using established WMO metadata standards through a case study of an urban micrometeorological network in Novi Sad comprising twelve observation sites. This case study illustrates how domain standards and digital infrastructure can be combined to provide a comprehensive and largely automated approach to FAIR certification for climate and environmental data.
We believe this work will be of strong interest to the readership of Environmental Data Science, particularly researchers and practitioners concerned with data infrastructures, FAIR implementation, environmental informatics, and the reuse of climate and micrometeorological data. By lowering the barriers to FAIR compliance, the approach presented has the potential to improve data visibility, reuse, and cross-domain integration, contributing to more transparent and reproducible environmental science.
This manuscript has not been published previously and is not under consideration for publication elsewhere. All authors have approved the manuscript and agree with its submission to Environmental Data Science. The work was supported by the European Cooperation in Science and Technology (COST) Grant CA20108, Taighde Éireann – Research Ireland (Grant SFI/12/RC/2289_P2), and the Ministry of Education, Science and Technological Development of the Republic of Serbia (Grant No. 451-03-47/2023-01/200117).
Thank you for considering our submission. We would welcome the opportunity to revise the manuscript in response to reviewers’ comments and hope that you find it suitable for publication in Environmental Data Science.
Yours sincerely,
Vuong M. Ngo
(on behalf of the authors)
School of Computing, Dublin City University