1. INTRODUCTION
Designers often communicate design concepts to each other with informal sketches, speech, and gestures. Although the importance of such communication has long been recognized by designers (Ullman et al., Reference Ullman, Wood and Craig1990), traditional design tools do not support this in any substantive way. Our long-term goal is to remedy this by creating computational techniques to enable collaborative design tools that support natural multimodal communication.
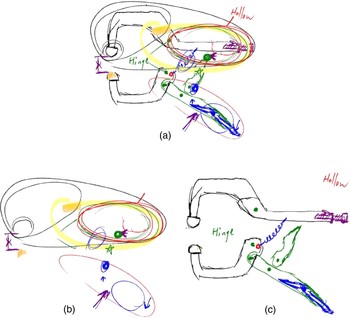
In previous work (Bischel et al., Reference Bischel, Stahovich, Peterson, Davis and Adler2009), we conducted a study to examine the nature of multimodal communication in collaborative design. Specifically, we examined how designers use natural free-form sketching and speaking to describe the structure and behavior of a mechanical device. We found that both the sketch and speech are essential to such descriptions, and that typically neither modality can be understood without the other. In addition, the wide variety of information contained in the sketches makes them particularly challenging to interpret. Although many of the pen strokes portray device structure, others are gestures, such as arrows used to indicate motion, or circles used to single out a component being discussed. Figure 1a, which depicts a pair of C-clamp vise-grip pliers, is a typical sketch from the study. Consider the challenge such a drawing poses for any sketch-understanding software. To understand this sketch, it is first necessary to distinguish the gesture strokes (Fig. 1b) from the object strokes representing device structure or handwritten text (Fig. 1c).
(a) A sketch of C-clamp vise-grip pliers, (b) gesture pen strokes, and (c) pen strokes representing device structure and text. [A color version of this figure can be viewed online at journals.cambridge.org/aie]

Separating strokes in this way is valuable beyond the obvious purpose of facilitating sketch recognition. Most, if not all, gesture strokes have only temporary value. For example, gestures resolving deictic references or indicating the motion of a part may be superfluous once the discussion has moved on to a new topic. However, over time, such gestures accumulate (e.g., Fig. 1a), obscuring the sketch and hindering discussion. Detecting these and removing them from view when they are no longer needed may enable more efficient communication.
As part of our work in Bischel et al. (Reference Bischel, Stahovich, Peterson, Davis and Adler2009), we developed a technique for distinguishing gesture strokes from object strokes. The technique employs a statistical classifier that uses features of both the sketch and speech. The sketch features compute geometric properties of the strokes, and the spatial and temporal relationships between them. The speech features compute statistical properties of the speech aligned with each stroke. Experiments with the technique indicated that the speech modality is more important than the sketch modality for gesture/object classification: the single most effective feature for classification was a speech feature.
The importance of speech for gesture/object classification suggests that the accuracy of the speech–sketch alignment process is critical to gesture classification. The work in Bischel et al. (Reference Bischel, Stahovich, Peterson, Davis and Adler2009), used a “3-sec” alignment technique, in which the speech and sketch input were aligned based on temporal correlation. Each stroke was associated with the words that at least partially coincided with a temporal window extending three seconds on either side of the stroke. Our present work is focused on measuring the performance of this 3-sec alignment technique, and developing a new alignment technique to overcome some of its limitations, thus enabling more accurate gesture/object classification.
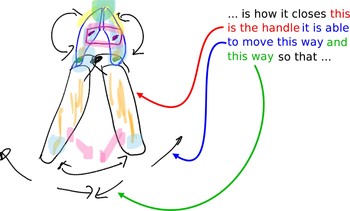
To evaluate the 3-sec alignment technique, we began by manually aligning the speech and sketch from the study in Bischel et al. (Reference Bischel, Stahovich, Peterson, Davis and Adler2009), as illustrated in Figure 2. We did this by first segmenting the speech primarily into clauses and then aligning these with the strokes to which they refer. Comparison of the 3-sec and manual alignment revealed that the former has substantial room for improvement. For example, for 41% of pen strokes, there was no intersection between the 3-sec alignment and the correct (manual) alignment.
An example of the alignment of strokes with the speech that refers to them. The bold arrows link the word groups with the associated pen strokes. [A color version of this figure can be viewed online at journals.cambridge.org/aie]

Consequently, we sought to develop an improved alignment technique, which we modeled on our manual alignment process. The new technique employs an explicit speech segmentation process, followed by a segment–stroke alignment process. Because both processes employ statistical classifiers, we call our technique “classifier-based alignment” (CBA). Evaluation of the new technique demonstrated that it produces considerably more accurate alignment than the 3-sec technique. It is more important, however, that it results in substantially better gesture classification accuracy.
This work makes several contributions. First, we developed a technique for segmenting speech into meaningful clauses. The technique is well suited to the ungrammatical speech characteristic of multimodal dialog. The technique is effective, in part, because it uses information from the sketch input to help process the speech. Second, we developed a novel technique for aligning the segmented speech with the pen strokes to which it refers. These two efforts combine to produce an effective and accurate speech–sketch alignment technique for multimodal dialog. Third, we demonstrated that the new alignment technique enables accurate classification of gesture and object strokes in a multimodal dialog.
The next section places this work in the context of related work. This is followed in Section 3 by a description of our study from Bischel et al. (Reference Bischel, Stahovich, Peterson, Davis and Adler2009) and the gesture classification technique we developed in that work. Section 4 describes our manual speech–sketch alignment process and presents an evaluation of the alignment accuracy of the 3-sec technique. Next, Section 5 describes our classifier-based speech–sketch alignment technique, including the speech segmentation technique it employs. Section 6 presents the gesture classification accuracy obtained using the two speech–sketch alignment techniques and compares this to the accuracy achieved via manual alignment. After a discussion of these results in Section 7, conclusions are presented in Section 8.
2. RELATED WORK
Multimodal systems date back at least to the work of Brown (Reference Brown, Kwasny, Chandrasekaran and Sondheimer1979), with subsequent early multimodal systems incorporating typed language and pointing with a mouse or light-pen (Wauchope, Reference Wauchope1994; Woods et al., Reference Woods, Bates, Bobrow, Brachman, Cohen and Klovstad1979). Bolt's “put-that-there” system (Bolt, Reference Bolt1980) was the first to incorporate early speech and three-dimensional pointing recognizers. Quickset (Cohen et al., Reference Cohen, Johnston, McGee, Oviatt, Pittman, Smith, Chen and Clow1997) explores a general architecture for multimodal fusion, but unlike our work, QuickSet is a command-based system, that is, the utterances are used as verbal replacements for mouse or menu commands. The iMap system handles free-hand gestures in a map–control user interface, using prosody cues to improve gesture recognition (Krahnstoever et al., Reference Krahnstoever, Kettebekov, Yeasin and Sharma2002). The system in Johnston et al. (Reference Johnston, Bangalore, Vasireddy, Stent, Ehlen, Walker, Whittaker and Maloor2002) provides a speech and pen interface to restaurant and subway information for New York City, but it is not a sketching system and has only text recognition and basic circling and pointing gestures for the graphical input modality.
Other applications of speaking and sketching include an early effort that used a diagram and written English text (Novak & Bulko, Reference Novak and Bulko1993), interesting in part because it used a blackboard to help establish the reference relationships between the graphical and text entities. BBN's Portable Voice Assistant (Oviatt, Reference Oviatt2000) uses pen and voice input to enter and retrieve information on the Web. Their system integrates simultaneous speech and gesture inputs using a frame-based system. The Human-Centric Word Processor (Oviatt et al., Reference Oviatt, Cohen, Wu, Vergo, Duncan, Suhm, Bers, Holzman, Winograd, Landay, Larson and Ferro2000) enables radiologists to use pen-based selection gestures and command-based speech for postdictation correction of transcriptions. nuSketch COA Creator (Forbus et al., Reference Forbus, Ferguson and Usher2001) is designed as a general purpose multimodal architecture, allowing users to sketch and talk to add symbols to a military map using commands like “add severely restricted terrain.” This system also uses command-based speech, and is focused on issues of reasoning about the content of the sketch rather than on recognition: the user assigns symbolic labels to the sketched objects.
Many systems have benefited from the series of empirical studies of multimodal communication in (Oviatt et al., Reference Oviatt, DeAngeli and Kuhn1997). Cassell (Reference Cassell, Cipolla and Pentland1998) was among the first to argue that natural, free-hand gestures can be relevant to human computer interaction, and presented a helpful framework for gestural interaction. Oviatt (Reference Oviatt1999) has demonstrated advantages of multimodal interfaces, noting that multimodal input simplifies the users’ vocabulary and improves accuracy with accented speakers.
Our work is grounded in insights about how people use multimodal explanations to describe devices. Ullman et al. (Reference Ullman, Wood and Craig1990) found that engineers commonly use five different categories of pen strokes in a sketch. His “support” and “draw” strokes are analogous to our categories of gesture and object strokes. Heiser and Tversky (Reference Heiser and Tversky2006) concluded that when there are numerous arrow gestures in a sketch, students can more easily understand the functionality of a device, illustrating the importance of gestures in a design sketch.
Much of the previous work in understanding descriptions of mechanical devices has focused solely on sketching of structure (e.g., Bloomenthal & Zeleznik, Reference Bloomenthal and Zeleznik1998; Masry et al., Reference Masry, Kang and Lipson2005). By contrast, GIDeS++ (Silva & Cardoso, Reference Silva and Cardoso2004) is a multimodal system specifically designed to understand descriptions of mechanical devices, but it uses pen strokes to replace mouse functionality rather than attempting to maintain a natural sketching environment. Likewise, ASSISTANCE (Oltmans, Reference Oltmans2000) incorporates spoken behavioral descriptions to supplement the understanding of mechanical device sketches. However, it relies on limited vocabularies of speech patterns that must be explicitly identified in advance, where our system can adapt to new patterns via user-provided training data.
Hand and arm gestures have long been a topic of research. Kendon (Reference Kendon1997) provides an overview of the study of gesture, dating back to work by Quintilianus (circa the first century) in which he details how an orator ought to use gesture in discourse. More relevant to our work, Kendon explores the organization of speech and gestures. He finds that speech is organized into “idea units” marked by prosodic features, such as pitch level and loudness, rather than by lexical properties. Similarly, gestures are organized into “gesture units.” This suggests the need to segment our speech prior to aligning it with pen strokes. However, we segment speech based primarily on lexical considerations, and align each pen stroke with at most one speech segment.
Efron (Reference Efron1941) classifies hand and arm gestures across three dimensions: the trajectory of the gesture, whether the gesture involves the listener, and whether the gesture inherently contains semantic information. In our domain, gestures do not directly involve a listener, but they do contain semantic information that is frequently conveyed through shape.
We find parallels between the pen stroke gestures considered in our work and the hand and arm gestures studied by McNeill (Reference McNeill1992). In McNeill's classification scheme, hand/arm gestures describing objects or actions are called imagistic, whereas those that do not evoke imagery are called nonimagistic. Imagistic gestures are further subdivided into iconic or metaphoric gestures. The former represent concrete concepts, such as a speaker illustrating how they threw a baseball by mimicking the action of throwing. The latter present abstract imagery, such as a person balling their fists and then quickly spreading their fingers to convey a metaphoric “explosion,” illustrating frustration about the topic of discussion (McNeill, Reference McNeill1992). Nonimagistic gestures are also divided into two categories: deictic and beats. The former are pointing gestures, whereas the latter are typically involuntary movements of the hands made while speaking, and which carry no meaning.
Gestures are often understood in the context of accompanying speech. Oviatt et al. (Reference Oviatt, DeAngeli and Kuhn1997) studied humans interacting with dynamic mapping software, quantifying the likelihood that speaking or sketching would occur first or that they would start simultaneously. This work was extended by Adler and Davis (Reference Adler and Davis2007) for design descriptions, who found consistent time delay patterns between when a pen stroke was drawn and when the related speech was spoken. The 3-sec speech–sketch alignment technique in Bischel et al. (Reference Bischel, Stahovich, Peterson, Davis and Adler2009) builds on this.
The findings of Oviatt et al. (Reference Oviatt, DeAngeli and Kuhn1997) and Adler and Davis (Reference Adler and Davis2007) are at odds with findings of McNeill (Reference McNeill1992), which suggest that speech always co-occurs with its referent gesture. This discrepancy is likely due to the differences in the domains considered. Oviatt and Adler consider speaking and drawing, whereas McNeill considers hand and arm gestures made during typical conversation. Although hand/arm gestures are often made with minimal effort or concentration, drawing can often require enough concentration so as to interrupt speaking. Likewise, drawing is inherently slower than hand/arm gesturing, which may contribute significantly to the differences in gesture/speech alignment between the two domains.
The work by Chai et al. (Reference Chai, Hong and Zhou2004, Reference Chai, Prasov, Blaim and Jin2005) sets interaction in the context of a dialogue, using context, semantics, and linguistic principles to resolve gestural references. Our task is different in that we must differentiate between gesture and object pen strokes and we consider ungrammatical, disfluent speech, whereas they assume the speech is unambiguous. Furthermore, they interpret interaction in the context of a predefined image, whereas we consider an incrementally created sketch whose meaning is not known in advance.
There have been several prior efforts focused on segmenting speech into phrases and sentences. For example, Nakai and Shimodaira (Reference Nakai and Shimodaira1994) describe a method that uses prosodic features to segment speech into accent phrases. A least-squares approach is used to find the optimum match between the speech and pitch pattern templates. A 97% segmentation accuracy is reported for a case in which the 30 best candidate segmentations are considered.
Most current techniques for identifying sentence boundaries in speech transcriptions are based on a hidden Markov model (Stolcke & Shriberg, Reference Stolcke, Shriberg, Bunnell and Idsardi1996; Stolcke et al., Reference Stolcke, Shriberg, Bates, Ostendorf, Hakkani, Plauche, Tur, Lu, Mannell and Robert-Ribes1998; Gotoh & Renals, Reference Gotoh and Renals2000; Hwan Kim & Woodland, Reference Hwan Kim and Woodland2001). An n-gram language model is used to describe the joint distribution of words and sentence boundaries, which are modeled as events that occur between words. Many methods also use prosodic features for locating sentence boundaries. For example, Gotoh and Renals (Reference Gotoh and Renals2000) combine their n-gram language model with a prosodic model based on pause duration. Likewise, Hwan Kim and Woodland (Reference Hwan Kim and Woodland2001) use a prosodic model based on 10 features. Stolcke and Shriberg (Reference Stolcke, Shriberg, Bunnell and Idsardi1996) included part of speech information in an n-gram language model, and found that this improves accuracy. In later work, Stolcke et al. (Reference Stolcke, Shriberg, Bates, Ostendorf, Hakkani, Plauche, Tur, Lu, Mannell and Robert-Ribes1998) augmented their n-gram language model with turn boundaries (change in speaker) and long pauses. All of these methods for locating sentence boundaries have been applied to telephone conversation and news broadcasts, whereas we consider a multimodal context with both speaking and sketching. In addition, although these methods classify interword events as boundaries and nonboundaries, we classify words according to their position in a speech segment. As described in Section 5.1, this allows us to take advantage of the frequent occurrence of single-word segments.
Sentence boundary detection methods vary in the way they combine the language and prosodic models. Stolcke et al. (Reference Stolcke, Shriberg, Bates, Ostendorf, Hakkani, Plauche, Tur, Lu, Mannell and Robert-Ribes1998) explore a variety of combination techniques including model interpolation, independent model combination, and joint modeling. In the latter case, a decision tree is used to combine posterior probabilities from the language model with prosodic features. Similarly, Liu et al. (Reference Liu, Stolcke, Shriberg and Harper2004) use a maximum entropy model to combine prosodic and word-level features. We do not use an explicit language model, but instead use a single classifier (Ada-boosted C4.5 decision tree) to directly combine word-based, prosodic (pause), and sketch-based features.
Our gesture classifier (Bischel et al., Reference Bischel, Stahovich, Peterson, Davis and Adler2009) is related to the work of Patel et al. (Reference Patel, Plimmer, Grundy and Ihaka2007) and Bishop, Svensen, and Hinton (Reference Bishop, Svensen and Hinton2004) on separating text strokes from nontext strokes. These works differ from ours in considering only features from the sketch, where we examine the accompanying speech. In addition, in their work, text consists of a consistent set of letter and number glyphs, where the gestures in our domain are often unique, and frequently have the same shapes as object strokes.
Our gesture classifier also builds on work in shape recognition by using the kinds of features used by feature-based recognizers, such as in Patel et al. (Reference Patel, Plimmer, Grundy and Ihaka2007) and Rubine (Reference Rubine1991). Our system relies on some of the features these systems use, but it also extracts new features to address the special nature of identifying free-form gestures.
In examining properties of the accompanying speech, our gesture classifier does not try to understand it but simply identify it as that which accompanies either a gesture or object stroke. We do this with Bayesian filters (Graham, Reference Graham2004) and Markovian filters (Yerazunis, Reference Yerazunis2004).
In summary, our work differs from much of the work in multimodal interfaces in that we consider free-form speech and sketching, rather than a predefined vocabulary. Similarly, although most multimodal systems use speech and sketch input as a substitute for mouse/menu commands, we consider the task of classifying sketch input as gesture and object strokes. Although many speech segmentation techniques exist, ours is novel in that it uses information from the sketch modality. In addition, it uses a single classifier to directly combine word-based, prosodic (pause), and sketch-based features. Finally, our speech–sketch alignment technique is novel in that it works from segmented speech and uses classifiers to detect and repair common alignment errors.
3. BACKGROUND: DISTINGUISHING GESTURE AND OBJECT STROKES
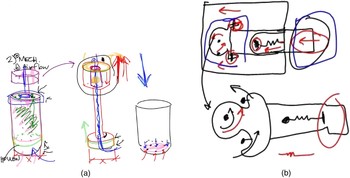
As described in Bischel et al. (Reference Bischel, Stahovich, Peterson, Davis and Adler2009), we conducted a study to characterize how designers use natural free-form sketching, speaking, and gesturing to communicate design descriptions to each other.Footnote 1 The study involved descriptions of four devices: C-clamp vise-grip pliers, bolt cutters, an air pump for inflating balls, and a door lock (Fig. 1, Fig. 2, and Fig. 3). The participants were 16 graduate and senior undergraduate mechanical engineering students at UC Riverside. Four were female. English was the primary language for 9 participants, but the speech of 10 participants was indistinguishable from that of native English speakers. Eleven participants received their engineering instruction in English. There were only 4 participants that both did not have English as their primary language and did not receive engineering instruction in English. Fourteen participants had previously taken a course in engineering drawing, and 7 had completed a team-based project-design course.
Two of the devices from the study: (a) an air pump for inflating balls and (b) a door lock. [A color version of this figure can be viewed online at journals.cambridge.org/aie]

Each study session involved a pair of participants placed in separate rooms and allowed to communicate using tablet PCs, microphones, and headphones. The tablets provided a shared drawing environment with a pen, highlighter, and eraser, and the ability to select from several ink colors. The audio and drawing were recorded with timestamps.
During a session, one participant was asked to describe a device to his or her partner, who could ask clarifying questions. At the end of the description, both participants were asked survey questions about the structure and behavior of the device. To motivate effective dialog, the participants were informed that their compensation would be based on the accuracy of their answers. (All participants were given the maximum compensation.) The two participants repeated this process three times, switching roles, so that each participant described two devices. In all, a total of 48 device descriptions were collected.
Figures 1, 2, and 3 show typical examples of sketches collected in the study. As discussed above, these sketches contain two types of pen strokes: object strokes and gesture strokes. The former depict device structure or comprise text. The latter can be classified into two categories, adopted from the terminology developed by McNeill (Reference McNeill1992). Strokes that demonstrate an action, such as an arrow illustrating the direction in which the handles of a pair of vice grips may move, are iconic gestures. Similarly, strokes that resolve deictic references from the speech modality are deictic gestures. These gestures may take many forms, such as tapping, circling, highlighting, and tracing. Object strokes could be considered iconic gestures, as they provide a representation of an object. However, we distinguish between object strokes and other iconic gesture strokes because our goal is to separate the representation of a device's structure from the description of its behavior.
3.1. Classifier design
As Figure 1 illustrates, there can be a comparable number of gesture and object strokes in a sketch, making it challenging to understand the final image. There is a clear need for techniques to separate the two types of strokes. This would at first appear to be a shape recognition problem solvable with standard shape recognizers such as those in Kara and Stahovich (Reference Kara and Stahovich2005) and Wobbrock et al. (Reference Wobbrock, Wilson and Li2007). However, this problem is not amenable to such approaches for several reasons. First, gesture and object strokes can have arbitrary shapes, but shape recognizers require a predefined set of shapes. Second, gesture and object strokes may be identical, and thus shape alone does not distinguish between the two classes of strokes. For example, a common selection gesture consists of tracing the shape of an object.
For these reasons, the gesture/object classifier described in Bischel et al. (Reference Bischel, Stahovich, Peterson, Davis and Adler2009) does not explicitly consider the shape of the pen stroke. Instead, each pen stroke is represented by features that are computed from both the sketch and speech input. The sketch features describe properties of the pen strokes, and the spatial and temporal relationships between them. The speech features describe properties of the speech aligned with each stroke. These features serve as inputs to a neural network which classifies a stroke as a gesture or object stroke.
3.1.1. Sketch features
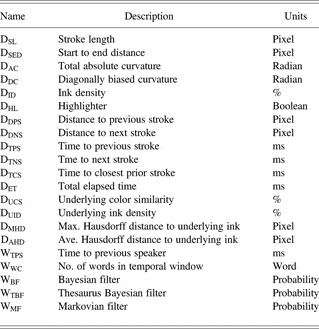
The complete set of sketch features used for gesture/object classification is listed in Table 1. The first six features concern individual strokes, where DSL is the length of the pen stroke, DSED is the distance between its first and last points, DAC is the sum of the absolute value of the curvature along a stroke, and DDC is similar to curvature but is biased toward diagonal drawing directions. The ink density (DID) is a measure of the compactness of the stroke. The highlighter feature (DHL) has a value of 1 if the stroke was made with a highlighter rather than an ordinary pen and is 0 otherwise.
Features for gesture versus object classification

Note: Dx, sketch (drawing) feature; Wx, speech (word) feature.
The remaining 10 features describe the temporal and spatial relationships between strokes, in which DDPS and DDNS are the distance to the previous and next strokes, DTPS and DTNS are the time between the stroke and the previous and next strokes, DTCS is the time between the stroke and the closest previously drawn stroke, and DET is the total elapsed time. The underlying color similarity (DUCS) measures the extent to which earlier nearby strokes have the same color as the stroke. Underlying ink density (DUID) is the density of the ink from other earlier pen strokes in the neighborhood (expanded bounding box) of the stroke. The two Hausdorff features (Kara & Stahovich, Reference Kara and Stahovich2005) measure the extent to which a stroke traces underlying strokes. For each point on the stroke, the closest distance to a point on another earlier stroke is computed. Here, DMHD is the maximum of these closest distances, and DAHD is the average.
3.1.2. Speech features
To compute the speech features, it was first necessary to align the speech and sketch input, that is, determine which words are associated with each pen stroke. The 3-sec alignment technique presented in Bischel et al. (Reference Bischel, Stahovich, Peterson, Davis and Adler2009) was grounded in observations by Adler and Davis (Reference Adler and Davis2007) and Oviatt et al. (Reference Oviatt, DeAngeli and Kuhn1997) suggesting that there is a strong temporal correlation between speaking and drawing. This technique employs a temporal window extending 3 s before and after the stroke. It is assumed that any words falling at least partially within this window are associated with the stroke. It is possible that a word may be associated with more than one stroke, or that a stroke may have no words associated with it.
The speech features associated with a pen stroke (Table 1) are computed from the speech aligned with it. To avoid inaccuracies inherent in current state of the art speech to text tools, the speech was manually transcribed and then Sphinx (Huang et al., Reference Huang, Alleva and Hon1993) was used to align the text with the recorded audio to find time stamps for the words. The words were also labeled with the identity of the speaker. Using manual transcriptions provides an upper bound on the contribution of the speech content to gesture classification. However, the speech may contain other valuable information, such as prosody, which was not considered.
The simplest speech features are the time to the previous speaker (WTPS) and the number of words aligned with the stroke (WWC). The other speech features concern the words themselves. Understanding grammatically correct speech is difficult enough; the speech considered here is ungrammatical, filled with pauses, repetitions, and disfluencies like “um” and “ah.” Trying to perform semantic analysis on such ungrammatical text is intractable at present. As an alternative, statistical models are used to predict whether a set of words corresponds to a gesture or object stroke.
The first statistical speech feature (WBF) is based on a Bayesian filter, a form of naive Bayesian classifier that has had some success in spam recognition (Graham, Reference Graham2004). To construct the Bayesian filter, it is necessary to learn the conditional probability that a stroke is a gesture, given a specific word, w i. Pr(Gesture | w i ) can be estimated from training data using Bayes’ theorem:

where Pr(w i|Gesture) is the conditional probability that word wi will be observed, given that a gesture stroke is observed; Pr(Gesture) is the prior probability of observing a gesture; and Pr(w i) is the prior probability of observing word w i.
Participants in the study used a varied vocabulary to describe the same objects and gestures. If the Bayesian filter encounters a word that was not in the training corpus, it is unable to produce a probability. The thesaurus Bayesian filter feature (WTBF) provides a remedy for this situation. It is computed much like WBF, except that a thesaurus is used to generalize the training data. One strength of these two features is that they learn which words are most likely to coincide with gesture or object strokes. However, these features do not consider word order. The Markovian filter feature (MMF) is analogous to the Bayesian filter features, but considers word sequences rather than individual words.
3.2. Results: Gesture/object classification accuracy
Bischel et al. (Reference Bischel, Stahovich, Peterson, Davis and Adler2009) used a form of holdout validation to evaluate the accuracy of the gesture classifier. The holdout set comprised 39 randomly selected sketches for training and 10 for testing. A conventional beam search approach (Aha & Bankert, Reference Aha and Bankert1994; Dash & Liu, Reference Dash and Liu1997; Gupta et al., Reference Gupta, Doermann and DeMenthon2002) was used to determine which sets of features are the most effective at classification. To provide additional insights about which features are the most important, this process was performed three times: once considering only sketch features, once considering only speech features, and once considering both.
The best single sketch feature classifier used DTNS and achieved 69.5% accuracy. The best sketch-only classifier achieved 76.2% accuracy using nine features: DSL, DDPS, DUID, DMHD, DAHD, DHL, DET, DAC, and DDC. The best single speech-feature classifier used WBF and achieved 77.7%. The best speech-only classifier achieved 78.2% accuracy using three features: WBF, WTBF, and WWC. The best classifier considering all features achieved 81.9% accuracy using six features: DTCS, DMHD, DHL, DET, WBF, and WTPS.
In Bischel et al. (Reference Bischel, Stahovich, Peterson, Davis and Adler2009), this process was actually performed for four holdout sets. For all sets, the results were similar: the single best feature in all cases was either WBF or WTBF. Similarly, for multifeature classifiers employing speech features, the best feature sets always contained at least one of these two features.
4. EVALUATION OF 3-SEC TECHNIQUE
As the results in the previous section demonstrate, the speech modality plays an important role in identifying gestures. For example, the two Bayesian filter features were the most important single features for classifying pen strokes as gesture or object strokes. The importance of speech suggests the need to examine the validity of the speech–sketch alignment technique that serves as the foundation for the speech features.
As the name suggests, the 3-sec alignment approach uses only temporal correlation to align the speech and sketch input. It is possible for this technique to associate speech with a stroke that is not logically related to it. To evaluate the performance of the 3-sec technique, we manually aligned the speech and pen strokes based on semantic information. We then compared the resulting alignment with that produced by the 3-sec technique. We also used the manually aligned speech to compute the speech features for our gesture classifier to determine if more accurate alignment would improve classification accuracy. The latter results are presented in Section 6.
4.1. Manual alignment
We manually aligned the speech and sketch modalities using a two-step approach. We first segmented the speech into small, meaningful statements. We then aligned each statement with the pen strokes, if any, to which it referred. The segmentation step proved to be difficult because the speech was terribly ungrammatical and disfluent, as is commonly the case in multimodal descriptions (Adler & Davis, Reference Adler and Davis2007). Because of the nature of the speech, we could not use a simple segmentation strategy, such as decomposing the speech into grammatically correct clauses. Oviatt et al. (Reference Oviatt, DeAngeli and Kuhn1997) suggest that in multimodal interactions, spoken phrases often follow a subject–verb–object pattern. We used this as the starting point for developing our manual segmentation approach. Our approach is similar to the Simple Metadata Annotation Specification (Strassel, Reference Strassel2004), but considers information from the sketch input.
Our manual segmentation comprises single “clauses” consisting of a subject, verb, and object; multiple logically related, sequential clauses; partial clauses; and filled pauses such as “uh” and “um.” Note that filled pauses are identified purely on lexical grounds and are not prosodic features of the speech. Whenever possible, we segmented the speech into subject–verb–object “clauses.” However, if the speaker moved on to a new thought before completing a clause, we segmented the incomplete thought into a partial clause. Likewise, a change in speaker before the completion of a clause also resulted in a partial clause.
Filled pauses could either comprise an entire segment or be included in a larger clause, depending on the circumstances. If the filled pause was in the middle of a set of words that otherwise formed a clause, the pause was grouped with that set of words. For example, “this handle uh moves here” is considered a single clause. Likewise, if the filled pause occurred immediately before the start of a clause, it was grouped with it. For example, “uh this handle moves here” would be segmented as a single clause if there were little delay between “uh” and “this.” In all other cases, filled pauses were considered to form their own segments.
There were two occasional exceptions to our segmentation strategy. Two or more clauses were joined if they referred to the same pen stroke. We did this so that each stroke would be aligned with at most one speech segment. In addition, if a clause had multiple objects referring to different strokes, the objects were split into separate clauses. These two cases are the primary differences between our segmentation approach and that in Strassel (Reference Strassel2004).
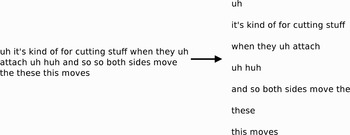
Figure 4 shows an example of the manual segmentation results. The first segment consists of the filled pause “uh.” This pause was not combined with the subsequent clause because the time gap was too large. “it's kind of for cutting stuff” is a typical clause with subject “it,” verb “is,” and object “for cutting stuff,” “when they uh attach” is also considered to be a clause with subject “they” and intransitive verb “attach.” In addition, the filled pause “uh” is included in the segment because it occurs inside an otherwise valid clause. “Uh huh” is a segment consisting of two filled pauses in close succession. The phrase “and so both sides move the” is a partial clause; the speaker changed thoughts before completing it. The word “these” is again a partial clause representing a new idea. Finally, the phrase “this moves” is a clause with a subject and verb, but no object.
Examples of manual segmentation: (left) raw speech and (right) segmented speech.

As this example illustrates, manually segmenting the speech required considerable judgment. The task was performed by two researchers. Each segmented one-half of the speech and then verified the segmentation accuracy of the other half. Once the segmentation was completed, the two researchers then manually aligned the segments and pen strokes. Each stroke was aligned with at most one speech segment. However, a speech segment could be aligned with multiple strokes. As with the segmentation, the researchers divided the task and verified each other's work.
An alternative approach for annotating our data would have been for each researcher to annotate the entire corpus individually and then arbitrate the single, final annotation. This approach can lead to a more consistent annotation of the corpus than the cross-validation approach we used (Artstein & Poesio, Reference Artstein and Poesio2005). We opted for our approach in the interest of expediency, and note that any inconsistencies between the two halves of the annotation will only hamper the performance of our statistical classifier.
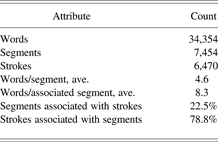
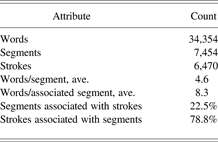
Table 2 tabulates the results of the manual segmentation and alignment process. The data from the study contained 34,354 words forming 7454 speech segments. We found that 78.8% of the 6470 pen strokes were aligned with speech segments, but only 22.5% of the segments were aligned with strokes. On average, there were 4.6 words per speech segment, but for segments aligned with strokes there was a much higher average of 8.3 words per segment.
Properties of manually aligned speech from user study
4.2. Alignment accuracy of 3-sec technique
We evaluated the accuracy of the 3-sec alignment technique by direct comparison with the manual alignment, which constitutes the correct result. Specifically, we compared the set of words associated with each pen stroke in the two cases. Note that the 3-sec technique does not have an explicit segmentation step. Rather, any words that fall at least partially within the 3-sec temporal window of a stroke are associated with it. Thus, there is no notion of segmentation accuracy, and it is possible to evaluate accuracy only for those words that are associated with a pen stroke.
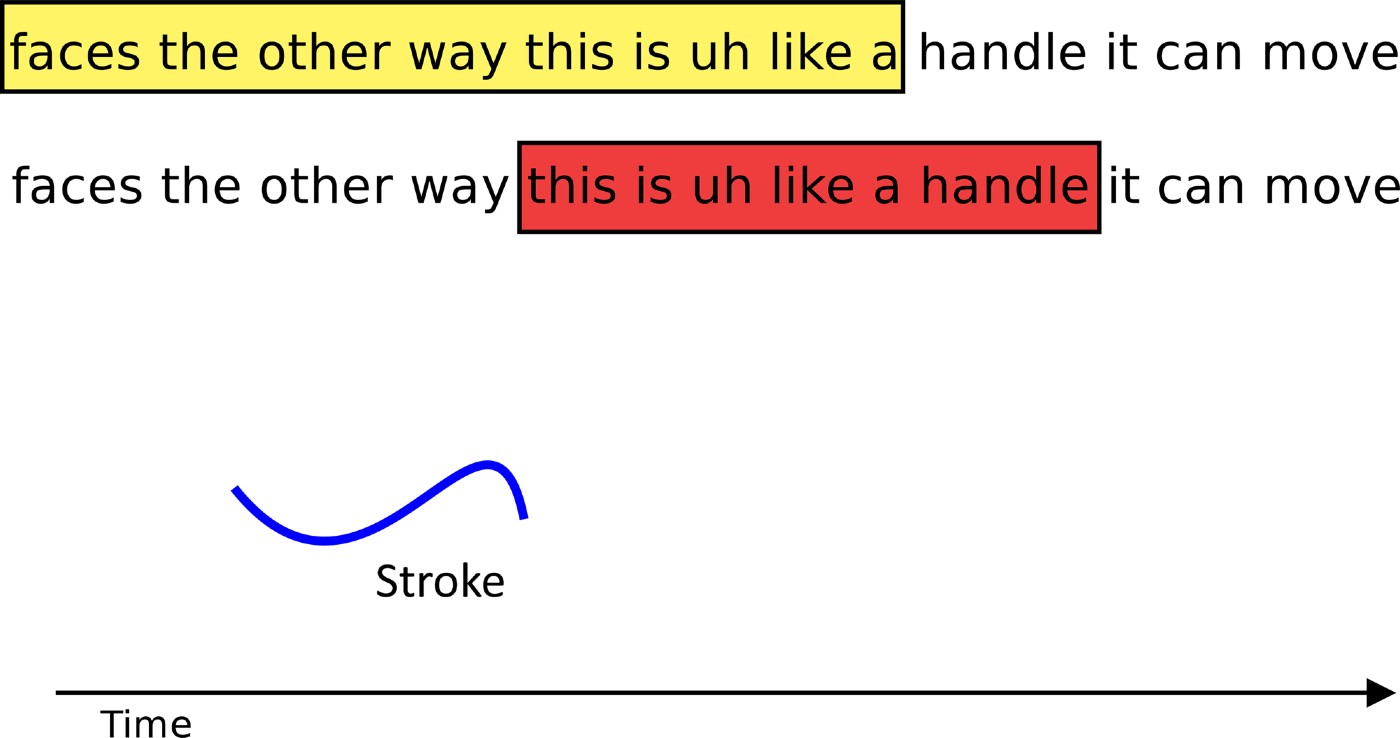
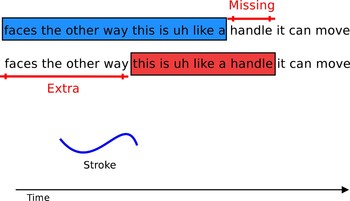
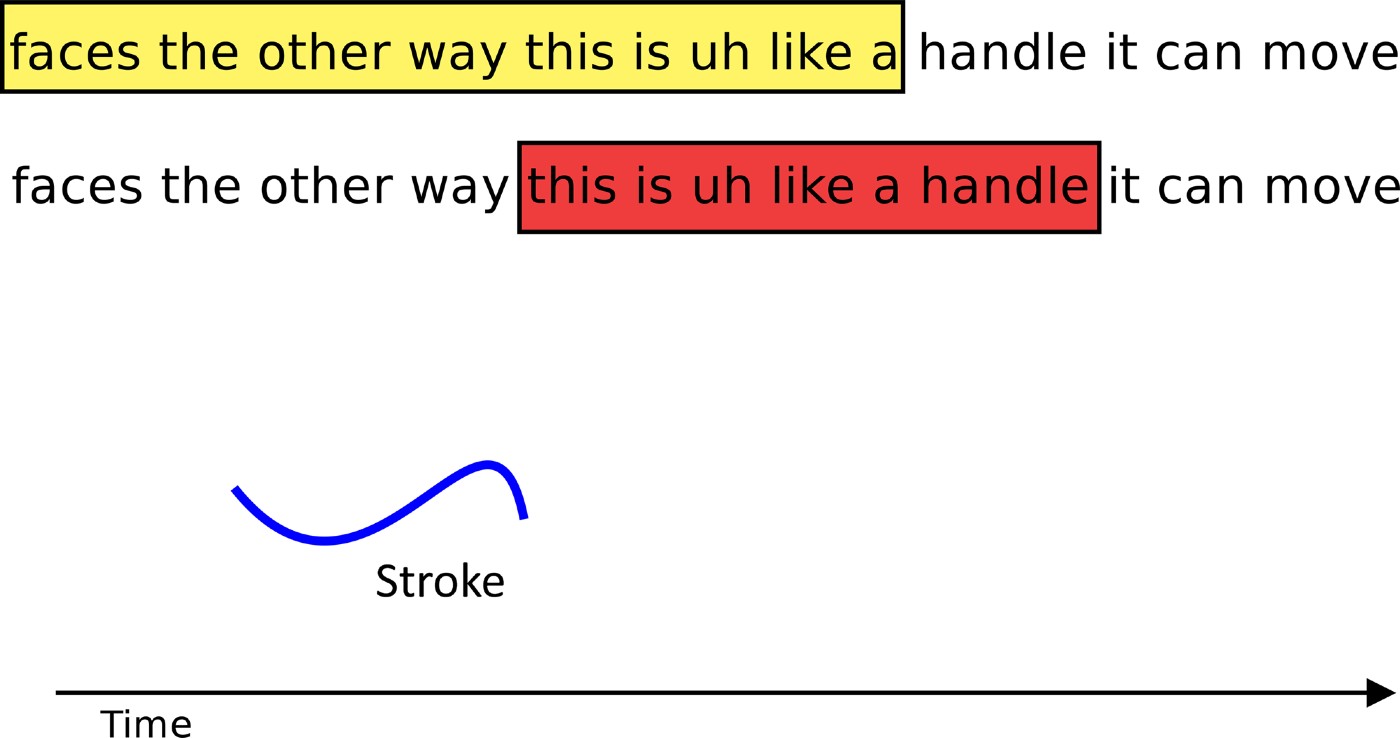
To illustrate the analysis, consider the speech and the accompanying gesture in Figure 5. The 3-sec approach has associated with this stroke the words “faces the other way this is uh like a.” The correct association determined by the manual alignment process is “this is uh like a handle.” In this case the 3-sec association begins too early and does not extend long enough. This situation occurred on average for 6% of the strokes (the average is computed over the 48 sketches).
A gesture pen stroke and the speech associated with it by the 3-sec technique (top bar) and the manual alignment process (bottom bar). [A color version of this figure can be viewed online at journals.cambridge.org/aie]
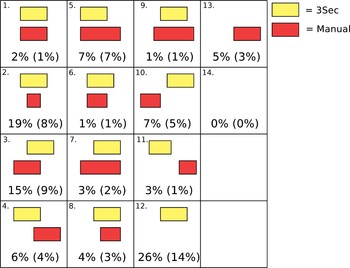
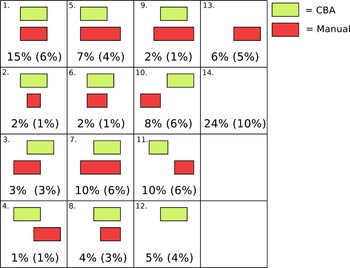
There are a total of 14 possible relative arrangements of the 3-sec association and the correct (manual) association as shown in Figure 6. Each cell in the figure represents one of the possible arrangements. For example, cell 4 represents the arrangement from Figure 5. For clarity, the stroke itself is not represented in the various cells in Figure 6.
The accuracy of the 3-sec technique. In each cell, the top bar represents the speech associated with a stroke by the 3-sec technique, and the bottom bar represents the manual (correct) association. Each cell represents a distinct relative arrangement of the associations and the frequency with which it occurs. The results are averaged over the 48 sketches. Standard deviations are included in parentheses. [A color version of this figure can be viewed online at journals.cambridge.org/aie]

Cases 1 through 11 in Figure 6 are all cases in which the 3-sec approach associates words with strokes that should have associated words. Case 1 is when the 3-sec association exactly matches the correct result. This occurred on average for 2% of the strokes. Cases 2 through 9 are overlapping associations that do not perfectly match. These cases represent on average 56% of the strokes. Cases 10 and 11 are cases in which there is no overlap between the 3-sec association and the correct one. These cases represent on average 10% of the strokes. Case 12 describes strokes that should have no associated speech, but the 3-sec approach has made an association. This occurred on average for 26% of the strokes. Case 13 is the converse case in which there should be associated speech, but the 3-sec approach has associated none. This occurred on average for 5% of the strokes. Finally, case 14 describes situations in which the 3-sec approach has correctly associated no speech with a stroke. This case did not occur. On average, the 3-sec approach achieved the correct answer only 2% of the time (case 1), and 41% of the time the 3-sec association was completely disjoint from the correct result (cases 10–13).
5. IMPROVED SPEECH–SKETCH ALIGNMENT TECHNIQUE: CBA
As Figure 6 illustrates, the 3-sec technique does not accurately align the speech and sketch modalities. Consequently, we sought to develop an improved automatic alignment technique. We modeled the new technique on our manual process: the technique employs an explicit speech segmentation process, followed by a segment–stroke alignment process. Because both processes employ statistical classifiers, we call our alignment technique CBA.
5.1. Speech segmentation
Our approach to automatic segmentation uses a statistical classifier to classify words according to their position in a segment. We consider four classes of words: start, middle, end, and only words. As the names suggest, start and end words represent the start and end of a clause, respectively. All words in a clause other than these are defined as middle words. Only words are segments consisting of a single word, which is typically a filled pause. Figure 7 shows an example of the word classification for a passage of speech.
The classification of the words in a spoken passage; S, start; M, middle; E, end; and O, only. [A color version of this figure can be viewed online at journals.cambridge.org/aie]

The word classifications are used to directly construct the speech segmentation. First, all valid segments are formed. Specifically, each only word is labeled as a segment. Likewise, each sequence of words that begins with a start word, ends with an end word, and has only middle words (if any) in between, is labeled as a segment.
Once all valid segments have been formed, a repair process is used to segment any remaining speech. The first and last words of the speech are always considered start and end words, respectively. Any unsegmented word immediately after a segment is treated as a start word, whereas any unsegmented word immediately before a segment is treated as an end word. A single word directly between two valid segments is considered an only word. After updating the word classifications in this fashion, any new valid segments are formed. The repair process is then repeated until all words have been segmented.
Consider a passage of speech that has been classified as: start, middle, end, middle, middle, end. In the initial segmentation pass, the first three words will be formed into a valid segment. Then, during the repair pass, the fourth word will be treated as a start word so that the last three words form a segment.
Our segmentation approach is based on four word classes. Many speech segmentation approaches such as (Stolcke & Shriberg, Reference Stolcke, Shriberg, Bunnell and Idsardi1996; Stolcke et al., Reference Stolcke, Shriberg, Bates, Ostendorf, Hakkani, Plauche, Tur, Lu, Mannell and Robert-Ribes1998; Gotoh & Renals, Reference Gotoh and Renals2000; Hwan Kim & Woodland, Reference Hwan Kim and Woodland2001) classify interword boundaries as segment events or nonsegment events. These approaches were developed for unimodal dialog such as the SWITCHBOARD corpus (Godfrey et al., Reference Godfrey, Holliman and McDaniel1992). We consider multimodal dialog in which the speech is highly disfluent and filled pauses are common. We designed our four-class approach to take advantage of the discriminatory power of single-word segments. This approach is also consistent with work in Hoffmann et al. (Reference Hoffmann, Kwok and Compton2001) and Luo (Reference Luo2008), suggesting that for some classification problems, decomposing a class into subclasses can result in higher accuracy.
5.1.1. Segmentation classifier and features
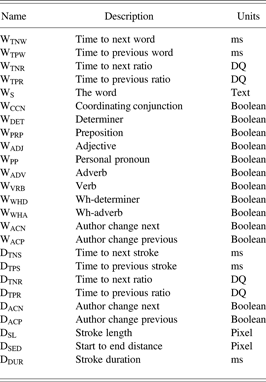
Our segmentation classifier is an Ada-boosted C4.5 decision tree computed with WEKA (Hall et al., Reference Hall, Frank, Holmes, Pfahringer, Reutemann and Witten2009). Each word is characterized by 25 features listed in Table 3. (The classifier considers the features of the word in question, as well as those of the word on either side.) The simplest feature is the word itself (Ws). Each word is also characterized by the parts of speech that it could possibly have in legal English usage, which is queried from the dictionary in the Stanford part of speech tagger (Toutanova & Manning, Reference Toutanova and Manning2000). The rationale for these features is that different parts of speech may be more likely to occur in particular locations within a speech segment. For example, a verb is unlikely to be the first word in a segment. We define nine Boolean part of speech features indicating if the word could be a coordinating conjunction (WCCN), determiner (WDET), preposition (WPRP), adjective (WADJ), personal pronoun (WPP), adverb (WADV), verb (WVRB), wh-determiner (WWHD), or wh-adverb (WWHA). Wh-determiners are the words “what” and “which” used as determiners. Wh-adverbs are the words “how,” “when,” “whence,” “where,” and “why” used as adverbs. Note that we use the possible parts of speech, rather than the actual part of speech, because the latter is difficult to determine because the speech is highly ungrammatical and the sentence boundaries are as yet unknown.
Features for speech segmenter
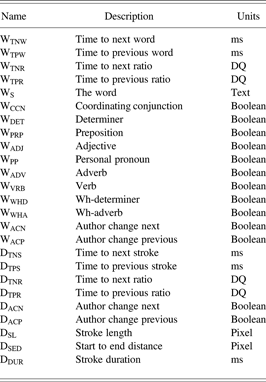
Note: Dx, sketch (drawing) feature; Wx, speech (word) feature; DQ, dimensionless quantity.
Four of the features compute temporal relationships between the words. Here, WTNW and WTPW are the time to the next and previous words, respectively. To obtain a measure of the relative size of the time gap after a word, we compute the ratio of WTNW to the sum of the values of WTNW for the word and its two successors. We call this feature WTNR; WTPR is an analogous feature that concerns the relative size of the gap before the word. A time gap that is large compared to the neighboring gaps (i.e., a large ratio) could indicate a segment boundary.
A change in speaker usually corresponds to a new segment. Thus, two features track changes in the “author” of the speech: WACN is a Boolean feature that is true only when there is an author change immediately after the word; similarly, WACP is true only when there is an author change immediately before the word.
A novel property of our segmentation technique is that we use information from the sketch modality. Specifically, we compute properties of the pen stroke drawn closest in time to the word. We refer to this as the “coincident stroke,” although the word and stroke may not actually overlap in time. We characterize this stroke with three intrinsic properties: its arc length (DSL), start to end distance (DSED), and duration (DDUR). The first two of these features are the same as those used with the gesture/object classifier described in Section 3.1.
Four features describe the temporal relationships between the coincident stroke and the other strokes. These features are analogous to those used to describe the temporal relationships between the words: DTNS and DTPS are the time to the next and previous strokes, respectively. Again, to obtain a measure of the relative size of the time gap after the coincident stroke, we compute the ratio of DTNS to the sum of the values of DTNS for the stroke and its two successors. We call this feature DTNR; DTPR is an analogous feature that concerns the relative size of the time gap before the stroke.
The final two features track changes in the “author” of the pen strokes. Here, DACN is a Boolean feature that is true only when there is an author change immediately after the coincident stroke, and DACP is true only when there is an author change immediately before it.
5.1.2. Segmentation accuracy
We performed leave one out cross-validation to evaluate our speech segmenter.Footnote 2 In each iteration of the cross-validation, the data from all but one sketch was used to train our classifier. We then used the trained classifier to predict the segment boundaries for the remaining sketch. The technique achieved an average accuracy of 92.7% at classifying words as start, middle, end, and only words.
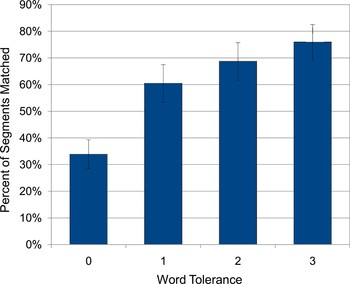
To provide a more informative measure of accuracy, we directly compared our “classifier-based segmentation” with the manual segmentation. Specifically, we computed the fraction of the classifier-based segments that matched the manual segments within a tolerance ranging from zero to three words. The results are shown in Figure 8. On average, about 33.9% of the classifier-based segments exactly matched a manual segment, and about 75.9% matched within three words. In the latter case, the errors could be distributed on both ends of the segment as long as the total number of errors did not exceed three. For example, compared to the manual segment, the classifier-based segmentation could be missing one word at the beginning, and have two extra words at the end, or vice versa.
Percentage of classifier-based segments matching (correct) manual segments within a tolerance. The results are averaged over the 48 sketches. [A color version of this figure can be viewed online at journals.cambridge.org/aie]

5.2. Stroke–speech alignment
Once the speech has been segmented, the next step is to align the segments with the pen strokes. We do this with a two-step process. First, segments are aligned with strokes based on simple temporal correlation. Second, we use a classifier to detect and repair two common alignment errors. The initial alignment borrows from the 3-sec approach. Each stroke is associated with the segment that has the greatest overlap with the stroke's 3-sec temporal window, that is, a window that extends 3 s before and after the stroke.
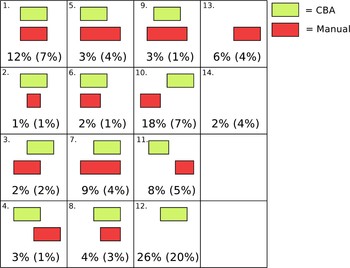
Using an analysis similar to that described in Figures 5 and 6, we computed the accuracy of the initial alignment to determine what improvements are necessary. The results are illustrated in Figure 9. The two most frequent problems are case 10 in which the initial association follows the correct association, and case 12 in which there is an association when there should be none. Case 10 occurs on average for 18% of pen strokes, whereas case 12 occurs for 26%.
The alignment accuracy after the first step of classifier-based alignment (CBA), that is, before the final processing step. In each cell, the top bar represents the speech associated with a stroke by the first step of CBA, and the bottom bar represents the manual (correct) association. Each cell represents a distinct relative arrangement of the associations and the frequency with which it occurs. The results are averaged over the 48 sketches. Standard deviations are included in parentheses. [A color version of this figure can be viewed online at journals.cambridge.org/aie]

Because of the prevalence of these two cases, we developed classifiers to detect them. The two classifiers are applied to each initial association. If a case 10 error is detected, the association of the pen stroke is changed to the next earlier segment. If a case 12 error is detected, the association for the stroke is removed. In this fashion, the classifiers enable an efficient approach to improving the initial alignment.
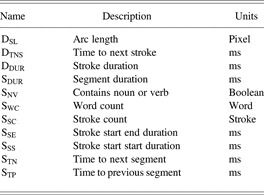
The “case 10” and “case 12” classifiers are Ada-boosted C4.5 decision trees computed with WEKA (Hall et al., Reference Hall, Frank, Holmes, Pfahringer, Reutemann and Witten2009). They consider features of both the speech segment and the initially associated pen stroke. There are a total of 11 features that are listed in Table 4.
Features used for segment–stroke alignment

Note: Dx, sketch (drawing) feature; Sx, feature. To train the case 10 classifier, all of the initial associations in the training set are labeled with a binary value indicating whether they are a case 10 error. An analogous approach is used to train the case 12 classifier.
The number of words in the segment is SWC, and SDUR is its duration; SSC is the number of strokes associated with the segment, and the segment may also initially be associated with other strokes. A Boolean feature indicating if any of the words in the segment were tagged as a noun or verb by the Stanford part of speech tagger is SNV (Toutanova & Manning, Reference Toutanova and Manning2000).Footnote 3 The intuition is that segments containing no nouns or verbs are generally uninformative and are unlikely to refer to a stroke. The initially associated pen stroke is characterized by its arc length (DSL), duration (DDUR), and the time to the next stroke (DTNS).
Four other features describe temporal relationships: STN is the time to the next segment, STP is the time to the previous one, SSE is the time between the start of the segment and the end of the associated stroke, and SSS is the time from the start of the segment to the start of the associated stroke. Both of these features can have positive or negative values.
5.2.1. Stroke–speech alignment accuracy
To evaluate the performance of our two-step segment–stroke alignment technique, we again performed a leave one out cross-validation. In each iteration of the cross-validation, one sketch with speech was used for testing, whereas the others were used for training. We averaged the results across the 48 testing/training combinations.
Figure 10 compares the final alignment to the correct (manual) alignment. The case 10 and case 12 classifiers were clearly effective. The case 10 errors have been reduced from an average of 18% in Figure 9 to an average of only 8%. Likewise, the case 12 errors have been reduced from an average of 26% to an average of only 5%. Overall, after the second step of alignment, an average of 39% of the associations are perfect (cases 1 and 14). Furthermore, on average, only 29% of the associations are completely disjoint from the correct associations (cases 10–13).
The accuracy of the classifier-based alignment (CBA) technique. In each cell, the top bar represents the speech associated with a stroke by CBA, and the bottom bar represents the manual (correct) association. Each cell represents a distinct relative arrangement of the associations and the frequency with which it occurs. The results are averaged over the 48 sketches. Standard deviations are provided in parentheses. [A color version of this figure can be viewed online at journals.cambridge.org/aie]

To provide a more detailed evaluation of the alignment accuracy, we also computed the number of missing and extra words in each association. Extra words are those associated with the pen stroke that should not have been. Conversely, missing words are those that should have been associated but were not. Consider the hypothetical exampleFootnote 4 in Figure 11. The stroke is associated with the words “faces the other way this is uh like a.” The correct association (as determined by manual alignment) is the clause “this is uh like a handle.” In this case, the words “faces the other way” are extra words, and “handle” is a missing word.
Missing and extra words in speech aligned with a pen stroke. The top bar indicates the words actually associated with the pen stroke, and the bottom bar indicates the words that should have been associated. [A color version of this figure can be viewed online at journals.cambridge.org/aie]

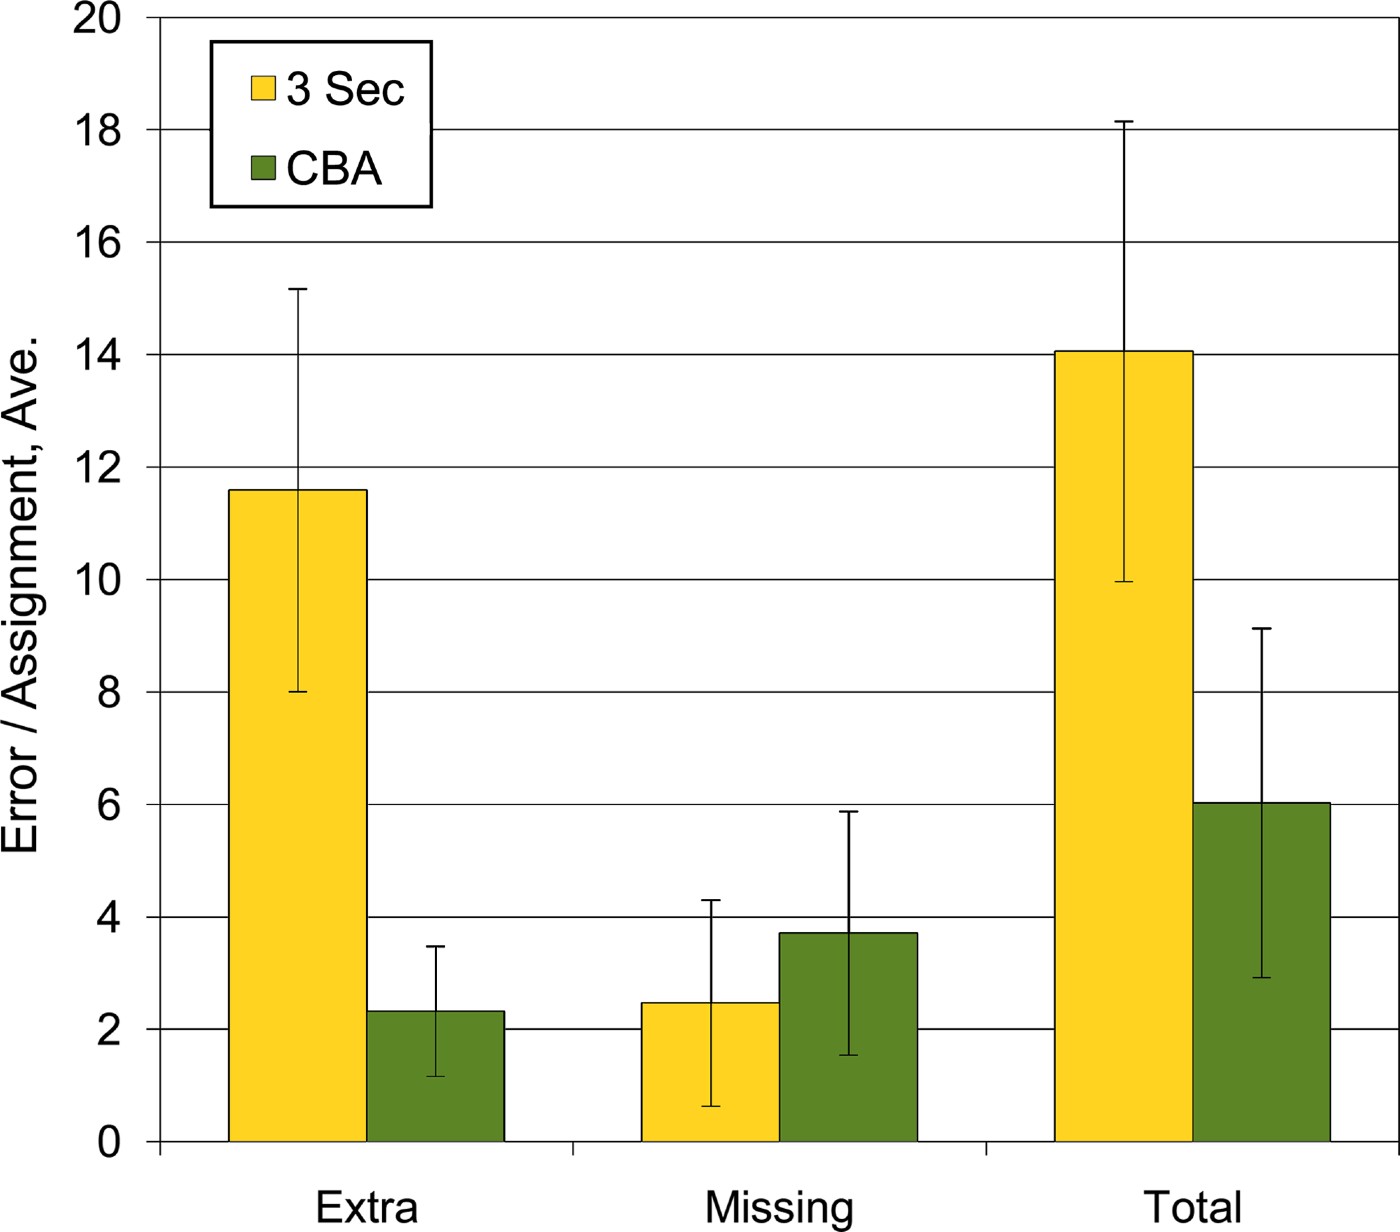
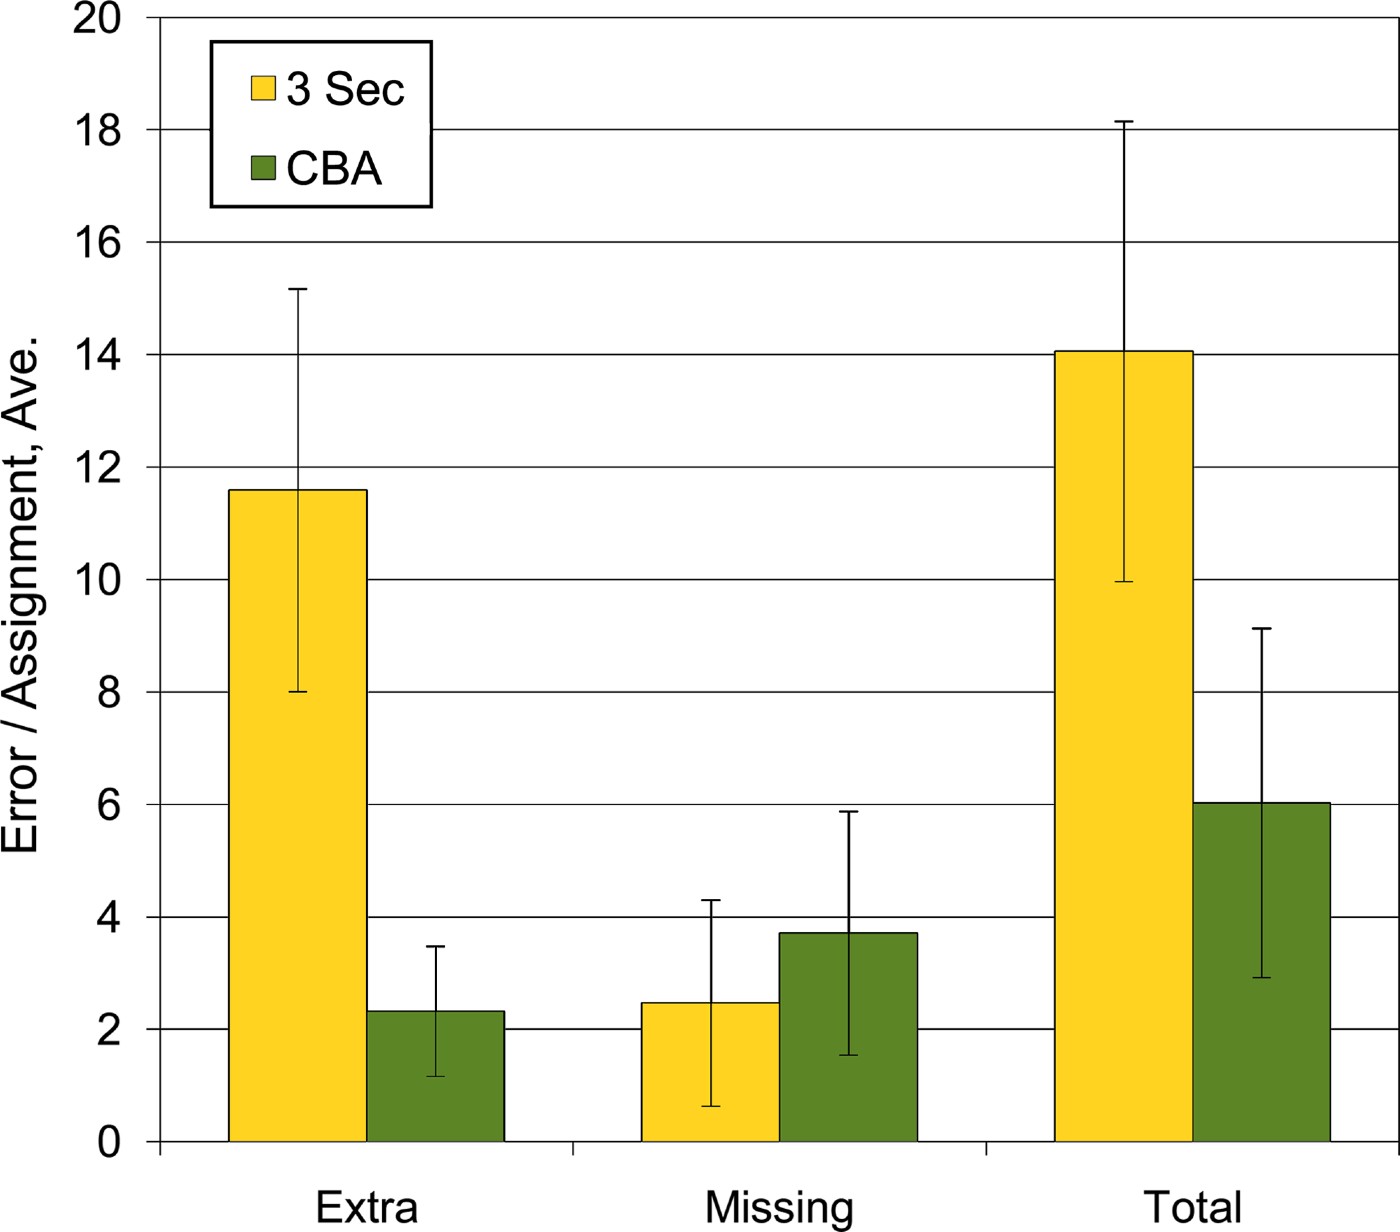
Figure 12 presents the missing/extra accuracy of both the 3-sec and CBA techniques. On average, the 3-sec approach has about 12 extra words and 2 missing words per stroke, while our classifier-based approach has only about 2 extra and 4 missing. Overall, the 3-sec approach has an average of 14 incorrect (missing plus extra) words per stroke, whereas our new approach has only 6. This is a 57% reduction in errors.
The average number of words incorrectly aligned with each stroke for the 3-s and classifier-based alignment techniques. Averages are computed over the 48 sketches. [A color version of this figure can be viewed online at journals.cambridge.org/aie]
6. GESTURE/OBJECT CLASSIFICATION ACCURACY
Our purpose in creating an improved technique for speech–sketch alignment is to enable more accurate identification of gesture pen strokes like those in Figure 1b. Thus, to evaluate our CBA technique, we computed the gesture classification accuracy using our technique and compared this to the accuracy achieved with the 3-sec alignment technique. We also computed the accuracy using manual alignment to obtain an upper bound on the achievable gesture classification accuracy.
For this analysis, we used the gesture classifier just as described in Section 3.1, except that we used an Ada-boosted C4.5 decision tree computed with WEKA (Hall et al., Reference Hall, Frank, Holmes, Pfahringer, Reutemann and Witten2009) rather than using a neural network. The sketch features were computed as before, whereas the speech features were computed using the speech–sketch alignment technique in question.
We computed accuracy via leave one out cross-validation, with one sketch used for testing and the others used for training. Our results are the average across the 48 testing/training combinations. We evaluated classification accuracy for four sets of features: the thesaurus Bayesian filter feature (WTBF), the five most important features, the 10 most important features, and all features. We determined the top 5 and top 10 features using an information gain algorithm (Dash & Liu, Reference Dash and Liu1997; Xing et al., Reference Xing, Jordan and Karp2001) as implemented by WEKA.Footnote 5 The top 5 features include the 2 Bayesian filter features (WTBF, WBF), the total elapsed time (DET), the time to the closest prior stroke (DTCS), and the time to the next stroke (DTNS). The top 10 features in addition include the time to the previous stroke (DTPS), the distance to previous stroke (DDPS), the distance to the next stroke (DDNS), the maximum Hausdorff distance to the underlying ink (DMHD), and the average Hausdorff distance to the underlying ink (DAHD).
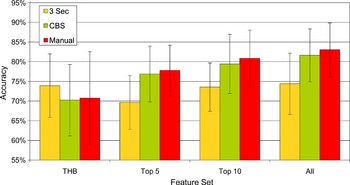
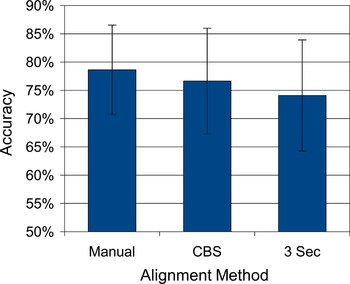
The gesture/object classification results are shown in Figure 13. [The accuracy in Fig. 13 differs from that in Bischel et al. (Reference Bischel, Stahovich, Peterson, Davis and Adler2009) because different classifiers were used, i.e., a neural network vs. Ada-boosted decision tree.] Typically, for a given set of features, the CBA resulted in better accuracy than the 3-sec alignment, and the manual alignment resulted in the best accuracy. Likewise, using more features typically resulted in better accuracy. There was one exception. The 3-sec approach achieved nearly its best accuracy when only the thesaurus Bayesian filter feature was used. For this single-feature case, the 3-sec approach actually achieved better accuracy than even the manual alignment. This is discussed in the next section.
The gesture/object classification accuracy versus speech–sketch alignment technique and number of features; THB, thesaurus Bayesian feature. The results are averaged over the 48 sketches. [A color version of this figure can be viewed online at journals.cambridge.org/aie]

7. DISCUSSION
Our speech segmenter achieved an average accuracy of 92.7% in classifying words as start, middle, end, and only words. Although the classification accuracy is high, a more important measure of accuracy is the segmentation accuracy: on average, 75.9% of the computed segments matched correct (manual) segments within a three-word tolerance.
Liu et al. (Reference Liu, Stolcke, Shriberg and Harper2005) define a per boundary based metric for speech segmentation accuracy. This is defined as the sum of the false positive and false negative sentence boundaries normalized by the total number of interword boundaries. With their state of the art technique based on a conditional random field model, they achieve a boundary-based accuracy of 95.4% on conversational telephone speech. (They achieve higher accuracy on broadcast news thast is more grammatical than telephone conversation.) We achieve 86.8% accuracy on multimodal dialog that includes both speech and sketching. Our results compare favorably with theirs for several reasons. Sentence boundaries occur less frequently in their data than in ours: in their data set only 15.7% of interword boundaries are actually sentence boundaries, whereas in our data set 21.8% are. Thus, a naive classifier would perform better on their data than on ours. In addition, their accuracy is likely to benefit from a greater amount of training data: they trained on 480,000 words, whereas we trained on about 33,000. Finally, we consider different kinds of speech: theirs is unimodal whereas ours is multimodal.
Our speech segmentation approach is unique in that it demonstrates the usefulness of sketch features for locating segment boundaries in multimodal dialog. In addition, we use a single classifier to directly combine word-based, prosodic (pause between words),Footnote 6 and sketch-based features. Unlike many existing approaches (Stolcke & Shriberg, Reference Stolcke, Shriberg, Bunnell and Idsardi1996; Stolcke et al., Reference Stolcke, Shriberg, Bates, Ostendorf, Hakkani, Plauche, Tur, Lu, Mannell and Robert-Ribes1998; Gotoh & Renals, Reference Gotoh and Renals2000; Hwan Kim & Woodland, Reference Hwan Kim and Woodland2001), we use a four-class (start, middle, end, and only) approach to locating segment boundaries. This approach was designed to take advantage of the discriminatory power of single-word segments. In future work, we plan to compare the performance of this approach to that of a more traditional approach in which interword boundaries are classified as either segment boundaries or nonboundaries. In addition, unlike traditional approaches, we do not explicitly consider word sequence: we have no n-gram language model. When processing a given word, our classifier does consider the previous and next words, but we do not use a Markovian approach. In future work, we plan to combine our technique with an explicit language model, but this will likely require a much larger data set. For example, to provide a benchmark for our results, we implemented the technique in Stolcke and Shriberg (Reference Stolcke, Shriberg, Bunnell and Idsardi1996) using a trigram language model. This approach performed poorly on our data: of the hypothesized segment boundaries, on average only 1.3% were true boundaries, whereas for our approach 79% were. It is likely that our corpus containing only about 34,000 words is too small to train the trigram model.
Our classification-based speech–sketch alignment technique performed significantly better than the 3-sec technique as indicated by multiple measures. On average, CBA aligned only 6 incorrect words (missing plus extra) per pen stroke, whereas the 3-sec approach had 14. Comparison of Figures 6 and 10 further illustrates the superiority of the CBA technique. For example, on average, CBA perfectly aligned the speech (cases 1 and 14) for 39% of pen strokes, whereas the 3-sec approach did this for only 2% of strokes. Similarly, for CBA an average of only 29% of the associations were completely disjoint from the correct associations (cases 10–13), whereas for the 3-sec approach 41% were. Likewise, for CBA an average of only 31% of the associations were partially disjoint (cases 3–9), whereas for the 3-sec approach 56% were. Note that for some particular completely or partially disjoint cases, the 3-sec approach did have fewer errors than CBA. However, on the whole, CBA had far fewer completely and partially disjoint cases, and thus overall is significantly more accurate than the 3-sec approach.
Leaving aside the case of the single-feature classifier, the results in Figure 13 support our hypothesis that better speech–sketch alignment leads to better accuracy for classifying pen strokes as gestures or object strokes. Our classification-based alignment technique resulted in much greater accuracy than the 3-sec approach, and performed nearly as well as the manual alignment.
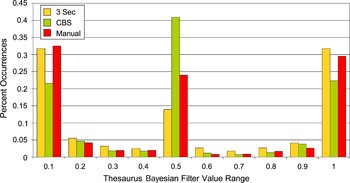
The single-feature case, however, is an interesting anomaly. To understand why the 3-sec alignment technique outperformed even the manual alignment when the classifier used only the thesaurus Bayesian filter feature, we examined the distribution of the values of this feature for the three alignment methods as shown in Figure 14. Comparatively speaking, the 3-sec alignment results in a bimodal distribution in which each stroke is either a gesture (feature value of 1) or not (feature value of 0). The other two methods, by contrast, have a greater percentage of cases with a probability of 0.5, which indicates that a stroke is equally likely to be a gesture or object stroke. Thus, with more accurate alignment, the thesaurus Bayesian filter is able to make predictions about fewer strokes.
Histograms of the values of the thesaurus Bayesian filter feature for different alignment techniques. [A color version of this figure can be viewed online at journals.cambridge.org/aie]

Examining Figure 12 gives some additional insight into this anomaly. The 3-sec alignment technique tends to align many extra words with each pen stroke. These extra words may allow the thesaurus Bayesian filter to make predictions for strokes that do not actually have associated speech. For strokes that do have associated speech, we would expect that better alignment would result in better classification accuracy. To test this hypothesis, we evaluated gesture/object classification accuracy for only those strokes with associated speech as determined by the manual alignment. Here again, we computed accuracy via leave one out cross-validation, with one sketch used for testing and the others used for training. However, in this case only strokes with associated speech were included in the testing and training sets.
The results are shown in Figure 15. For strokes with associated speech, improved alignment does result in improved accuracy, even when only the thesaurus Bayesian filter is used. It appears that the overassociation of words by the 3-sec approach is useful when only speech is used for gesture/object classification. However, the benefit is quickly lost as additional features are used. Apparently, the noise introduced by overalignment degrades the performance of the other features.
The gesture/object classification accuracy for strokes known to have associated speech. Classification is based on only the thesaurus Bayesian filter feature. [A color version of this figure can be viewed online at journals.cambridge.org/aie]

Currently, our system is designed to be applied once the device description has been completed. An important next step will be to adapt our system to work in real time so that strokes are classified as they are drawn. All of the features used for the various classifiers can be computed on the fly as they depend only on prior information. Thus, the primary challenge in creating a real-time system will be the problem of automatic speech recognition. The state of the art Sphinx-4 speech recognition system (Walker et al., Reference Walker, Lamere, Kwok, Raj, Singh, Gouvea, Wolf and Woelfel2004) achieves a word error rate of 7% with a vocabulary of 5000 words and a word error rate of 19% with a vocabulary of 60,000 words. The errors inherent in automatic speech recognition will clearly present challenges. However, we may be able to compensate for these errors by using additional prosodic features (we currently use only pause duration).
We evaluated our techniques using a nearly user-independent approach. The training data used when testing on a particular sketch was comprised of 44 sketches by other authors, and only three sketches from the primary author of the test sketch. It is likely that increasing the amount of user-specific training data will increase the accuracy of the system. Such training data has proven beneficial for other recognition tasks, such as hand-drawn symbol recognition (Field et al., Reference Field, Gordon, Peterson, Robinson, Stahovich and Alvarado2010).
We have developed our techniques within the domain of collaborative engineering design, but they should generalize to many other domains. None of the features used by our classifiers are specific to mechanical devices or the task of designing; thus, we believe our techniques should be suitable for any domain in which the task involves drawing a sketch or diagram and explaining its elements. Examples of such domains include giving driving directions, explaining the solution to a problem in a physics lecture, and explaining a sports play.
8. CONCLUSION
We have presented a new technique for aligning speech and sketch input in multimodal dialog. It is designed for use in classifying pen strokes as gesture and object strokes. The technique, which we call CBA, employs a two-step process: the speech is first segmented into meaningful pieces (typically clauses), then the segments are aligned with pen strokes. Our speech segmenter uses a statistical classifier to classify words according to their position in a segment. We consider four classes of words: start, middle, end, and only words. The word classifications are then used to form speech segments. The segment-stroke alignment step initially uses temporal correlation to align segments with pen strokes. Classifiers are then used to detect and correct two common alignment errors.
Our classification-based speech–sketch alignment technique performed significantly better than the existing “3-sec” alignment technique, which is based solely on temporal correlation and has no explicit segmentation step. On average, our technique perfectly aligned the speech for 39% of pen strokes, whereas the 3-sec technique did this for only 2% of strokes. Furthermore, for our technique the aligned speech had no overlap with the correct alignment, on average, for only 29% of strokes. However, for the 3-sec technique there was no overlap for 41% of strokes. Finally, our technique had on average only six incorrectly aligned words (missing plus extra) per pen stroke, whereas the 3-sec approach had 14.
Our alignment technique is novel in that it uses information from the sketch modality for both the speech segmentation and alignment steps. Our results demonstrate that features from the sketch input are valuable for segmenting speech.
Our purpose in developing an effective speech–sketch alignment technique was to enable accurate identification of gesture pen strokes in multimodal dialog. Our gesture classifier uses features of the pen strokes and the speech aligned with them. Experiments with this classifier demonstrated that, when multiple speech and sketch features are used for classification, better alignment accuracy does lead to more accurate gesture classification. More precisely, when multiple features are used, our alignment technique resulted in much greater gesture classification accuracy than the 3-sec approach, and performed nearly as well as manual alignment. Inaccurate alignment was beneficial only when the gesture classifier used just a single statistical speech feature. In this case, the tendency of the 3-sec alignment technique to erroneously associate extra words with pen strokes allowed the gesture classifier to make predictions about pen strokes that in reality had no associated speech. Thus, in all but one unusual case, our new alignment technique enables substantially more accurate gesture classification than the prior technique.
ACKNOWLEDGMENTS
This material is based upon work supported by the National Science Foundation under Grant 0729422. The authors are grateful to Matthew Ung for his assistance in segmenting and aligning the data.
James Herold earned his BS in computer science at California Polytechnic State University, Pomona, in 2004. Jim is currently a PhD student in computer science at the University of California, Riverside.
Thomas F. Stahovich received his BS in mechanical engineering from the University of California, Berkeley, in 1988. He received his MS and PhD from MIT in 1990 and 1995, respectively. He conducted his doctoral research at the MIT Artificial Intelligence Lab. After serving as an Assistant and Associate Professor of mechanical engineering at Carnegie Mellon University in Pittsburgh, PA, Dr. Stahovich joined the Mechanical Engineering Department at University of California, Riverside, in 2003, where he is currently a Professor and Chair. His research interests include pen-based computing, educational technology, design automation, and design rationale management.