Introduction
Many investigators have concluded that generalized slowing in information processing speed is the primary cognitive deficit associated with MS (Archibald & Fisk, Reference Archibald and Fisk2000; Bergendal, Fredrikson, & Almkvist, Reference Bergendal, Fredrikson and Almkvist2007; de Sonneville et al., Reference de Sonneville, Boringa, Reuling, Lazeron, Adèr and Polman2002; DeLuca, Chelune, Tulsky, Lengenfelder, & Chiaravalloti, Reference DeLuca, Chelune, Tulsky, Lengenfelder and Chiaravalloti2004; Demaree, DeLuca, Gaudino, & Diamond, Reference Demaree, DeLuca, Gaudino and Diamond1999; Denney & Lynch, Reference Denney and Lynch2009; Kail, Reference Kail1997, Reference Kail1998; Kujala, Portin, Revonsuo, & Ruutiainen, Reference Kujala, Portin, Revonsuo and Ruutiainen1994; Lengenfelder et al., Reference Lengenfelder, Bryant, Diamond, Kalmar, Moor and DeLuca2006; Macniven et al., Reference Macniven, Davis, Ho, Bradshaw, Szabadi and Constantinescu2008; Reicker, Tombaugh, Walker, & Freedman, Reference Reicker, Tombaugh, Walker and Freedman2007). This conclusion is bolstered not only by the consistency with which cognitive slowing is demonstrated in MS samples across an assortment of neuropsychological measures (e.g., Denney, Gallagher, & Lynch, Reference Denney, Gallagher and Lynch2011), but also by the emergence of this deficit early in the course of the disease (Bergendal et al., Reference Bergendal, Fredrikson and Almkvist2007; Bodling, Denney, & Lynch, Reference Bodling, Denney and Lynch2009; DeLuca et al., Reference DeLuca, Chelune, Tulsky, Lengenfelder and Chiaravalloti2004; Schulz, Kopp, Kunkel, & Faiss, Reference Schulz, Kopp, Kunkel and Faiss2006).
One obvious approach to assessing processing speed is through reaction time (RT) measures. Studies that have reported differences between MS patients and controls have used not only the usual variations on simple and choice RT tests (de Sonneville et al., Reference de Sonneville, Boringa, Reuling, Lazeron, Adèr and Polman2002; Elsass & Zeeburg, Reference Elsass and Zeeberg1983; Kujala et al., Reference Kujala, Portin, Revonsuo and Ruutiainen1994; Laatu, Revonsuo, Hamalainen, Ojanen, & Ruutiainen, Reference Laatu, Revonsuo, Hamalainen, Ojanen and Ruutiainen2001; Reicker et al., Reference Reicker, Tombaugh, Walker and Freedman2007; Tombaugh, Berrigan, Walker, & Freedman, Reference Tombaugh, Berrigan, Walker and Freedman2010), but also some n-back procedures that assess RT on each item (Bodling, Denney, & Lynch, Reference Bodling, Denney and Lynch2010; Parmenter, Shucard, & Shucard, Reference Parmenter, Shucard and Shucard2007; Parmenter, Shucard, Benedict, & Shucard, Reference Parmenter, Shucard, Benedict and Shucard2006). These measures evaluate processing speed under varied levels of cognitive load, as for example, the Computerized Tests of Information Processing (CTIP; Tombaugh & Rees, Reference Tombaugh and Rees2008), which uses simple, choice, and semantic RT subtests. The notion underlying this practice is referred to as the “complexity effect” (Parmenter, Shucard, et al., Reference Parmenter, Shucard and Shucard2007; Reicker et al., Reference Reicker, Tombaugh, Walker and Freedman2007): as the burden on working memory becomes greater, the tasks become more sensitive to differences between MS patients and controls, leading to greater divergence in the groups’ performance.
Tests using a rapid serial processing (RSP) format have been used much more frequently for assessing processing speed in conjunction with MS. In these tests, which primarily include the Paced Auditory Serial Addition Test (PASAT: DeLuca, Johnson, & Natelson, Reference DeLuca, Johnson and Natelson1993; Paul, Beatty, Schneider, Blanco, & Hames, Reference Paul, Beatty, Schneider, Blanco and Hames1998), the Symbol Digit Modalities Test (SDMT: Parmenter, Weinstock-Guttman, Garg, Munschauer, & Benedict, Reference Parmenter, Weinstock-Guttman, Garg, Munschauer and Benedict2007; Paul et al., Reference Paul, Beatty, Schneider, Blanco and Hames1998), and the Stroop Test (Denney & Lynch, Reference Denney and Lynch2009; Macniven et al., Reference Macniven, Davis, Ho, Bradshaw, Szabadi and Constantinescu2008; Pujol et al., Reference Pujol, Vendrell, Deus, Junque, Bello, Marti-Vilalta and Capdevila2001), items appear sequentially with little or no variation in the operation to be performed on each item. The operation itself is typically not very difficult, but must be executed quickly, requiring the participant to complete as many items as possible in some allotted period of time.
Although previous studies have compared MS patients’ performance on the PASAT and either the SDMT (Brochet et al., Reference Brochet, Deloire, Bonnet, Salort-Campana, Quallet, Petry and Dousset2008; Drake et al., Reference Drake, Weinstock-Guttman, Morrow, Hojnacki, Munshauer and Benedict2010; Forn, Belenguer, Parcet-Ibars, & Avila, Reference Forn, Belenguer, Parcet-Ibars and Avila2008) or the Stroop (Lynch, Dickerson, & Denney, Reference Lynch, Dickerson and Denney2010), there are no comparisons between the SDMT and the Stroop, or more generally, between RT and RSP formatted measures of processing speed, except for a recent study (Tombaugh et al., Reference Tombaugh, Berrigan, Walker and Freedman2010) indicating somewhat better sensitivity for the CTIP. The present study was designed to provide these comparisons. The RT measure used here was similar to the CTIP, but included two variations of the semantic RT subtest to further expand the cognitive load imposed upon participants. The RSP tasks for the present study were the SDMT and the Stroop. Both exemplify the RSP format well and have been used in much of the recent research concerning information processing speed in MS. Although the PASAT is the most widely used RSP measure, it was excluded because performance on this test is clearly influenced by a complicated array of factors beyond information processing speed (Tombaugh, Reference Tombaugh2006), and because previous comparisons have shown both the SDMT (Drake et al., Reference Drake, Weinstock-Guttman, Morrow, Hojnacki, Munshauer and Benedict2010) and the Stroop (Lynch et al., Reference Lynch, Dickerson and Denney2010) to be at least as effective as the PASAT in distinguishing between MS patients and controls. Also, many individuals find the experience of completing the PASAT to be distressing (Holdwick & Wingenfeld, Reference Holdwick and Wingenfeld1999; McCaffrey et al., Reference McCaffrey, Cousins, Westervelt, Martynowicz, Remick, Szebenyi and Haase1995; Parmenter et al., Reference Parmenter, Shucard, Benedict and Shucard2006), in some instances affecting their willingness to participate in studies using the test.
In contrast to the complexity effect, the notion underlying RSP tests is what we have here chosen to term the “compounding effect.” Metaphorically, the compounding effect can be envisioned by considering the difference between a step and a journey. RT tests provide an averaged measure of the time required to perform a single information processing operation; the focus is on the time required for this single step. RSP measures instead focus on the number of steps successfully executed in an overall time allotted to the journey. In these measures, the diminished processing speed in MS patients on each item is compounded by the necessity of having to quickly execute the same information processing operation numerous times over the course of the period. Since the score on such measures is the overall number of items successfully completed in the allotted period, small differences between participants on individual items are compounded across the overall period. Because of this compounding effect, we predicted that the RSP measures would more effectively distinguish MS patients from controls than the RT measures.
Whereas the compounding effect distinguished RSP from RT measures, a further distinction may be drawn among RSP measures that we will term the “augmentation effect.” The prediction regarding the comparison between the Stroop and the SDMT in the present study is founded upon this effect. MS studies typically use a computerized version of the Stroop Test (Denney & Lynch, Reference Denney and Lynch2009; Macniven et al., Reference Macniven, Davis, Ho, Bradshaw, Szabadi and Constantinescu2008). Stimulus items appear individually in the center of the computer screen, the subject responds to the item (i.e., reads the word or names the color), and the next item is presented. The paper-based version of the Stroop in which all of the stimulus items are presented together on a single page, has been characterized as a “cluttered field” (Salo, Henik, & Robertson, Reference Salo, Henik and Robertson2001) and may negatively impact participants’ scores due to distraction and scanning difficulties. The computerized version of the Stroop was designed to avoid these difficulties. On the other hand, the SDMT is a paper-based test that conforms to the cluttered field presentation, and indeed increases the burden on accurate scanning further by the necessity of checking a reference key and then returning to the appropriate place among the stimulus items. When additional factors such as these are a further source of difference, they can “augment” a measure's ability to distinguish patients and controls. Since this is likely the case for at least some MS patients, the cluttered field presentation of the SDMT was expected to magnify the contrast between patients and controls relative to that achieved with the Stroop.
The present study was designed to compared MS patients and healthy controls on a variety of RT and RSP measures to examine the relative efficacy of these measures in conjunction with complexity, compounding, and augmentation effects.
Method
Participants
Fifty patients with clinically definite MS (Poser et al., Reference Poser, Paty, Scheinberg, McDonald, Davis, Ebers and Tourtellotte1983) and 40 healthy controls were recruited for this study. All patients were diagnosed with relapsing-remitting or secondary progressive MS at least 1 year before recruitment and were under the care of the same neurologist at a university medical center. Disability ratings on the Expanded Disability Status Scale (EDSS; Kurtzke, Reference Kurtzke1983) ranged from 0 to 8.5 (Mdn = 3.0), and disease durations ranged from 1 to 38 years (M = 10.1). Exclusionary criteria for the patients were: neurological disorder other than MS; history of drug or alcohol abuse, premorbid psychological disorder, mental retardation, or head injury; current use of stimulants, narcotics, or benzodiazepines; visual acuity greater than 20/50 (corrected) or impaired color vision; symptomatic involvement (e.g., numbness, paraesthesia, paralysis) of the hands; MS relapse within the past 30 days; or cognitive impairment of sufficient severity to interfere with comprehension of testing instructions. The same criteria were applied to healthy controls. In addition, controls were excluded if they had any chronic medical condition or were taking any medications with the exceptions of vitamin/mineral supplements, birth control, and low-dose aspirin. Patients ranged in age from 22 to 64 (M = 44.8) and had between 12 and 19 years of education (M = 15.1). Controls ranged between 22 and 62 (M = 42.6) and had between 12 and 20 years of education (M = 16.4).
Measures
Reaction time tests
Three computerized tests similar to those comprising the CTIP (Tombaugh & Rees, Reference Tombaugh and Rees2008) were designed for the current study. Each test began with 5 practice trials followed by 15 test trials for the first and second tests and 30 tests trials for the third.
Simple RT (SRT)
Participants were instructed to press the space bar as quickly as possible with their preferred hand when a target stimulus appeared on the computer screen. A warning stimulus (three circles) was first presented in the center of the screen, and then replaced by the target stimulus (a plus sign). A randomly ordered sequence of five inter-stimulus intervals (ISIs: 1000 ms, 2000 ms, 2500 ms, 3000 ms, and 4000 ms) was used between the warning and target; the same sequence was used for all participants. The computer recorded RTs for each test trial and computed the mean RT for these trials.
Choice RT (CRT)
In this test, participants were first presented with two warning stimuli (circles) appearing on the left and right side of the screen. After an ISI, the target stimulus (plus sign) replaced one of the circles. Participants were instructed to press one of two keys, using the index finger of each hand, according to whether the target replaced the left or right circle. Another randomly ordered sequence of the same five ISIs used for the SRT was devised for the CRT and used for all participants. The computer recorded RTs for each trial and whether the response was correct or incorrect. Mean RTs were computed for all trials and for correct trials.
Semantic RT (SemRT)
In this test, participants had to decide which of two words belonged to a specified semantic category. The category name (e.g., “FURNITURE”) first appeared in the middle of the screen. After an ISI, two target words appeared side by side below the category name. One target constituted a member of the category (e.g., “CHAIR”); the other did not (e.g., “BANANA”). Participants were instructed to press one of two keys according to whether the word belonging to the category appeared on the left or right. Fifteen of the trials consisted of “unrelated” targets—as in the above example. In the other 15 trials, the two target words were “related” to each other (e.g., category – “TOOL”; correct target – “AXE”; incorrect target – “TREE”). ISIs were randomized as in the other RT tests. Likewise, a randomized sequence of related and unrelated trials was devised and used for all participants. The computer recorded RTs for each trial and whether the response was correct or incorrect. Mean RTs for all trials and for correct trials were computed for both the unrelated and related items.
Rapid Serial Processing Tests
Stroop test
This computerized version of the Stroop Color-Word Interference Test developed by Golden (Reference Golden1978) consisted of three 60-s trials, each preceded by an eight-item practice session. In the first trial (word reading, W), participants read color words (RED, BLUE, YELLOW, GREEN); in the second trial (color naming, C), they named the color of a row of four Xs; and in the third trial (color-word naming, S), they named the color of the print for a set of Stroop stimuli in which the word and color were incongruent (e.g., BLUE printed with red letters). In each trial, the stimulus appeared in the center of the computer screen, the participant gave a verbal response and then immediately pressed the space bar to display the next stimulus. The computer timed the trial and recorded the number of items completed during the allotted time. The experimenter recorded the number of correct items completed during the trial.
Along with the scores for each trial (W, C, and S), the relative interference score (RI) was also computed. Denney and Lynch (Reference Denney and Lynch2009) demonstrated the superiority of relative interference scores over simple difference scores (i.e., C – S) commonly used to measure interference
Symbol digit modalities test
The items of this test (Hinton-Bayre & Geffen, Reference Hinton-Bayre and Geffen2005; Smith, Reference Smith1982) consisted of geometric symbols arranged in rows across the printed test form. A reference key at the top of the form showed the nine geometric symbols used on the test and the corresponding digit associated with each symbol. Participants were instructed to verbally report the digit corresponding to each of the geometric symbols appearing along the rows of the test. proceeding from left to right down the page. The SDMT consisted of 10 practice items, followed by a single 90-s trial. The experimenter recorded both the total number of items and the number of correct items completed during the trial.
Other Measures
Participants also completed the North American Adult Reading Test (AmNART; Nelson, Reference Nelson1982) to provide an estimate of their premorbid intellectual ability. Levels of fatigue and depression during the preceding week were also assessed using the Fatigue Severity Scale (FSS; Krupp, LaRocca, Muir-Nash, & Steinberg, Reference Krupp, LaRocca, Muir-Nash and Steinberg1989) and the Center for Epidemiologic Studies – Depression Scale (CES-D; Radloff, Reference Radloff1977).
Procedure
This study was approved by the Human Subjects Committee at the University of Kansas Medical Center. Eligible MS patients were introduced to the study during the course of their regular appointments in the MS Clinic. If the patient consented to the study, the neurologist assessed the patient's current disability status with the EDSS during the course of the appointment, and the research assistant proceeded with cognitive testing following the appointment. Controls were recruited from the surrounding metropolitan area.
Testing sessions lasted 40–45 min and consisted of the AmNart, FSS, and CES-D, followed by the cognitive tests. The three reaction time tests were administered in a fixed sequence (SRT, CRT, and SemRT). The order of administration for the RT versus the RSP measures as well as for the two RSP measures was counterbalanced across participants.
Results
All 40 healthy adults completed the study; however, 8 of the 50 patients withdrew between consent procedures and cognitive testing, primarily due to time constraints that interfered with scheduling. These patients did not differ significantly from the 42 patients who completed the study in terms of demographic or disease-related variables.
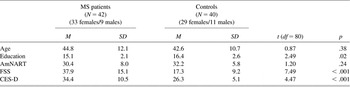
Patients and controls who completed the study did not differ in gender (p = .52), age, or estimated premorbid mental ability based on the AmNart; however, patents had lower education ratings and higher scores on both fatigue and depression (Table 1). To examine whether these latter differences impacted the outcome of the study, analyses of the cognitive variables were initially performed with education, fatigue, and depression scores entered as covariates. Education and fatigue never emerged as significant covariates, and depression was significant in the case of only one cognitive variable (SemRT). When the analyses were repeated without the covariates, the results were essentially unchanged. These unadjusted results are reported throughout this study.
Demographic and self-report characteristics of patient and controls groups

Note. MS = multiple sclerosis; AmNART = North American Adult Reading Test; FSS = Fatigue Severity Scale; CES-D = Center for Epidemiologic Studies – Depression Scale.
Rapid Serial Processing Tests
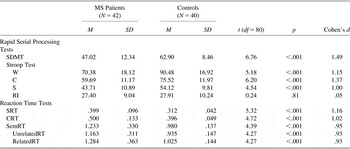
The upper portion of Table 2 compares the performance of patients and controls on the SDMT and on the scores derived from the Stroop. Scores reported in the table are based on the number of correct items completed on each test or subtest. Because errors occurred very infrequently (averaging <1.5 per patient and <1 per control on each test), results are virtually the same when the groups are compared on the total number of items completed instead of the number correct.
Comparison of MS patients and healthy controls on cognitive measures

Note. MS = multiple sclerosis; SDMT = Symbol Digit Modalities Test; W = word reading; C = color naming; S = color-word naming; RI = relative interference score; RT = reaction time; SRT = simple RT; CRT = choice RT; SemRT = semantic RT.
Patients had significantly lower scores on the SDMT and on each of the processing speed measures from the Stroop Test. All the effect sizes (Cohen's d; Table 2) are large, although the effect size for the scores on the third trial of the Stroop (S) are somewhat lower than those for the two preliminary trials (W and C). Virtually no difference was found on relative interference, the one measure that effectively corrects for processing speed.
Reaction Time Tests
Individual RTs for the items comprising each reaction time test were examined for outliers. Extremely fast responses (<150 ms) that likely reflected anticipatory responding or accidental button presses were removed from the data. Extremely slow responses were also identified using the same procedure used by other investigators (de Frias, Dixon, Fisher, & Camicioli, Reference de Frias, Dixon, Fisher and Camicioli2007; Hultsch, MacDonald, Hunter, Levy-Bencheton, & Strauss, Reference Hultsch, MacDonald, Hunter, Levy-Bencheton and Strauss2000). Eliminated responses were replaced with interpolated values determined through linear regression. Percentages of eliminated responses were small relative to the total number of reaction times in the data set (MS: SRT-1.1%, CRT-3.3%, SemRT-1.9%; Control: SRT-1.7%, CRT-1.0%, SemRT-1.5%), and were comparable to those reported in prior studies (de Frias et al., Reference de Frias, Dixon, Fisher and Camicioli2007; Hultsch et al., Reference Hultsch, MacDonald, Hunter, Levy-Bencheton and Strauss2000).
The lower portion of Table 2 presents mean RTs for patients and controls on each reaction time test. No errors occurred on the CRT, and they occurred very rarely on the SemRT (averaging <0.3 items per patient and < 0.5 items per control). Between-group comparisons using reaction times for correct items or for all items on the SemRT yielded virtually the same results. To be consistent with the RSP measures, reaction times for correct items are reported in the table.
Patients exhibited significantly longer reaction times on the SRT and CRT and on both the unrelated and related items comprising the SemRT. The effect sizes for these RT measures are large, although somewhat smaller numerically than those for the RSP measures, ranging from .93 (for unrelated or related items on the SemRT) to 1.16 (SRT).
Cognitive Load
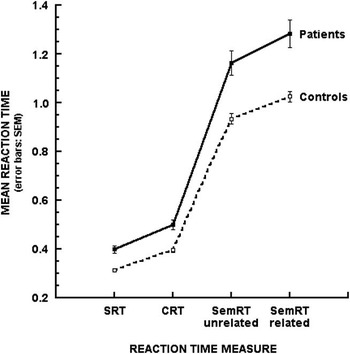
The RT tests, including the unrelated and related items within the SemRT, pose different amounts of cognitive load. To assess the impact of cognitive load, a 2 (Group) × 4 (Load) repeated measures analysis of variance was conducted. The analysis revealed significantly longer RTs for patients than controls across all four measures (F(1,80) = 23.09; p < .001; η 2 = .22) and progressively longer RTs for all participants as the tasks increased in cognitive load (F(3,78) = 330.17; p < .001; η 2 = .93). However, the complexity effect is reflected in the significant Group X Load interaction (F(3,78) = 3.74; p < .014; η 2 = .13). As shown in Figure 1, this interaction came about because patients’ RTs diverged from those of controls to a greater extent as cognitive load increased.
Mean reaction times (sec) for multiple sclerosis (MS) patients and controls under various levels of cognitive load. SRT = simple reaction time; CRT = choice reaction time; semRT = semantic reaction time (with unrelated or related target word choices).

Comparison of RSP versus RT Measures
Two binary logistic regression analyses were used to compare the contributions of information processing speed measures derived from the RSP tests with those derived from the RT tests in terms of distinguishing patient and control groups. In both analyses, group membership served as the dichotomous criterion variable, the healthy controls coded as the reference group. In the first analysis, scores from the SDMT and from the word reading (W) and color-naming (C) trials of the Stroop were entered in the first block of predictors and means RT scores for the SRT and CRT tests and for both the unrelated and related items of the SemRT test were entered in the second block. In the second analysis, the order of the two blocks was reversed.
The overall model with both blocks of predictors entered was highly significant (χ2 = 54.7; df = 7; p < .001; Nagelkerke R 2 = .65), accurately classifying 35 of the 42 patients (83.3%) and 34 of the 40 controls (85.0%) for an overall accuracy of 84.1%. The scores based on RSP tests made a significant contribution toward distinguishing patients from controls regardless of whether they were entered as the first block (χ2 = 47.1; df = 3; p < .001) or the second (χ2 = 23.7; df = 3; p < .001). On the other hand, the scores derived from the RT tests only made a significant contribution toward distinguishing these two groups when entered as the first block (χ2 = 31.0; df = 4; p < .001), and not the second (χ2 = 7.7; df = 4; p = .104).
Comparison of Stroop vs. SDMT Scores
Similar to the preceding section, the contributions of information processing speed variables derives from the SDMT and the preliminary trials of the Stroop were compared using complementary binary logistic regression analyses, with group membership serving as the criterion variable. In the first analysis, the SDMT scores were entered in the first block and the W and C scores from the Stroop were entered in the second block. In the second analysis the order of entry was reversed.
The overall model was again highly significant (χ2 = 47.1; df = 3; p < .001, Nagelkerke R 2 = .58), accurately classifying 34 of the 42 patients (81.0%) and 32 of the 40 controls (80.0%) for an overall accuracy of 80.5%. The SDMT scores significantly predicted group membership regardless of whether they were entered as the first block (χ2 = 41.4; df = 1; p < .001) or the second (χ2 = 13.8; df = 1; p < .001). The Stroop scores only made a significant contribution toward distinguishing the two groups when entered as the first block (χ2 = 33.2; df = 2; p < .001), not the second (χ2 = 5.6; df = 2; p = .06).
Correlations
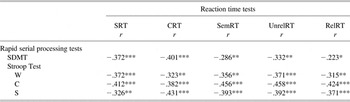
Pearson correlations between processing speed measures derived from the RSP tests and those from the RT tests are shown in Table 3. The reported correlations were arrived at by averaging the correlation for the patient group with that of the control group, using Fisher's z transformation procedure. All measures pertaining to processing speed were significantly correlated both within and between the two testing formats.
Correlations between rapid serial processing and reaction time measures

Note. SDMT = Symbol Digit Modalities Test; RT = reaction time; SRT = simple RT; CRT = choice RT; SemRT = semantic RT; UnrelRT = unrelated RT; RelRT = related RT; W = word reading; C = color naming; S = color-word naming.
*p < .05.
**p < .01.
***p < .001.
The derivation of the relative interference score on the Stroop Test renders it independent of processing speed and thus, unrelated to the processing speed scores—with one exception: Relative interference was correlated with the scores on the SDMT. This was particularly true for the patient group (r = −.60; p < .001), suggesting that performance on the SDMT may be affected by factors other than processing speed alone.
Spearman correlations between patients’ processing speed scores and their disability level based on the EDSS ranged from .39 to .52 on the RT tests, and from −.45 to −.54 on the Stroop (all ps < .01). Compared to all other scores, the SDMT score was most highly related to disability status (r s = −.72; p < .001).
Discussion
The present findings are consistent with previous studies showing a substantial deficit in MS patients’ information processing speed compared to controls on a variety of RT and RSP measures. Numerically, the SDMT yielded the largest effect size (1.49), followed by the preliminary trials of the Stroop (1.15–1.37), and then by the separate RT tests (0.93–1.16). It is important to emphasize that these effect size differences do not constitute statistically significant differences between the measures. However, effect size statistics are useful to consider when comparing different neuropsychological tests evaluating a particular attribute (Zakzanis, Reference Zakzanis2001) and contribute to the discussion of the present results in terms of the complexity, compounding, and augmentation effects.
The Complexity Effect
As Figure 1 illustrates, the disparity in performance between MS patients and controls increased with the successively greater cognitive load imposed by the RT tests. This complexity effect has long been a crucial facet of the argument that RT differences between MS patients and controls constitute differences in the central processing of information rather than more peripheral sensory and motor problems (e.g., Kujala et al., Reference Kujala, Portin, Revonsuo and Ruutiainen1994; Parmenter et al., Reference Parmenter, Shucard, Benedict and Shucard2006; Parmenter, Shucard, et al., Reference Parmenter, Shucard and Shucard2007). This effect is not limited to RT measures, but has also been demonstrated with RSP measures (e.g., Lengenfelder et al., Reference Lengenfelder, Bryant, Diamond, Kalmar, Moor and DeLuca2006) including the Stroop (Denney et al., Reference Denney, Gallagher and Lynch2011).
However, sometimes consideration of separate effects sizes for the different tasks involved can lead to an impression seemingly at odds with the complexity effect, as in the present study. Though the differences are slight, the effect sizes for the four RT tests are inversely aligned with cognitive load, the largest effect size occurring on the SRT (Table 2). The paradox can be explained on the basis of computational differences between the statistics involved. The significance of the interaction is evaluated in relation to error variance that is pooled across all four RT tests. In the case of the effect size statistic (i.e., Cohen's d), error variance is treated separately for each task, and the difference between group means on any task is adjusted for that task's error variance alone. This difference underscores the importance of providing error bars on graphs illustrating complexity effect interactions.
The Value of Compounding
RSP measures resulted in larger effect sizes than those of the RT measures. Although merely a numerical difference in effect size, the advantage of the RSP measures is further supported by binary regression analyses showing these measures distinguished between the groups regardless of whether they are entered before or after the RT measures, whereas the RT measures only did so when entered first. We believe this advantage of the RSP measures is attributable to the compounding effect. By requiring a cognitive operation sensitive to information processing speed to be executed repeatedly in a fixed interval of time, RSP measures benefit from the compounding of differences between patients and controls.
One might argue that dividing the allotted time period on an RSP measure by the number of items completed would yield a measure equivalent to that of RT tests. However, the present results indicated other factors may come into play with RSP measures, perhaps due to necessity of maintaining a rapid pace of responding throughout the task, jettisoning any aftereffects that linger following each item and passing unencumbered to the next. These factors, as yet unspecified, contribute to the compounding evident in RSP measures.
Some investigators have argued that ancillary problems occurring in conjunction with MS such as visual acuity, oral-motor, or ocular-motor defects (Arnett, Smith, Barwick, Benedict, & Ahlstrom, Reference Arnett, Smith, Barwick, Benedict and Ahlstrom2008; Bruce, Bruce, & Arnett, Reference Bruce, Bruce and Arnett2007; Smith & Arnett, Reference Smith and Arnett2007) contribute to the apparent slowing in patients’ information processing speed, and that these problems may be particularly impactful in the case of RSP measures. However, two studies (Bodling, Denney, & Lynch, Reference Bodling, Denney and Lynch2008; Denney et al., Reference Denney, Gallagher and Lynch2011) have yielded little evidence that these ancillary problems are implicated in the difference in performance of MS patients and controls on the Stroop test. Thus, while we agree that RSP measures recruit additional sources of difference between patients and controls, the ancillary problems featured in these arguments seem to contribute little to this compounding effect.
An Instance of Augmentation
The larger effect size for the SDMT over that of the Stroop is illustrative of an augmentation effect. The effect is further demonstrated by binary regression analyses showing that the SDMT scores distinguished between the patients and controls regardless of whether they were entered before or after the Stroop scores, whereas the Stroop scores emerged as a significant predictor only when entered first. Augmenting factors may be thought of as a restricted class of confounding variables, ones that affect processing speed measures and independently enhance the apparent difference between patients and controls on such measures. The factor or factors responsible for this augmentation effect in the present study are unclear and must be determined through further investigation. However, the SDMT obviously places a far greater demand on accurate scanning than the computerized Stroop, and since at least some of the MS patients have difficulties with this ancillary function, this added demand may well serve as an augmenting factor. It should also be recalled that the SDMT was the only processing speed measure that correlated with relative interference on the Stroop; augmentation effects may stem from some added burden on attention required by the SDMT. Others (e.g., Hinton-Bayre & Geffen, Reference Hinton-Bayre and Geffen2005) have pointed out the involvement of additional cognitive domains such as working memory and attention in SDMT performance.
The SDMT was also the measure most highly related to EDSS scores (r s = −.72; p < .001), suggesting that the augmenting factors in play here may be particularly sensitive to patient's disability status. These findings bear on clinicians’ and researchers’ decisions whether to use the SDMT. If seeking a measure to maximize the differentiation between MS patients and healthy individuals or to align with patients’ disability status, the SDMT appears to be the most effective measure used in the present study. Alternatively, if the objective is a relatively pure assessment of information processing speed, one should probably consider a measure other than the SDMT.
Relationship to Working Memory
Investigators have debated whether the primary cognitive deficit in MS is better conceptualized as a defect in working memory or information processing speed. The preponderance of evidence favors the domain of information processing speed. When the Processing Speed Index and Working Memory Index are derived from neuropsychological test batteries, the differences between MS patients and controls are better aligned with processing speed (DeLuca et al., Reference DeLuca, Chelune, Tulsky, Lengenfelder and Chiaravalloti2004; Drew, Starkey, & Isler, Reference Drew, Starkey and Isler2009). Furthermore, deficits in patients’ performance that might otherwise be attributed to working memory problems have been shown to disappear when the time allotted for information processing is lengthened (Demaree et al., Reference Demaree, DeLuca, Gaudino and Diamond1999; Leavitt, Lengenfelder, Moore, Chiaravalloti, & DeLuca, Reference Leavitt, Lengenfelder, Moore, Chiaravalloti and DeLuca2011; Lengenfelder et al., Reference Lengenfelder, Bryant, Diamond, Kalmar, Moor and DeLuca2006).
It is important, however, to consider the alignment of working memory with the three effects featured in this discussion. The complexity effect clearly results from the successively greater burden placed upon working memory across the series of RT tests. Patients’ performance is more adversely affected by this added burden than that of controls, although the presence of substantial differences on even the least burdened SRT constitutes additional evidence that the deficit in MS is not confined to working memory (Parmenter et al., Reference Parmenter, Shucard, Benedict and Shucard2006; Parmenter, Shucard, et al., Reference Parmenter, Shucard and Shucard2007; Tombaugh et al., Reference Tombaugh, Berrigan, Walker and Freedman2010). The factors responsible for compounding and augmentation effects are as yet undetermined. Compounding involves a relatively restricted set of factors that can account for the enhancement of differences between patients and controls on tasks requiring numerous repetitions of a relatively simple act of information processing, whereas augmentation involves factors that may be operable in processing measures but extraneous to the domain of information processing speed itself. In both instances, some of these factors may implicate working memory; others not.
Conclusion
Although substantial differences between patients and controls were found on all tests, effect sizes were numerically larger for RSP measures than for RT measures and for the SDMT than for the Stroop Test. Furthermore, on binary logistic regression analyses, RSP measures performed better than RT measures at distinguishing patients from controls, and likewise, the SDMT performed better than the Stroop. No test yields a pure measure of a single construct domain. Nevertheless, we believe the distinctions between complexity, compounding, and augmentation effects are useful in guiding further research and contemplating the variety of tests available for assessing deficits in information processing speed that occur in conjunction with MS or other neurological conditions.
Acknowledgments
This research was unfunded, and the authors have no financial or other conflicts of interests to report. A paper based on this research was presented on October 14, 2010 at the 26th Annual Congress of the European Committee for Treatment and Research in Multiple Sclerosis (ECTRIMS), Gothenburg, Sweden.