


Introduction
In Norway there are over 1600 glaciers, many of which make important contributions to commercial and industrial water supply. There is a requirement, therefore, to monitor accurately glacier mass balances and glacier snow cover from year to year in order to manage water supplies efficiently and plan for future climate changes. Remote sensing is a tool that can be used to assist with the determination of glacier mass balances.
The transient snow-line (TSL) and equilibrium-line altitude (ELA) are glacier parameters that can be related to the mass balance of a glacier or ice-cap system (Reference PatersonPaterson, 1994). By locating the TSL at the end of the melt season, it is possible to determine the ELA and therefore whether a glacier mass balance is increasing or decreasing. Using visible/infrared satellite remote-sensing systems, Reference ØstremØstrem (1975) demonstrated that a TSL and ELA can be determined from the imagery. Frequently however, glaciers are cloud-covered, rendering visible and infrared sensors ineffective for mass-balance studies. With the availability of satellite radar systems since the early 1990s, this problem potentially can be overcome since current satellite synthetic aperture radar (SAR) systems are unaffected by cloud cover and can be used for repeat glacier observations.
Reference Rees, Dowdeswell and DiamentRees and others (1995) have shown that SAR backscatter imagery acquired during autumn and winter can be used to locate the ELA at the end of the previous melt season. Other studies have also demonstrated the utility of SAR backscatter imagery for glacier snow and ice monitoring (e.g. Reference Engeset and WeydahlEngeset and Weydahl, 1998; Reference Hall, Williams, Barton, Sigurðsson, Smith and GarvinHall and others, 2000; Reference König, Winther and IsakssonKönig and others, 2001). Reference PartingtonPartington (1998) identified different glacier facies using multi-temporal European Remote-sensing Satellite (ERS) SAR data and characterized different glacier surface zones (dry snow, percolation/wet snow, bare ice) from radar backscatter. Reference Strozzi, Wegmüller and MätzlerStrozzi and others (1999) have shown that there are uncertainties with the interpretation of SAR backscatter from certain snowpack types (wet, rough surface snow and dry snow with a thin layer of wet snow at the surface). It is possible that these uncertainties could be critical at the TSL zone where snow stratigraphy can be complex in character. Therefore, a complementary approach to identify the ELA is proposed that does not rely on the interpretation of SAR backscatter, but rather on quantitative analysis of interferometric coherence from tandem ERS-1 and ERS-2 pairs.
Specifically, the paper aims to determine the utility of radar coherence from repeat-pass SAR interferometry of an ice cap to try and locate the TSL at the end of the melt season. Since the TSL can be viewed as a seasonally mobile zone of diurnally changing snow, it should be possible to monitor this zone using coherence maps from repeat-pass interferometry from a 24 hour period. Theoretically, the TSL zone can be characterized as a temporally unstable zone with low coherence over a 24 hour period. This zone is bounded by relative temporal stability (high interferometric coherence) at upper elevations (due to relatively stable conditions of dry snow and volume scattering), and high coherence at lower elevations (due to stable surface conditions over bare ice). By selecting SAR passes at times during the late summer and winter seasons, the objective is to locate the TSL zone at the end of the melt season. It is considered that longer temporal baselines would not provide useful coherence information on account of icecap-wide changes in surface characteristics.
Study Area
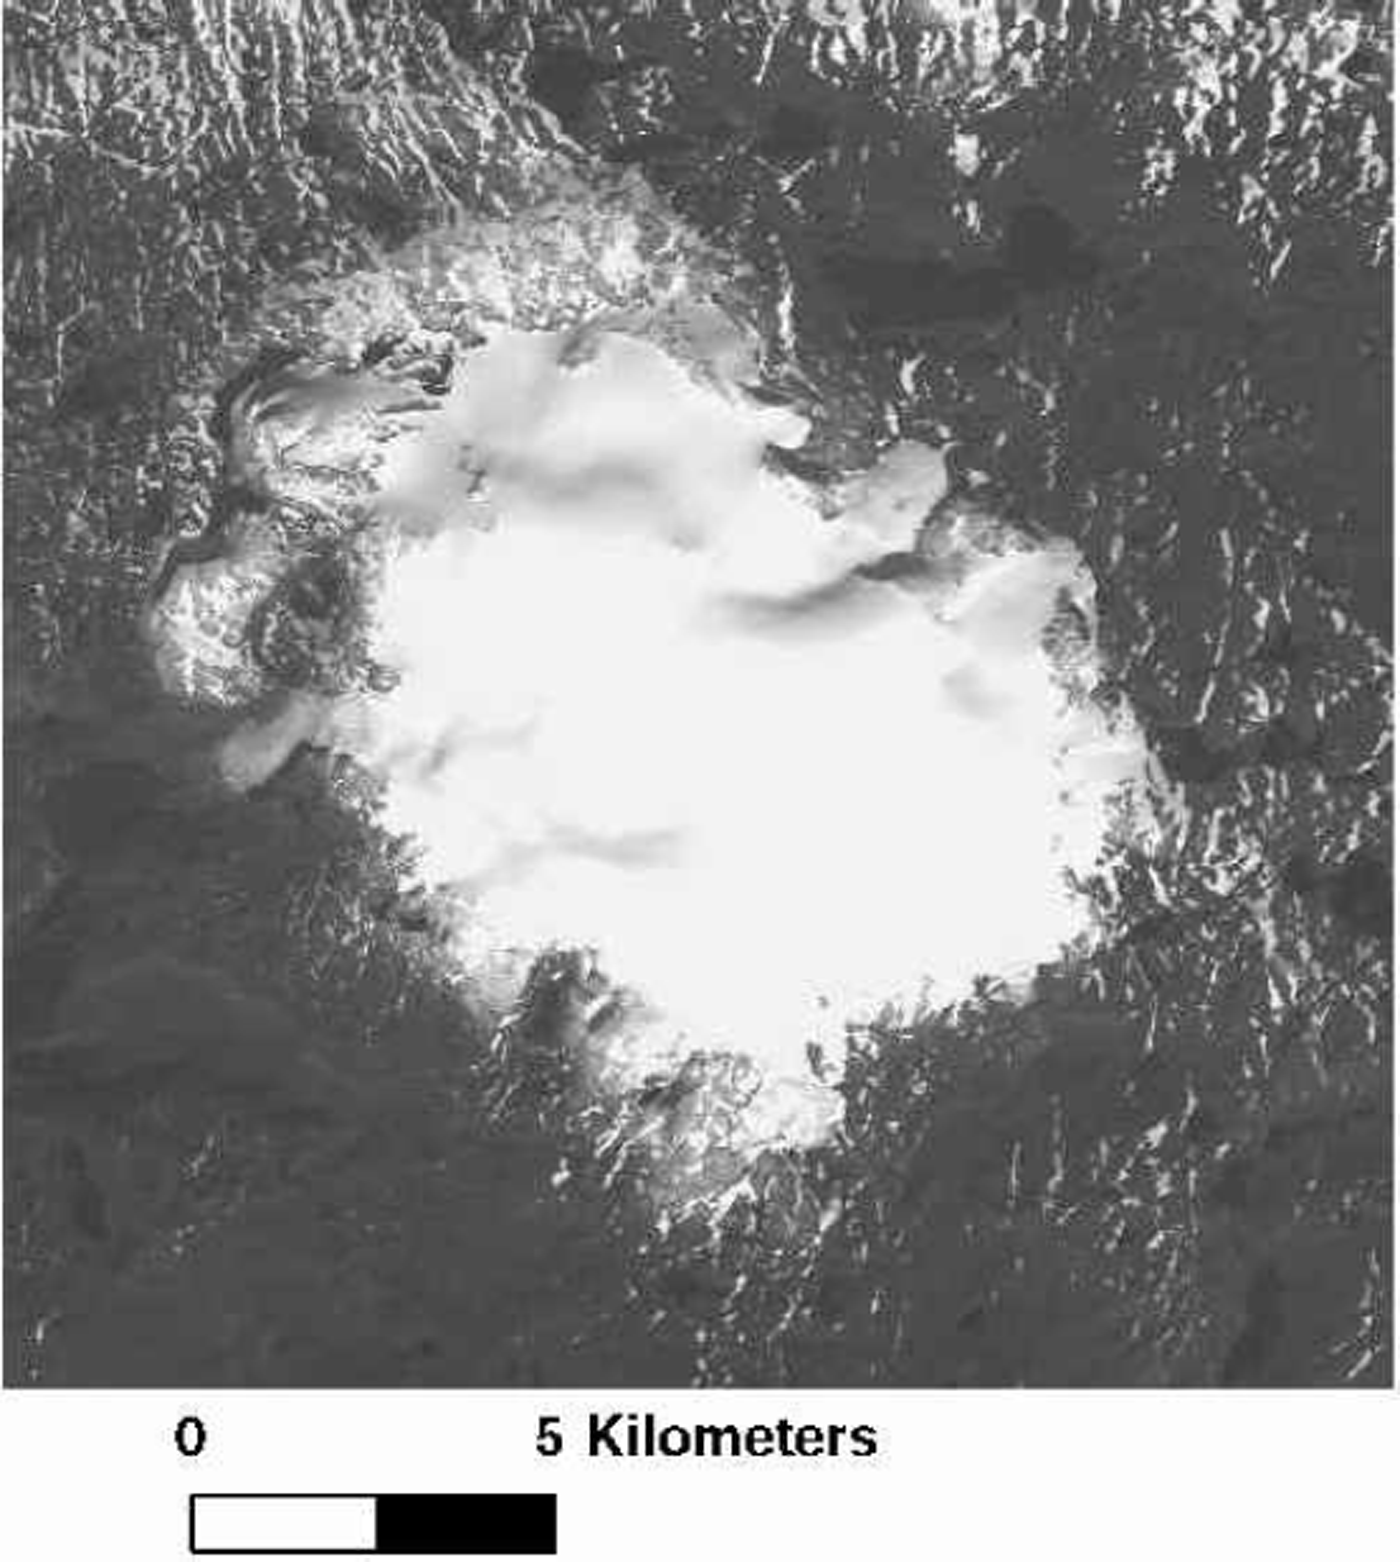
The ice cap under investigation is Hardangerjøkulen in southern Norway (Fig. 1). It is located at 60°3230 N, 7°1125 E, covers an area of approximately 73 km2 and is situated on the main water divide between Hardangerfjorden and Hallingdal. Its elevation is approximately 1400–1850ma.s.l., with steepest slopes at the extreme icecap margins. The Norwegian Polar Institute has measured directly the mass balance of Hardangerjøkulen since 1963, with the Norwegian Water Resources and Energy Administration (NVE) taking over in 1987. Records show that from the early 1980s the ice cap’s net mass balance has generally been positive, although there has been an increase in annual variability from the mid-1980s to the present (personal communication from NVE, 1996).
Système Probatoire pour l’Observation de la Terre (SPOT) panchromatic image of Hardangerjøkulen ice cap acquired in September 1992 (image © Spotimage).
Data Collection And Processing
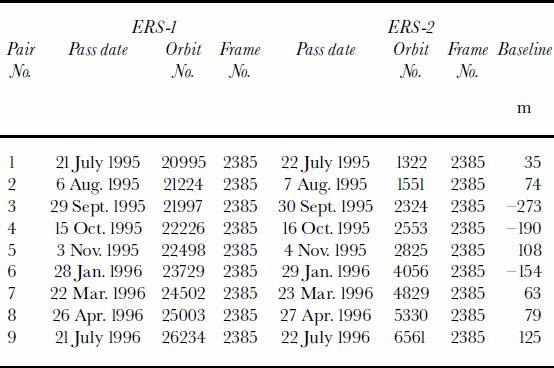
ERS-1 SAR single look complex (SLC) data required for interferometric processing were obtained from the U.K., Italian and German Processing and Archiving Facilities (PAFs) for the dates shown in Table1. Images were acquired for the morning pass (descending mode) and were selected so that local acquisition time was, on average, 1030 h. To prevent potential data problems caused by differences in SLC images resulting from different SAR processors, each SLC image pair was processed at one of the three PAFs. The SLC data were acquired during the ERS tandem phase so that the baselines between ERS-1 and -2 SAR instruments were small (see Table 1). In addition, all SLC image pairs have the same radar geometric properties, in that they were acquired along the same descending-mode track and at the same frame. Although differences between successive pairs were caused by differences in the location of the orbital tracks relative to the ice cap, these differences should not affect the temporal comparison of coherence products.
ERS SLC images used in this study
of surface temperature.
Acoherence image was generated for each SLC pair using the SAR Toolbox software available from the European Space Agency (see http://earth.esa.int/sartoolbox for details). Pairs of SLC subsets for the area were extracted from larger SLC scenes, and the software computed coherence (0–100%) images for each pair. The coherence images were then coregistered and re-projected to Universal Transverse Mercator (UTM) zone 32 (based on the World Geodetic System 1984 ellipsoid). The geolocation procedure used a series of ground-control points around the ice-cap margin that could be identified from a map reference source. The transformation was then applied to re-project the SAR data into the UTM reference frame. The locational error for this procedure was less than 16m×16m. A calibrated SLC backscatter image from the ice cap for 26 April 1996 is shown in Figure 2 for reference. A digitized representation of the glacier outline is also shown for qualitative reference. The radar viewing geometry produced foreshortening and layover at the ice-capmargins, but this was not significant for the ice-cap-wide analysis of coherence.
Reference calibrated SLC image of Hardangerjøkulen for 21 July 1995 (left) and inset (right) for 26 April 1996. Black squares on the transect are locations of field observations
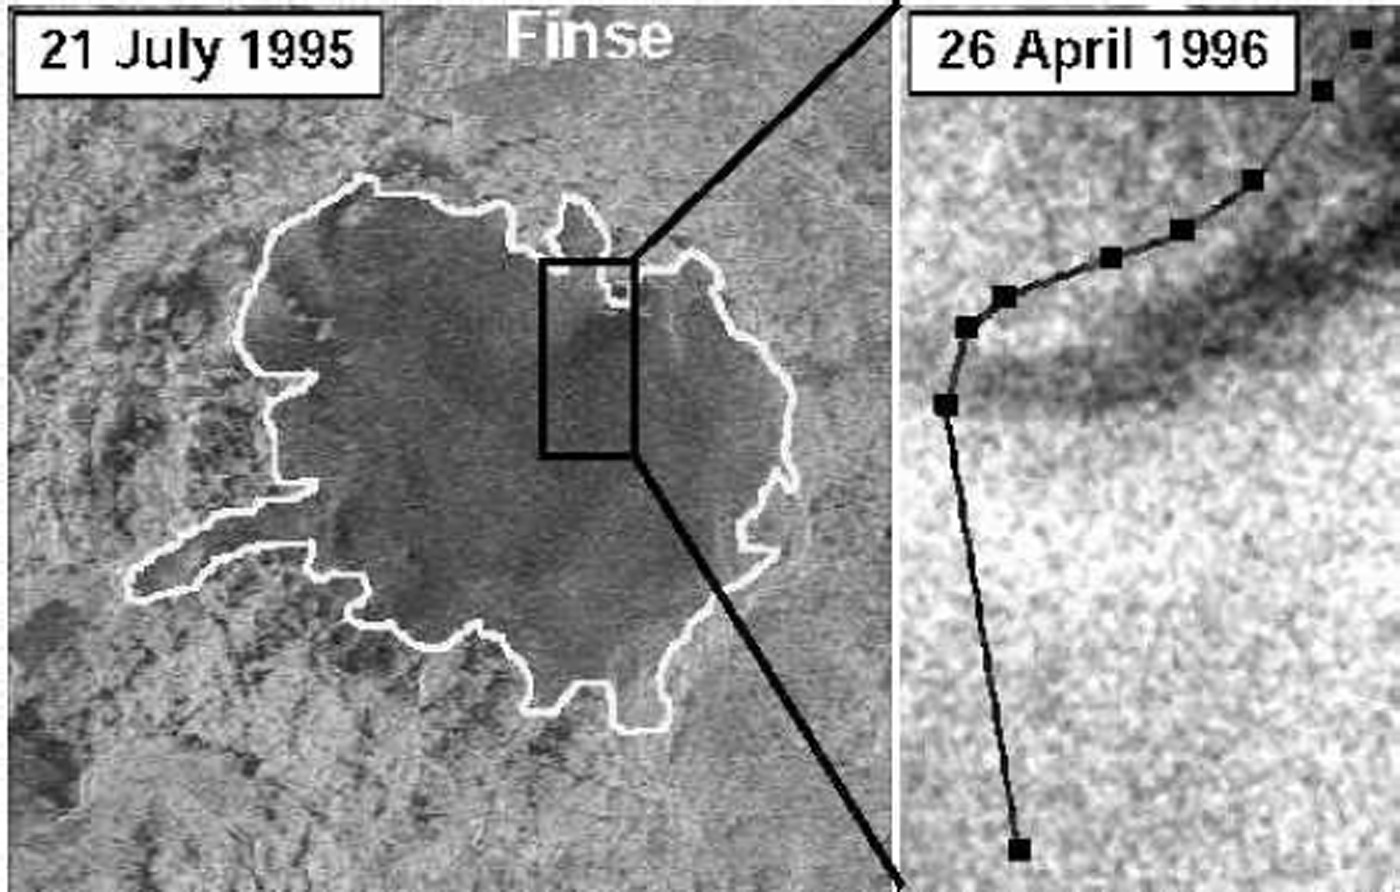
Field campaigns were conducted to coincide with ERS overpasses on 22–23 March and 26–27 April 1996. The first campaign in March consisted of a qualitative examination of the weather conditions from one day to the next. It was found that the weather was stable from 22 to 23 March 1996 and that temperatures remained well below 0°C on the ice cap. For 26–27 April 1996, the weather conditions were unstable, with observable changes in ice-cap surface micro-topography (e.g. development of linear crustal features and wind slab) as a result of strong wind activity. Surface temperatures were measured on 26 April 1996 at the nine locations on the ice cap identified in the inset of Figure 2 by the black boxes superimposed on the image. The measured temperatures ranged from 0°C at the lowest site, to –0.8°C at the highest sample site near the ice-cap midpoint. The environmental lapse rate (ELR) between the averaged first and second sample location (ice-cap margin) and the averaged eighth and ninth sample location (ice-cap centre) was calculated to be 2.5°Ckm–1.
In addition, daily temperature observations (minimum, maximum and average) acquired at Finse (1222ma.s.l.; approximately 7 km from the ice-cap centre) were obtained to assist with the interpretation of the coherence images. Table 2 gives minimum, maximum and average daily temperatures for 12 selected days when SLC images were acquired. These days represent mid-summer, mid-winter and early- and late-winter times. The station has an elevation almost 200 mbelow the ice cap’s lowest marginal limit (see Fig. 2 for location). Consequently, for extrapolation of temperatures from this station using the ELR calculated above, it is expected that temperatures on the ice cap throughout the winter will have been below those measured at Finse.
Minimum, maximum and average daily temperatures observed at Finse meteorological station for six SLC pairs obtained during winter 1995/96

Temporal Variations in SAR Coherence
Figure 3 shows a series of six coherence images for 21–22 July 1995, 3–4 November 1995, 29–30 January 1996, 22–23 March 1996, 26–27 April 1996 and 21–22 July 1996. For simplicity, henceforth, coherence images are referred to by the first of the two dates that make up a pair. Changes in coherence from one date to the next are related to changes in backscatter surface characteristics between the SLC images. Diurnally, low coherence (550%) represents low temporal stability over the ice cap, and high coherence (>50%) represents high temporal stability.
Series of six sequential interferometric coherence images for the 1995/96 study period.

During the summer months (21 July 1995 and 21 July 1996 image coherence), stability is evident in the peripheral areas of the ice cap, while coherence over the ice cap is low. Table 2 shows that minimum and maximum temperatures at Finse for all four SLC dates are high, and, even with an ELA twice that calculated for the 26 April campaign, temperatures were above 0°C over the ice cap at this time of year. Consequently, the SAR backscatter probably will have been from either bare-ice or wet-snow surfaces, both of which are prone to rapid changes over a 24 hour period. This instability on the ice cap produced the observed low coherence.
The ERS SLC coherence images calculated for the winter months (28 January and 22 March 1996) are characterized by high coherence over the ice cap and around the peripheral areas. On these dates, observed temperatures at Finse were well below freezing, suggesting that small variations in radar response might be the result of local surface snowpack redistribution, but the overall response is dominated by volume scattering from the winter snowpack. It is suggested that this kind of radar backscatter return is fairly stable over a 24 hour period, which explains the high coherence observed for these two pairs.
The remaining two coherence images are derived from SLC pairs obtained in the very early and very late part of the winter season (3 November 1995 and 26 April 1996, respectively). At the start of winter (3 November 1995), maximum temperatures at Finse were less than –8.6°C, and over the ice cap will probably have been even colder. The backscatter surface is one of low stability over the 24 hour period, which is not easily explained in the light of the cold temperatures. Maximum sustained wind speeds measured at Geilo (35 km to the east) and Bergen (100 km to the west) ranged from 10 and 14 knots (18 and 26 kmh–1), respectively, on 3 November 1995 to 14 and 5 knots (26 and 9 kmh–1), respectively, on 4 November 1995. Although these data are daily averages and cannot fully represent hourly changes, it is reasonable to assume that wind speeds on Hardangerjøkulen will have been greater than at either of the two stations since the ice cap is located at the water divide between these two stations and at a higher elevation. Strong winds probably redistributed fresh surface snow and may have produced surface crust features such that the coherence between the two SLCs was substantially reduced. This assertion is supported by the fact that the peripheral ice-cap areas also show lowered coherence compared with higher coherence in summer and winter coherence images. Further supporting evidence is given from qualitative observations of the ice cap during the field campaign on 26 and 27 April 1996 (the late-winter coherence map in Figure 3) when strong winds were observed in the field over the ice cap on the morning of 27 April 1996. In this case, coherence is high over the interior of the ice cap (as shown by a white swath at upper elevations) wherewind activity did not produce significant changes to the ice-cap microtopography. At lower elevations, however, significant changes were observed on and off the ice cap as a result of the strong wind, with wind slab and surface linear ice features forming. These changes were obvious when compared with the surface condition of the previous day. In addition, field-campaign temperature measurements recorded snowpack temperatures near 0°C at the lower ice-cap elevations, but these temperatures dropped below zero further up the ice cap. Consequently, low-elevation snow and ice areas will have been prone to snowpack metamorphism (Reference ColbeckColbeck, 1982) as a result of these near-melting-point temperatures. These widespread changes in surface roughness (caused by wind redistribution of snow and subsequent changes to microtopography of the ice cap) were sufficient to change the backscatter phase and amplitude from one day to the next such that coherence between SLC images comprising the pair was substantially reduced.
Quantification Of The TSL/ELA
The analysis of variations in coherence through the 1995/96 winter season suggested that the main differences in coherence are caused by changes in temporal stability from one day to the next. These changes are the result of variations of snow and ice physical properties that cause differences in the radar response and ultimately the coherence. Spatial variation of coherence in mid-winter and mid-summer satellite passes tends to be related to internal, ice-cap-wide stabilities and instabilities in the snow and ice. Variations in surface roughness that produce the coherence are generally caused by thermal changes in the pack. During early or late winter, however, the effect of wind (as an external factor) can cause coherence variations that do not necessarily reflect the thermal characteristics of the ice cap. The coherence response from the ice cap is variable, with some areas exhibiting high and others having low coherence depending on wind-flow patterns over the ice cap. This is not unexpected since surface temperatures tend to fluctuate near 0°C (and hence, snowpack metamorphism can be prevalent), which, combined with wind-derived snow and ice changes, reduces the chance for ice-cap-wide stability over a 24 hour period. Con-sequently, localized coherence variations might not be linked purely to the TSL/ELA but rather to localized changes in backscatter surface properties unrelated to the TSL radar characteristics. It is suggested, therefore, that late-summer/early-winter coherence might not be useful for TSL identification and that comparisons between mid-winter and midsummer coherence might yield more reliable information about the TSL/ELA.
The TSL, theoretically, should coincide with a change in coherence difference (from low to high coherence difference up-slope). It is this spatial gradient that was investigated. Below the TSL, fresh snow can undergo melt–refreeze processes in early winter, and the surface can be more adversely affected by wind activity (as in the 3 November 1995 coherence map). Above the TSL it is expected that coherence changes are greater since low summer coherence (low stability) gives way to high wintertime coherence, coherence that is high on account of stable volume scattering of the radar signal (as shown in the winter coherence images). Therefore, a threshold in the difference-image histogram at a value of 40% might reveal the location of the TSL. Difference images were computed by subtracting a summer from a winter coherence image. For differences of 50%, the change in coherence is caused by the reduction in coherence from summer to winter (a situation found mostly in the ice-cap periphery). If differences are >0% then coherence increased from summer to winter. If the coherence difference is 0% then there is no change in stability. To be useful for TSL identification, a spatial gradient between low coherence difference (small change) and high coherence difference (large change) was sought.
Three image coherence pairs were used to generate difference images:
28 January 1996 to 21 July 1995
22 March 1996 to 21 July 1995
22 March 1996 to 3 November 1995.
Figure 4 shows the three histograms from the difference images for these dates. The first histogram (29 January 1996 to 21 July 1995) shows a bimodal distribution, with one sub-distribution having a mean value of –5.6%. This first peak represents a mismatch in the SAR image coverage (on account of different orbital paths for the two pairs of SLCs) and should be discounted. The second peak is located at 2.0% coherence difference and represents the (dominantly) ice-cap-wide increase in coherence. There is no noticeable trough (minimum between peaks) in this sub-distribution, and it is suggested that these coherence pairs are not useful for identifying the TSL. For the second difference image (22 March 1996 to 21 July 1995) the histogram reveals a clear break in the distribution at a coherence difference of approximately 3%. This is annotated in Figure 4 for reference. To ensure that our theoretical basis was reasonable, a difference image was also computed for 22 March 1996 and 3 November 1995. It was predicted that a threshold would not be observed since coherence variations in the November scene were caused by widespread instabilities that were less related to glacier facies variations over the TSL and more to general snow-and-ice diurnal variations expected at this time of year. The last histogram in Figure 4 shows that there is no discernible trough in the histogram.
Histograms of three coherence difference images for winter 1995/96.

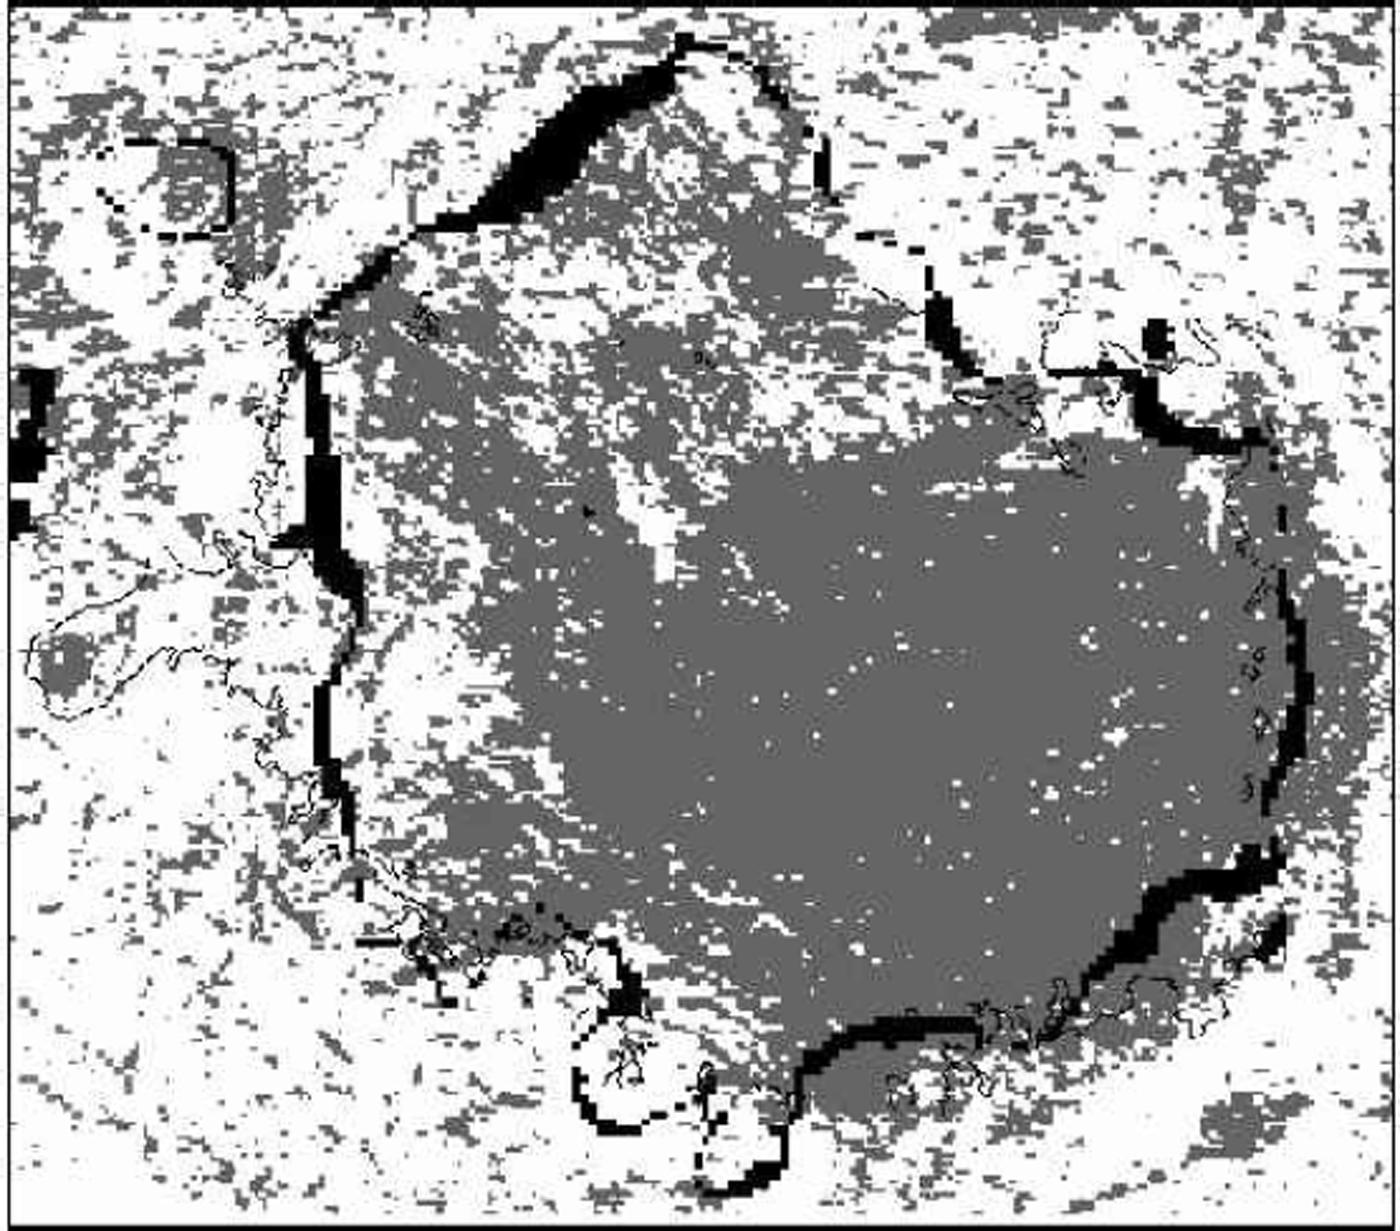
The 3% coherence difference threshold was applied to estimate the location of the TSL and ELA over the ice cap. Figure 5 shows the result of applying this threshold to the coherence difference image for 22 March 1996 to 21 July 1995. Pixels with coherence values greater than the 3% threshold are assigned grey. The glacier outline is the thin black line, and the TSL is the thicker black line derived from NVE ELA records and a 1995 digital elevation model (DEM) obtained from NVE. By digitizing the boundary of the contiguous area of coherence above the threshold and within the ice-cap area, the coherence estimate and NVE/DEM estimate of ELA can be compared. Table 3 shows the results of this comparison. The coherence-estimated ELA length is 9.6% longer than the NVE-estimated ELA length, but the coherence area is 10.6% less than the NVE area. It is difficult to know which is correct, because the NVE TSL is extrapolated around the ice cap at the ELA elevation band (1580–1600ma.s.l.); it is unlikely that the TSL was located uniformly between 1580 and 1600ma.s.l. Using the DEM, the coherence-estimated ELA was derived from the average TSL and was found to be 1609ma.s.l. with a standard deviation of 118m. This average is a good agreement with the NVE-derived estimate and is an overestimate of 9–29m.
A map of the coherence differences between 22 March 1996 and 21 July 1995 for which only pixels with a value of 43% are shown (grey). The thin black line is the glacier outline, and the thick pixelated black line is the NVE/DEM TSL derived from the ELA.
Comparison statistics of coherence-derived ELA estimate and NVE/DEM-derived estimate

Conclusions
This paper has demonstrated how diurnal repeat-pass coherence information from the ERS-1 and -2 SAR instruments can be used to estimate the TSL (and ELA) of an ice cap. The method requires the production of coherence images for summer and winter. At these times, it is suggested that the ice-cap instability (summer) and stability (winter) over a 24 hour period is maximal. By differencing the two coherence images, it was shown that a threshold can be detected in the difference-image histogram that can be used to identify the location of the TSL. This threshold might vary from ice cap to ice cap and from year to year, but it should be evident as a positive minimum in the histogram. The application of the threshold to the difference image of 22 March 1996 to 21 July 1995 produced an estimated ELA that was less than 30 mdifferent from the NVE estimate.
This approach is a complementary one which is designed to assist glacier facies interpretation approaches or more straightforward SAR backscatter interpretation (e.g. Reference PartingtonPartington, 1998). However, it has the advantage over these other methods in that it is more straightforward in its application. The problem for future applications, however, is that the ERS tandem phase was a unique opportunity for this work and it is unlikely that future satellite SAR missions will repeat this approach. Nevertheless, the results from this study demonstrate that interferometric coherence data can be used to estimate the ELA for this particular ice cap.
Acknowledgements
The European Space Agency are gratefully acknowledged for providing ERS SARdata under AO-2, and Birkbeck College are thanked for providing a College Research Grant. NVE provided DEM and mass-balance data.



