Introduction
The West Antarctic ice sheet is drained by concentrated streams of ice. These ice streams are known to be the foci of present-day mass imbalances of the ice sheet (Reference Alley and WhillansAlley and Whillans, 1991). This means that the stability and mass balance of the West Antarctic ice sheet as a whole is closely tied to the causes of and controls on ice-stream flow, neither of which are understood. It seems valuable to obtain a detailed description of the pattern of flow of an ice stream and an understanding of the genesis of the pattern.
Earlier work shows that the pattern of velocity on Ice Stream B is quite unlike that on other glaciers. On other glaciers, there is a close coupling between longitudinal strain rate and surface slope. This coupling is believed to be due to flow over disturbances such as basal topographic highs or sites of large basal friction to which the glacier has adjusted. The linkage between strain rate and slope on Ice Stream B is completely different and of unclear genesis (Reference Whillans and van der VeenWhillans and Van der Veen, 1993; Reference Whillans, Jackson and TsengWhillans and others, 1993).
There are many suggestions for the causes of the unusual behavior of lee Stream B. One possibility is that topographic highs may be unrelated to conditions at the bed but may be rafts of ice of different strength being advected with ice flow (Reference Whillans, Bolzan and ShabtaieWhillans and others, 1987). Also, there could be strength variations due to temperature contrasts (the result of more or less strain heating) or different crystallographic orientation (Reference Whillans, Jackson and TsengWhillans and others, 1993). These anomalies may be isolated or occur as large-scale foliation, each folia having different 254 mechanical properties. The bed of Ice Stream B is underlain by water and small-strength debris (Reference Engelhardt, Humphrey, Kamb and FahnestockEngel-hardt and others, 1990; Reference McDonald and WhillansKamb, 1991). This lubrication may be mobile and change position or strength with time, and so affect the flow of the ice above in special ways. Recognizing which, if any, of these hypotheses apply bears on understanding the controls on the motion and time evolution of ice streams.
Each hypothesis predicts special relationships between surface topography and strain rates and among strain rate components. Tests of the hypotheses are conducted here by using repeat measurements of a very large strain grid on Ice Stream B.
Field Methods
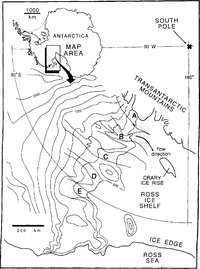
The existing strain grid at the UpB Camp on Ice Stream B, West Antarctica (Reference WhillansWhillans, 1984), was expanded in the 1991-92 field season to cover a 170km2 area with about 270 stations and resurveyed in 1992-93. The location of Ice Stream B is shown in Figure 1. Such a large grid would require months of effort to survey using traditional methods. The "stop-and-go" kinematic Global Positioning System (GPS) surveying method is an efficient alternative (Reference HulbeHulbe, 1993; Reference Hulbe and WhillansHulbe and Whillans, 1993). The technique is rapid, requiring only 25s at each station. Horizontal precision is similar to traditional methods but vertical precision is much improved. As far as we are aware, these are the first data precise enough to calculate meaningful relative vertical velocities over a two-dimensional region of a glacier.
The strain grid is at about 83˚25’ S, 136˚41' W on Ice Stream B. Contours are surface elevation in meters

In the stop-and-go kinematic technique, the phase of GPS carrier waves is continually tracked by both fixed and mobile equipment .Mobile receivers travel a selected route, stopping at survey points, in our case steel conduit poles, along the route. Mathematical differences between receivers and between satellites arc used to determine the position of the rover relative to the fixed receiver. Such double-difference calculations remove most common errors. These include uncertain knowledge of satellite orbits, receiver and satellite-clock off-sets and tropospheric signal delays. More limiting are ionospheric effects. The UpB strain grid lies under the southern auroral belt, where extreme time and spatial variation in the ionosphere results in large uncorrelated carrier-wave phase advance over distances as short as 10km (Reference Tseng, Whillans and VeenTseng and others, 1989). Phase advance is frequency-dependent. To evaluate the error, observations on two frequencies must be available.
The GPS equipment used in these surveys was designed to record both the L1 and L2 GPS frequencies. However, tracking of the L2 frequency from the moving receiver was so poor that it could not be used. This meant that no correction for ionospheric distortion could be performed. To minimize the error, base lines were kept as short as possible, typically less than 5 km. Seven grid stations are selected as fixed receiver, or "pivot" stations, such that no pole is more than 5 km away from a pivot.
Tracking between stations is done with the roving antenna mounted on a steel conduit pole attached to a Nansen sled towed by a snowmobile. The GPS receiver, batteries and emergency equipment are also carried on the sled. At each station stop, the driver transfers the antenna from the pole on the sled to the top of the grid pole and enters the station name into the receiver. Five epochs of 5s interval data are collected at each station. Five epochs are sufficient to smooth high-frequency variation in the ionosphere. The bulk of survey time is spent driving between stations. At the rear of the train is a second snowmobile, also roped to the sled. This snowmobile would act as a safety anchor if the lead driver (surveyor) fell into a crevasse.
For each survey session, fixed receivers are left tracking at one or two pivot sites. Roving teams (usually two) begin each session at an “eccentric” pole, placed about 3 m from the pivot. The vector between each pivot and its eccentric is well known from separate “antenna swaps” and is used to initialize each survey. Roving teams then visit 15-20 nearby stations and return to the eccentric to close the session
The survey sessions proceeded in a regular sweep through the grid. This reduces velocity-calculation complications due to ice strain during the survey. Two or three sessions were completed each day. Every station in the grid was surveyed at least twice during each season. All data were processed following each day’s work using Trimble Navigation Limited’s KIN, an automatic processor which invokes TRIMMBP. This assured data quality and allowed problems to be fixed rapidly, before ice motion greatly changed the distances between stations. In both years, the survey was completed within 2 weeks.
The quality of both surveys exceeds requirements. In the field, internal consistency was checked daily to identify and remove suspicious observations. In 1991–92, this was done using Trimble’s TRIMNET software. In 1992–93, a vector-addition algorithm was used which identified vectors that did not conform with repeat and neighboring observations. Vectors observed more than once in the same day are less affected by ice motion and so provide a measure of precision. Root mean square differences in horizontal and vertical position components are 2.5 and 5.5 mm km-l, respectively, in 1991–92 (Reference Hulbe and WhillansHulbe and Whillans, 1993) and 1.5 and 5mm km-1, respectively, in 1992-93 (calculated from 53 repeated observations). GPS results are also compared with test base lines surveyed in 1991–92 with electronic distance measuring instruments (EDMI). EDMI distances are shorter than those measured with GPS by 2 x 10⁻⁵. The difference is negligible in this area, where strain rates arc two orders of magnitude larger (a typical strain rate is 2 X 10⁻³ a1).
Results
The strain grid is depicted in Figure 2 along with measured surface elevations. The grid consists of 26 rows and 11 columns of regularly spaced steel conduit poles planted vertically in the firn surface. The station spacing is about 1000 m, about equal to the ice thickness. The long axis of the grid is oriented approximately 10° counter-clockwise from the direction of ice flow. The glacier-right (northern) edge of the grid is near the kinematic center of the ice stream (Reference Whillans, Jackson and TsengWhillans and others, 1993). The grid stations farthest to the glacier left (southernmost) are about 2 km from the left shear margin (the Dragon) of the ice stream.
Height of the snow surface above the ellipsoid (WGS84) for the strain-grid area. Contour interval is 2 m. Most of the subglacial bed experiments by direct access (e.g. Reference Engelhardt, Humphrey, Kamb and FahnestockEngelhardt and others, 1990) are about 1.5km north of the UpB Camp. Dots on all maps show locations of grid poles.

Measured GPS survey vectors have been summed to produce elevations and relative velocities with respect to a pole, (x, y) ≈(2, 7) km, near the UpB Camp. No GPS ties to rock have yet been computed with very meaningful precision. However, the absolute horizontal velocity of a station at the UpB Camp is known from earlier work to be 446.7 m a-1 (Reference McDonald and WhillansMcDonald and Whillans, 1992).
Redundant GPS vectors were compared for internal consistency. Those which produced positions differing by more than 0.0 1 m from the majority were removed from the calculation. In 1991–92, two suspicious survey sessions and 22 additional vectors were removed. In 1992-93, two survey sessions and 17 additional vectors were deleted. In most of the additional vector cases, the problem is due to strain during the course of the survey. A more sophisticated calculation could include them.
The map of surface elevation shows important relief. Just to the glacier right of the UpB Camp is a valley (x, y) ≈(0,-9) km, which we term “Drillers’ valley”, because most of the drilling (Reference Alley and BentleyAlley and Bentley, 1988; Reference Engelhardt, Humphrey, Kamb and FahnestockEngelhardt and others, 1990) has been done there. The camp (x, y) ≈ (2,-7.2) km is on the flank of a knoll, which we call the "UpB knoll". Proceeding up-glacier, the surface is relatively simple until one reaches another valley (x, y) ≈(-15,-6) km and hill (x, y) ≈(12,-7) km called "up-glacial valley" and "up-glacial knoll", respectively. Discussions in following sections refer to these topographic features.
Horizontal velocity gradients and strain rates are computed for the center of each quadrilateral by averaging the relevant gradients obtained using the four stations forming the quadrilateral. Two coordinate systems for the horizontal are used. The (x, y) system has axes parallel to the columns and rows of the grid and the plot margins. It is a secant plane to the spheroid for Earth, so that there is no distortion.(0, 0)corresponds to 83°29′ 12″S,138°19′08″ W, (-20, 0) km and corresponds to 83°25′36″S,136°41′06″W in WGS84. Another system has the longitudinal axis, l, 10° clockwise from the x axis and approximately parallel to ice flow, and transverse,t,axis perpendicular, across-flow. Longitudinal and transverse strain rates are presented here. The strain rates are accurate to 2 x 10⁻⁵ a-1.
The vertical velocity of each pole, relative to a pole selected as described below, is also calculated. Part of every pole’s vertical motion is due to the normal settling of firn in the accumulation process. All grid poles are planted by hand, to approximately the same (1m) depth. It is assumed that the settling is uniform throughout the grid and so does not influence velocity patterns. Relative vertical velocities are accurate to 20mm km1 a1.
To the extent that they may be compared, the measured velocity patterns are similar to those obtained earlier for larger areas of the ice stream. An exact comparison is not possible, because earlier work derives from tracking of exposed crevasses which, for obvious reasons, is done in different places than snowmobile work and is less precise. In both present and previous studies (Reference Whillans, Jackson and TsengWhillans and others, 1993), horizontal deformation rates are dominated by lateral shearing due to drag transmitted from the shear margin to the glacier left. Lateral compression, associated with the down-glacial narrowing width of the ice stream, is the next most important velocity gradient. The disturbances in the velocity field within the present grid seem to be similar to some of the variations discovered to the glacier right by repeat photogrammetry (Reference Whillans, Jackson and TsengWhillans and others, 1993).
The main surveys are 1 year apart. To check for any possible short time-scale variation in ice flow, a part of the grid was resurveyed after I month. Although the short time span between measurements limits the precision of the calculated velocities and strain rates, both the patterns and magnitudes of the yearly and monthly values agree. As with earlier results (Reference Harrison and EchelmeyerHarrison and Echelmeyer, 1989; Reference McDonald and WhillansMcDonald and Whillans, 1992), there is no apparent temporal change in ice flow.
Tests
Is the surface topography constant?
There is considerable surface topography throughout Ice Stream B. Stereo-photography shows a 40 m high feature to the glacier right of the present area (the “upwelling” of Reference Whillans, Jackson and TsengWhillans and others (1993)). Radar mapping from aircraft shows a major step down of 40 mover 10km about 75km down-glacier of the present study (Reference Retzlaff, Lord and BentleyRetzlaff and others, 1993). The average peak-to-trough vertical distance in the present grid is about 30 m, Surface-topographic variations may be linked to rafts that are being advected with ice flow or they may result from disturbances in flow caused by basal topography or roughness. Another possibility is that basal lubrication is being redistributed and the loci of disturbances may be migrating. These models predict quite different time evolutions for the surface topography.
The models are tested by examining the relationship between the vertical velocity of the poles and surface slope. If the features are stationary waves, due perhaps to conditions at the bed, the velocity must follow the slope of the surface. The other models predict migration of the features.
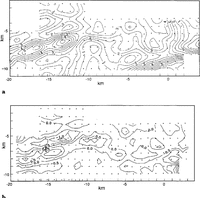
Comparison is made between the vertical velocity of each pole (Fig. 3a) and the along-flow component of surface slope (from the data used to compile Figure 2) multiplied by ice speed. These quantities should be identical in the case of stationary waves. There may be some constant offset velocity due to the lack of an absolute reference for vertical position. We selected the velocity of a point at which surface slope is very small, (x, y) ~ (-5, -7) km, to define the offset between the two surveys. The vertical velocity anomaly (Fig. 3b) is that part of the vertical velocity that cannot be accounted for in this way.
Vertical velocities of poles. Isotach interval is 0.5m a-1 . b. Vertical velocity anomaly, the difference between observed velocities and those predicted by local surface slope. An inter-survey offset velocity of 2.8m a1(at (x, y) ≈(5, 7) km) has been removed.

The most notable anomalies are on either side of “up-glacial valley". The relative anomaly is downward on one side and upward on the other. The pattern in “Drillers’ valley” is similar but the grid does not extend tar enough to describe it fully. Such a pattern indicates migration of the valleys to the glacier left, up-glacier or both.
Elsewhere, vertical velocity anomalies are small (ignoring anomalies at the limits of the survey that may be artifacts due to poorly determined surface slope). This indicates that these are stationary waves in ice flow and means that, for most of the grid, the surface topography is caused by flow over fixed basal conditions.
Are surface strain rates mainly caused by the tendency of the surface to relax?
Any surface disturbance in a deformable material is expected to tend to relax toward a state of constant gravitational potential. Thus, there must be a tendency for the topography in Figure 2 to flatten. The effect would be more extensive horizontal strain rates on topographic highs and rather more compressive strain rates in lows. Such a correlation is observed for the topography along much of the Byrd Station Strain Network and near Dye 3 in Greenland (Reference Whillam and JohnsenWhillans and Johnsen, 1983; Reference Whillans and JezekWhillans and Jezek, 1987). It is also observed for the much larger hill (the “upwelling”) studied by repeat photogrammetry (Reference Whillans, Jackson and TsengWhillans and others, 1993) to the glacier right of the present study area. Within the present grid, the effect seems to be exhibited most particularly in “Drillers’ valley” and “up-glacial valley" where transverse strain rates are especially compressive (Figs 2 and Figs4a).
Transverse normal strain rate (∂ut/∂t).Isoline interval is 0.5 x 10⁻³ a-1 b. Topographic residual, the part of the topography which is not relaxing. For the calculations, ρ=900kg m-3, g=9.81m s-2,η=1.3MPa a and ⋵tt = -0.003 a 1.Contour interval is 2 m.

The relaxation effect is evaluated quantitatively by computing the non-relaxing, residual topography. This residual is given by

in which h represents the measured height of the ice-stream surface, H represents ice thickness (1000 m),ρ represents ice density, g represents acceleration due to gravity, η represents ice viscosity, ω is 2π divided by the wavelength of the surface relief; here about 6 km, s =1/2(eωH+e-ωH) and c=1/2(eωH- e-ωH).The measured strain rate, ⋵, is considered to be due to the sum of a regional strain rate, ⋵0 and a local (relaxation) strain rate. The regional strain rate is calculated to be -0.003 a-1 from the proportional along-glacier change in ice-stream width (obtained from the map of Reference Vornberger and WhillansVornberger and Whillans (1990)) divided by ice-travel time. The righthand (relaxation) term in Expression (1) is a simplification of the linear flow model of Reference Whillam and JohnsenWhillans and Johnsen (1983). The effects of basal topography and basal fractional variation are neglected to calculate that part of the topography that is relaxing at the measured horizontal strain rate. If the glacier were infinitely thick (H→∞), the term, s/(ωHc), would be zero but in our case this term is equal to about 3/4
In the case of the UpB grid, the surface topographic features are aligned approximately along-flow. Therefore, the strongest effect of relaxation should be exhibited in transverse normal strain rates, ⋵tt. These are used in Expression (1).
The least-certain parameter in the calculation is viscosity, η. After many trials, the favored value is 13 MPa a. At this viscosity, much of the topographic residual map shows subdued features, yet few new topographic features are created. This value is similar to viscosity determined from the conventional flow law (Hooke, 1981) with ice temperature measured locally by Reference Engelhardt, Humphrey, Kamb and FahnestockEngelhardt and others (1990) and effective strain rate from the present measurements.
The topographic valleys arc somewhat reduced in the anomaly map (Fig. 4b) and the hills are largely unaffected. That is, only a small part of the strain rates can be due to relaxation. Measured strain rates on the hills are too compressive to be accounted for in this way and strain rates in the valleys are not compressive enough.
Use of other values for the viscosity or rational strain rate does not lead to a better match. In fact, close inspection of Figures 2 and Figures3a shows that even qualitative agreements are restricted. The use of a linear constitutive relation is not likely to be a problem, in light of tests conducted by Reference Van, Veen and WhillansVan der Veen and Whillans (1989) which show that power-law creep yields results similar to those with a linear relation for the Byrd Station Strain Network.
The failure of the relaxation model is a surprise. The features are not deforming like other stationary waves in inland ice, as near Byrd Station or Dye 3. Thus, unlike on inland ice, the observed strain rates are not secondary surface phenomena, and they must be primarily due to deeper-seated processes. This finding differs from those of Reference Bindschadler, Stephenson, MacAyeal and ShabtaieBindschadler and others (1987) and Reference Whillans, Jackson and TsengWhillans and others (1993), who studied similar features elsewhere on Ice Stream B. These authors did not have as extensive or as precise a data set as the present grid and could not conduct such a rigorous test.
A more sophisticated model is needed. The model should include the possible effects of basal disturbances, as Whillans and Johnsen did for along-flow disruptions. The model must be altered also to consider across-flow strain rate variations which in this case are more important than along-flow variations.
Are there sticky spots?
Basal obstructions directly affect deep ice and indirectly affect surface ice. The finding that most of the surface topography is fixed suggests that stationary bed features are causing flow disturbances. The present data are studied to search for associated surface slope and strain-rate patterns that could indicate such obstructions.
One analog for a basal obstruction is a low wall, or weir, that crosses a river, although in the case of a glacier, turbulence is unimportant. The water flows over the weir with extra stretching up-flow and less stretching downflow. There is an associated steeper slope over the obstruction. The obstruction could be a basal topographic high, as in the case of a river weir, or a site of increased basal friction. The effects of such obstructions have been modeled by Reference Whillans and JezekWhillans and Johnsen (1983) and further discussed in Reference Whillans, Van der Veen and OerlemansWhillans (1987). Such patterns are commonly observed on other glaciers (e.g. Storglaciären, Sweden (Reference Hooke, Le, Calla, Holmlund, Nilsson and StroevenHooke and others, 1989), pre-surge Variegated Glacier, Alaska (Reference Raymond and ColbeckRaymond, 1980, fig. 10b and c), along the Byrd Station Strain Network (Reference Van, Veen and WhillansVan der Veen and Whillans, 1989) and on Byrd Glacier, in the Transantarctic Mountains (Reference Whillans, Chen, Veen and HughesWhillans and others, 1989)).
Another analog emphasizes the possibility that the obstruction has a limited lateral extent and flow deviates around it. This is like a submerged boulder in a river, Some of the water rides up on top of the boulder but most of the water is deflected to the sides, to converge again in the lee of the obstruction. A site of large friction or “sandpaper patch”, rather than a topographic feature, could serve the same effect. We are unaware of any reports of such behavior on glaciers but the possibility remains open.
The two analogs predict different surface-slope and velocity-gradient relations. The weir analog predicts a sequence of extra stretching-steeper surface slope-less stretching in a down-glacier direction. The submerged-boulder, or sandpaper-patch, analog predicts flowlines that tend to avoid sticky spots. Combination examples are also possible.
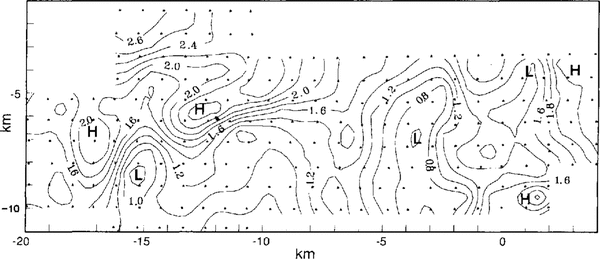
Weir-type obstructions arc sought using Figures 2 and Figures5. There are several extra stretching-less-stretching pairs in the longitudinal strain rates. None of these corresponds to steepened down-flow slopes. This type of sticky spot is not evident.
The boulder type of obstruction is sought using Figure 6. Arrows indicate the sense of flowline turning, as evident in longitudinal gradients in transverse velocity, ∂ut /∂l. There is a small regional value of flowline turning due to a general leftward turning which has not been removed. Stippling marks positions of possible “boulders” or “sandpaper patches” which could cause the deviations. There are at least two such obstructions, one being under “up-glacial knoll” and the other near the down-glacier end of “Drillers’ valley”.
Longitudinal strain rate (∂ut/ ∂l).Isoline interval is 0.2 x 10⁻³ a-1.Locations of relatively large and relatively small strain rates are labeled H (igh) and L (ow), respectively,

Flowline turning, longitudinal gradient of transverse velocity, (∂ut/∂l). Isoline interval is 0.5 x 10⁻³a-1. The sense of turning with respect to the regional pattern is indicated by arrows. Locations of possible “sandpaper patches” are shaded.

There is no evidence in the basal topography for “boulders” (Reference Retzlaff, Lord and BentleyRetzlaff and others, 1993; Reference Novick, Bentley and LordNovick and others, 1994). Rather, the bed under the grid is remarkably smooth. The obstructions are most probably of the “sandpaper-patch” variety, a region of extra-basal friction.
There does not seem to be a link between these suspected sticky spots and surface topography but this is not considered a problem. The topography over river boulders is not simple but depends on the precise shape of the boulder and how much water is routed over the boulder (and, in the case of water flow, also inertial effects).
Are there spatial variations in ice strength?
Two causes [or horizontal gradients in ice strength are anticipated. Both causes are due to the extreme rates of simple shear in the shear margins, which reach 0.055 a-1 (Reference Whillans, Jackson and TsengWhillans and others, 1993). Such shearing can form a preferred crystal-orientation fabric, raise ice temperature, or both. These effects can occur throughout the ice stream but most particularly at the shear margins. Reference Echelmeyer, Harrison, Clarke and BensonEchelmeyer and others (1992) discussed such effects in the margin of an outlet glacier in Greenland. There is evidence that suggests that the shear margins in the WAIS can laterally migrate by large steps (Reference Bindschadler and VornbergerBindschadler and Vornberger, 1990; Reference Merry and WhillansMerry and Whillans, 1993). This would lead to neighboring zones in the ice stream having experienced different amounts of shearing and strain heating. The strain-heat signature can persist for a long time but fabrics may change due to further strain.
Such zones may be expressed in the surface relief Ice streams often contain linear traces (called flow traces, flow stripes, flowlines and streamlines). Flow traces are believed to be structural relics being advected down-glacier from shear margins (Reference Merry and WhillansMerry and Whillans, 1993).
Both flow traces (Reference Merry and WhillansMerry and Whillans, 1993) and longitudinal ridges (Reference Vornberger and WhillansVornberger and Whillans, 1986 I have been found elsewhere on Ice Stream B. However, no such continuous linear features are in the topography of Figure 2.
A different approach is to search for strength variations by studying the relationships among velocity gradients. Anomalously warm ice would be soft to all stresses and would lead to locally large velocity gradients for all components. A crystal-orientation fabric would result in areas stiffer to stress in one direction but softer in others.
The test entails comparing the strain-rate response of different parts of the ice stream to the same stress. For this test, one must select stresses that vary slowly across the grid. Lateral compression, which influences ∂ut /∂l is presumably exerted from the sides as the ice stream narrows. We expect transverse normal stress to be nearly constant in the t direction, except perhaps for special effects due to sticky spots. Lateral drag, which influences ∂ul /∂t, similarly originates at the margins and it should be smoothly varying except for sticky spots. Other stresses are expected to vary more complexly. For example, if the ice contains transverse variations in strength, stronger filaments may act as stress guides, concentrating the longitudinal normal stress.
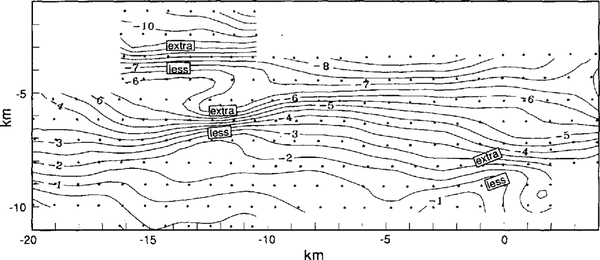
Figures 4a and Figures7 are searched for correlations between transverse normal strain rate, ⋵tt, ignoring sign, and inflections in the transverse gradient of longitudinal velocity, ∂ul /∂t. As noted in Figure 7, the inflections indicate “extra” and “less” shearing beyond that due to steadily faster shearing closer to the ice-stream margin. Where  is large and there is extra lateral shearing, warm ice may be indicated. Where they anti-correlate (large
 and less ∂ul /∂t, or small
 and extra ∂ul /∂t), crystal-orientation fabric may be indicated. Two positive correlations are found at(x, y)≈(-13,-4)km and(x, y)≈(-12,-7)km and one negative correlation is found at(x, y)≈(0,-9)km. However, no consistent pattern emerges and so there is no conclusive evidence for strength variations in the ice stream
Lateral shearing, transverse gradient of longitudinal velocity,(∂ul/∂t). Isoline interval is 0.5 x 10⁻³a-1. Sites of “extra” (more negative) and “less” (nearer zero) shearing compared to a simple variation are noted.

Conclusions
The use of GPS for surveying strain grids presents new possibilities for studies of the kinematics and mechanics of ice flow. Previously, surface slope was difficult to determine with adequate relative precision. Now, precision is so good that even the daily variability in snow elevation due to firn settling and wind action are observable. Previously, horizontal strain-rate measurements were time-consuming and were made awkward by the need for line-of-sight connections between stations and clear weather without strong wind. Those requirements no longer apply. Moreover, with GPS an entirely new type of measurement, relative vertical ice velocity, is possible for large regions. The ease, speed and precision of GPS, and the availability of vertical velocity, vastly exceed the capabilities of older techniques.
The next development must be in interpretative technique. Much of the present contribution compares strain-rate patterns predicted by popular models with strain rates observed on the ice stream. The results are dominantly negative. This indicates the inadequacy of the common suggestions and points to the need for fresh interpetative strategies.
GPS surveying to determine precise vertical velocity shows that the majority of the surface topographic features are stationary waves, fixed with respect to the bed. This indicates that local basal processes are somehow responsible for their formation. The narrow surface valleys, constituting 25% of the studied area, are migrating. The reason is unclear but, since there is little basal relief, the cause may be that the sites of most effective basal lubrication are shifting. However, the reasons why different features are behaving differently is a mystery.
Reference Bindschadler and ScambosBindschadler and Scam bas (1991) assumed that long wavelength features, such as those in Figure 2, are fixed in space and used them to co-register sequential satellite images. It seems that this assumption is not entirely secure. If their method was applied to this site, the relative-image registration would be in error due to the migration of the valleys.
On other studied glaciers, surface strain rates are dominated by the relaxation of the surface topography, which makes it difficult to infer deep stresses using surface measurements. The relaxation effect must be correctly modeled and removed. Removal of the relaxation effect does not seem to be necessary for Ice Stream B. The very large variation in transverse normal strain rates is primarily due to deep-seated processes. Coupled with the finding that most of the features are fixed waves, it should be possible to deduce the causes of these flow disruptions but, until now, we have been unable to do so.
Our first interpretative attempts were to determine whether the flow disruptions are like those observed on other glaciers. They are not. There are none of the weir-type sticky spots, with an along-flow more stretching-steeper slope-less stretching sequence. There is some evidence that the flow is “snaking” from side to side to avoid sandpaper-patch type obstructions but the evidence is not conclusive.
We had expected to find evidence for relict shear margins or deeper signatures due to fabric or temperature. However, there are no flow traces or longitudinal ridges evident in the topography. Also, there is no convincing evidence in the strain-rate patterns for hot stripes of especially warm ice or folia of ice with special crystal orientation. The lack of such features may be because the studied area is atypical, the site having been selected to be relatively crevasse-free. This site selection may have biased the study, so that such major structural contrasts are not found. The discovery that the strain rates are primary is important. They are neither merely due to topographic relaxation nor response to imprints from past events. They must emanate from depth.
Acknowledgements
GPS equipment was loaned by the U.S. National Science Foundation supported University NAVSTAR Consortium (UNAVCO). C. Goad (OSU), M. Johnson (UNAVCO) and P. Perreault (Trimble) provided important advice on GPS surveying. M. Darrah and other personnel at the UpB field camp provided close support. The comments of C.J. van der Veen, D. R. MacAyeal and C. R. Bentley are greatly appreciated. This research is supported by U.S. National Science Foundation grant DPP-9020760. Ms Hulbe is also supported by the Graduate Fellowships for Global Change program administered by the Oak Ridge Institute for Science and Education for the U.S. Department of Energy. This is Byrd Polar Research Center contribution No. 884.