Introduction
Basmati represents a diversified group of speciality rice known for its unique quality and consumer acceptability across the globe. The long slender grains, soft and fluffy texture of cooked rice and overall aroma are the hallmark features of basmati rice (BR) (Nagaraju et al., Reference Nagaraju, Kathirvel, Kumar, Siddiq and Hasnain2002; Vemireddy et al., Reference Vemireddy, Archak and Nagaraju2007; Singh et al., Reference Singh, Singh, Mohapatra, Krishnan and Ellur2018). Basmati rice features a kernel length:breadth ratio of more than 4.4 and the kernel length after cooking is >12 mm with high elongation ratio. Basmati rice varieties have intermediate to high amylose content (AC), low to intermediate gelatinization temperature and low gel consistency (GC) (Khush and de la Cruz, Reference Khush and de la Cruz1997; Shobha Rani et al., Reference Shobha Rani, Pandey, Prasad and Sudharshan2006).
It has also been observed that BR has an optimized expression of quality traits when grown in niche-specific regions of the North Western foothills of the Himalayas in the Indian Sub-continent (Singh et al., Reference Singh, Singh, Mohapatra, Krishnan and Ellur2018). These traits serve as main qualifying factors to obtain a geographical indication proclamation for BR. Earlier studies have categorized basmati as a distinct and separate group different from indica and japonica rice (Vairavan et al., Reference Vairavan, Siddiq, Arunachalam and Swaminathan1973). Based on genetic relationships, Nagaraju et al. (Reference Nagaraju, Kathirvel, Kumar, Siddiq and Hasnain2002) classified the rice into traditional basmati (TB), evolved basmati and non-basmati (NB) types using simple sequence repeats (SSRs) and fluorescent-labelled inter-SSR polymerase chain reaction (PCR) markers, which indicate that TB is significantly different from NB rice.
There have been sustained efforts to improve the yield of BR. However, there has not been much success, owing to the lack of genetic variability present in the basmati germplasm. Therefore, BR was hybridized with high-yielding NB genotypes, leading to the development of 20 aromatic rice varieties genetically close to TB rice types. Convergent breeding strategies over a period of time have led to the development of Pusa Basmati 1, a high-yielding semi-dwarf basmati type variety (Siddiq et al., Reference Siddiq, Vemireddy and Nagaraju2012), followed by the Sugandh series of basmati varieties that were developed from Pusa Basmati 1 as one of the parents in cross-combination. Current molecular interventions have been used to further evolve the desirable and existing phenotypic architecture of elite and commercially available basmati variants with high in-built resistance to diseases, particularly rice blast (Samal et al., Reference Samal, Pote, Krishnan, Singh, Salgotra and Rathour2019).
In certain pockets of temperate ecology of Jammu and Kashmir, PS3 emerged as a promising competitor to the commonly grown rice varieties viz., K 39, Jhelum, Shalimar rice 1, Shalimar rice 2, Shalimar rice 3 and Shalimar rice 4, with respect to better quality and premium market value. After the initial introduction, PS3 adapted fairly to the growing climatic conditions of the temperate Himalayas. However, at the productivity level, its performance remained poor and marginalized at only 4 t/ha, deviating from its potential of 5–6 t/ha under sub-tropical conditions. This comparative difference in the yield of PS3 across climatic regimes is assumed to be due to physiological manifestation and attributed mainly to the difference in growing degree days (GDD). The direct introduction of PS3 in rice growing areas of Kashmir, India was not feasible owing to the late maturity of the variety which turns out to be bottle neck not only to the realization of high grain yield per se but also to achieve the expected quality of milled rice. In order to address these core bottlenecks, the present investigation was planned with the objective of identification and developing early-maturing BR variants suitable for the prevailing conditions in the temperate Himalayas, with lower GDD requirements.
The process of natural and directed selection lead to a distinct change in the adaptation of original PS3 under temperate conditions, which ultimately lead to the evolution of diverse phenotypic variants that have presumably appeared due to the release of cryptic variation (i.e. the part of genetic diversity that has the potential to affect the phenotype but is not expressed under the current genotypic or environmental conditions) in non-traditional areas of basmati cultivation. The effective secondary selection of these promising phenotypic variants from a homozygous/uniform population of PS3 led to the development of basmati variant SKUA 494. Over a period of testing and evaluation across the niche areas of the valley, SKUA 494 performed better than PS3 in terms of yield and flexibility in the time of its sowing. SKUA 494 shows early maturity over PS3, by 12–15 days, which is attributed as a primary factor for its successful cultivation under cold temperate conditions. The newly developed BR SKUA 494 was further evaluated under long-term programmes for yield and quality traits over years and locations to ensure the suitability of this genotype for cultivation in wider areas. The variety developed is a novel BR variant that has opened a new avenue for basmati cultivation in non-traditional areas.
Materials and methods
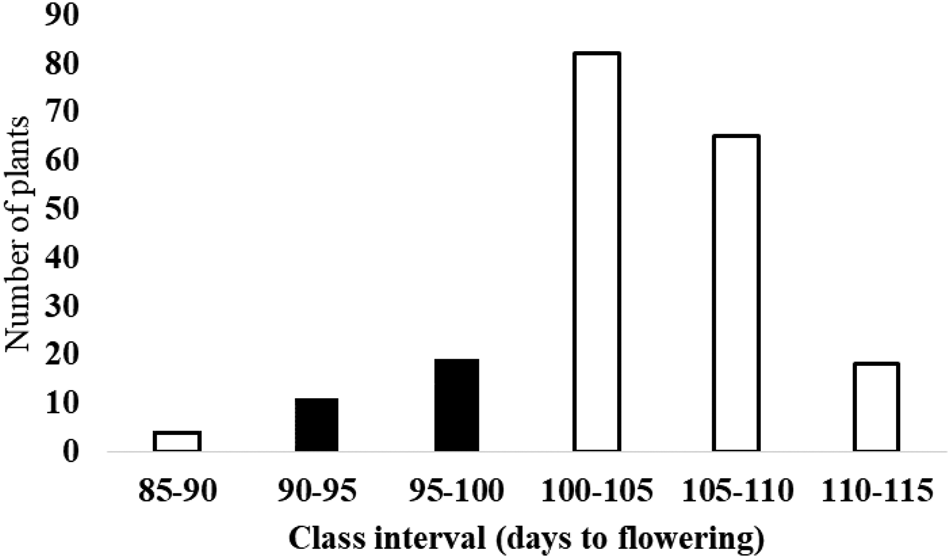
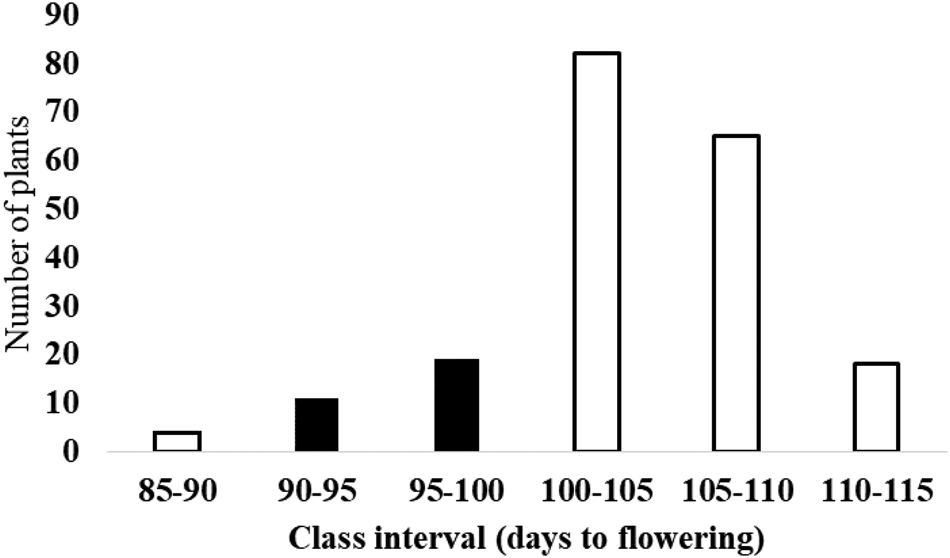
Initial evaluation experiments were conducted at the Mountain Research Centre for Field Crops (MRCFC, 33°70′N, 75°10′E, 1590 m asl) in Khudwani, Sher-e-Kashmir University of Agricultural Sciences and Technology of Kashmir, India during 2012 with the planting of a base population of Pusa Sugandh 3 (PS3) on an area of 600 m2. It represents a cold temperate location in the northern region of the Himalayas, where the source of irrigation is melting snow. The temperature during Kharif (autumn) season ranged from 25 to 35 °C with an annual precipitation of 80–95 cm. The development of an early crop variant is desired in the region due to persistent cold conditions that limit the window of optimum growing conditions for rice. The grid plot technique was followed to exercise plant selection for earliness in each sub-plot or grid in the base population of PS3. Ten grids each measuring 2.5 × 2.0 m and comprising 165 hills (plants) were randomly marked and selected from the base population of PS3. From each grid, 20 plants were randomly selected (selection intensity of 12%) and tagged at the tillering stage (growth stage 3 as per the Standard Evaluation System for Rice (IRRI, 2002)). The flowering date for tagged plants was recorded when panicle emergence was about to complete. Due consideration was given during the selection of early flowering variants in each grid to retain all other traits of the progenitor population based on distinct visual characters of PS3. The number of days taken for flowering was divided into six classes ranging from a minimum range of 85–90 days to a maximum of 110–115 days (Fig. 1). Rice plants from all the grids which flowered in the class interval of 90–95 and 95–100 days were selected and the rest of the plants, falling into other classes, were discarded. The tagged plants of both classes were harvested individually (30 plants in total) and later planted as a panicle to rows during Kharif 2013. They were designated as K1416-12-1, K1416-12-2, K1416-12-3 and so on, with the last one designated as K1416-12-30. Progenitor rows were used as controls and the top selections were identified. The selections were advanced under observation row nurseries while considering the top selection of only eight progeny rows out of 30 (26% of total progenies) that were individually harvested, bulked and seed samples prepared for the next year of testing. Later, some of these selections were renamed by adding the prefix SKUA, such as SKUA-417(K1416-12-1), SKUA 494(SKUA1416-12-4), SKUA422(K1416-12-14), SKUA423(K1416-12-17) and SKUA 419(K1416-12-21). The entries (as pure line selections from PS3) along with their progenitor PS3 and Pusa Basmati 1509 (PB-1509) as controls were evaluated as a preliminary yield trial during Kharif season of 2014. Each entry was evaluated in a net plot size of 10 m2 with three replications in a randomized complete block design adopting the crop geometry of 15 × 10 cm. The same set of entries including two controls were subsequently evaluated as an initial varietal trial during Kharif season of 2015. This was followed by advanced varietal trial I (AVT-I) and advanced varietal trial II (AVT-II) during Kharif seasons of 2016 and 2017, respectively, following the same specifications of crop geometry, plot size and field design as used in the preliminary yield trials.
Selection strategy followed in the base population of Pusa Sughand 3 (□: Plants not selected; ■: Plants selected).
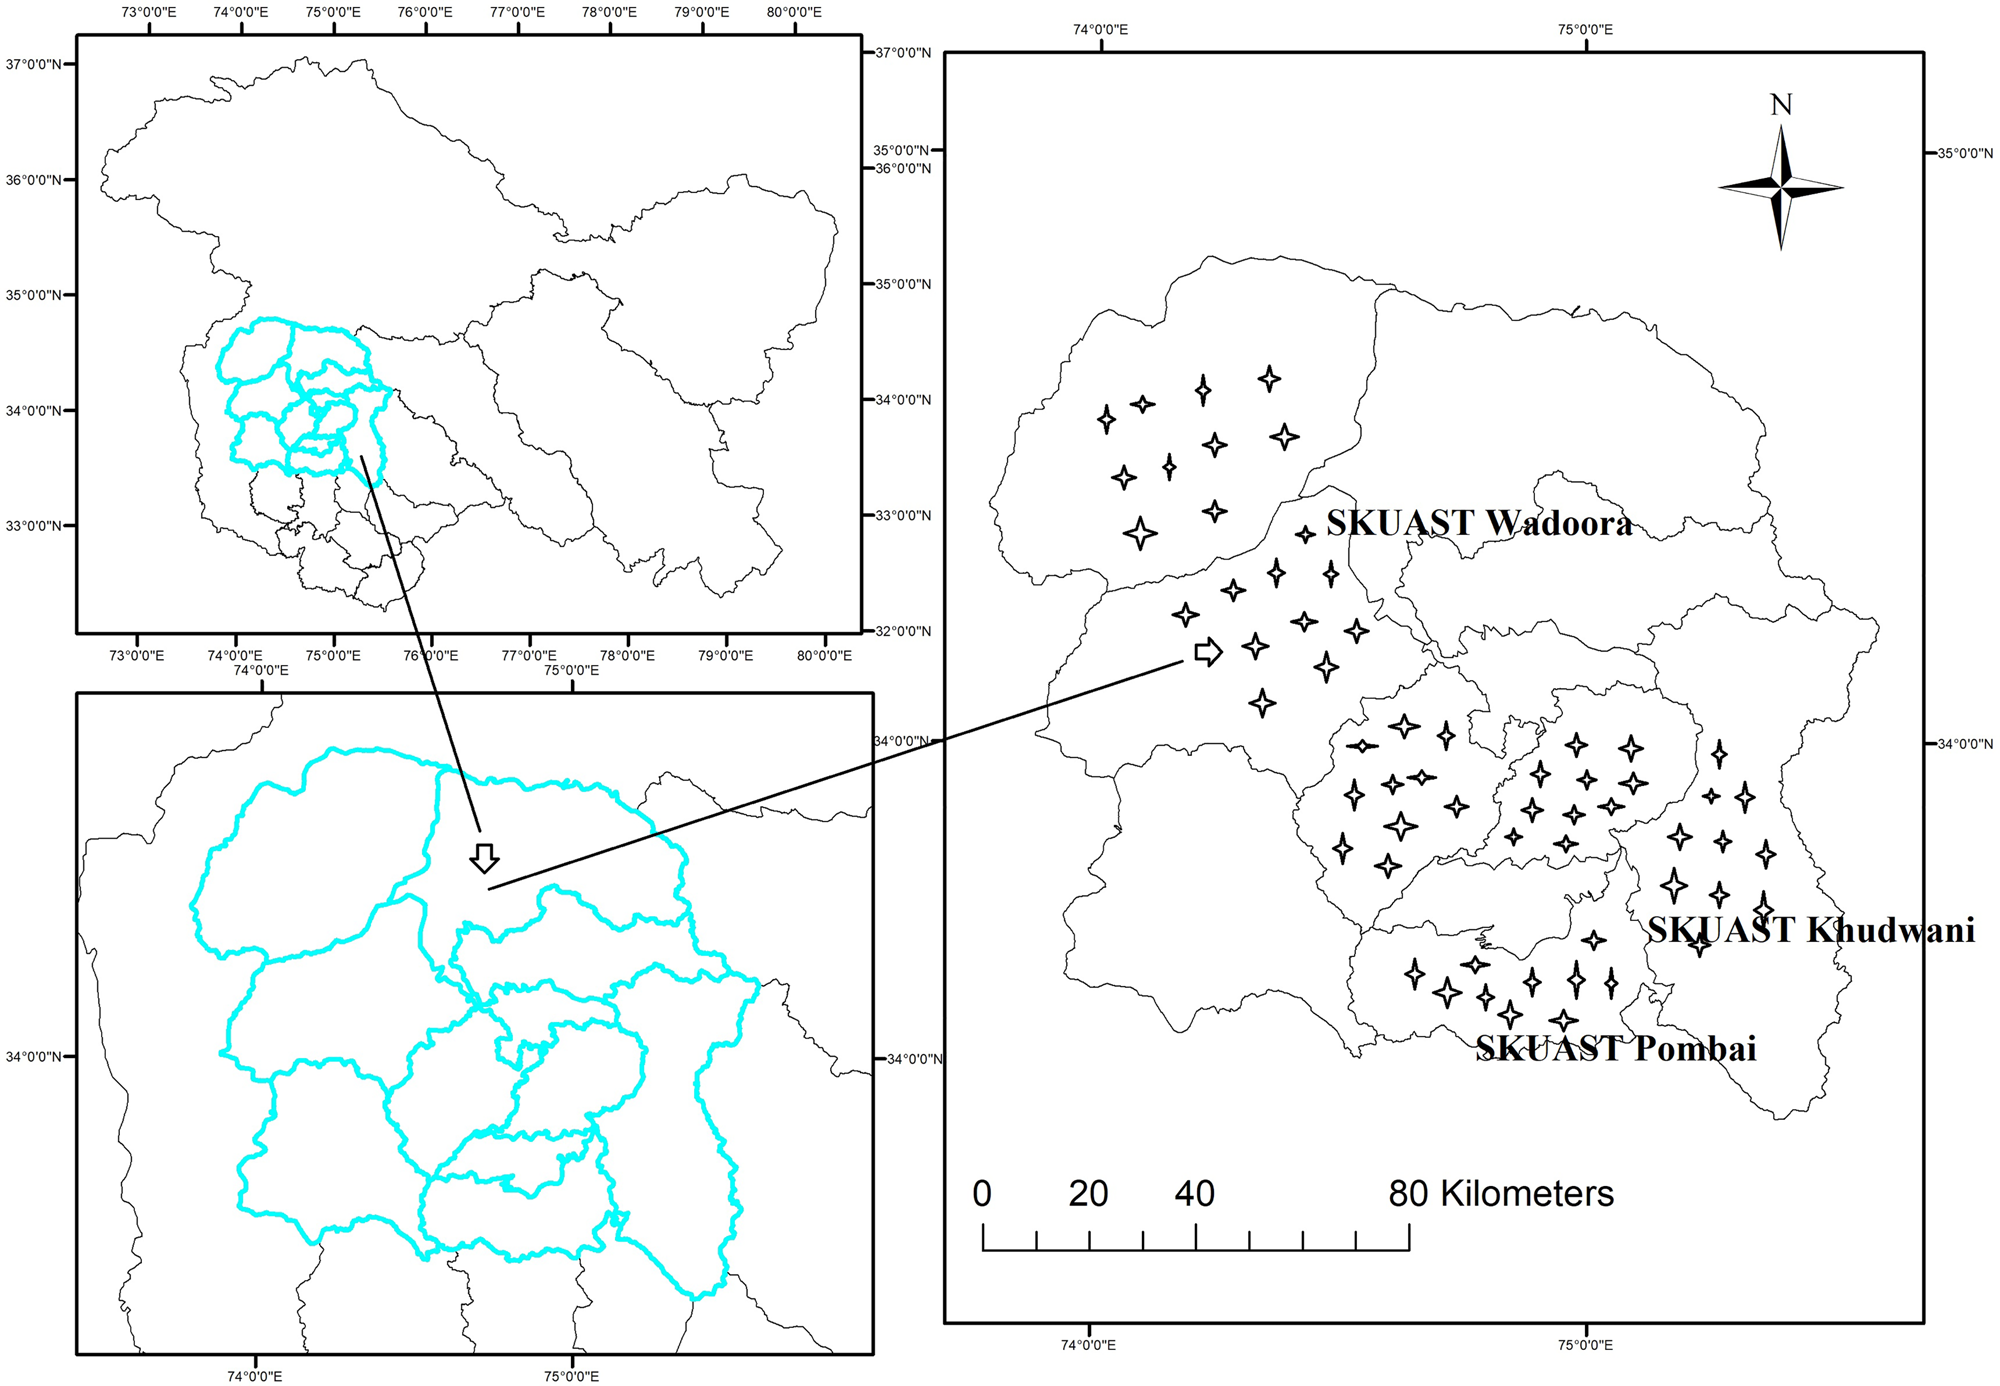
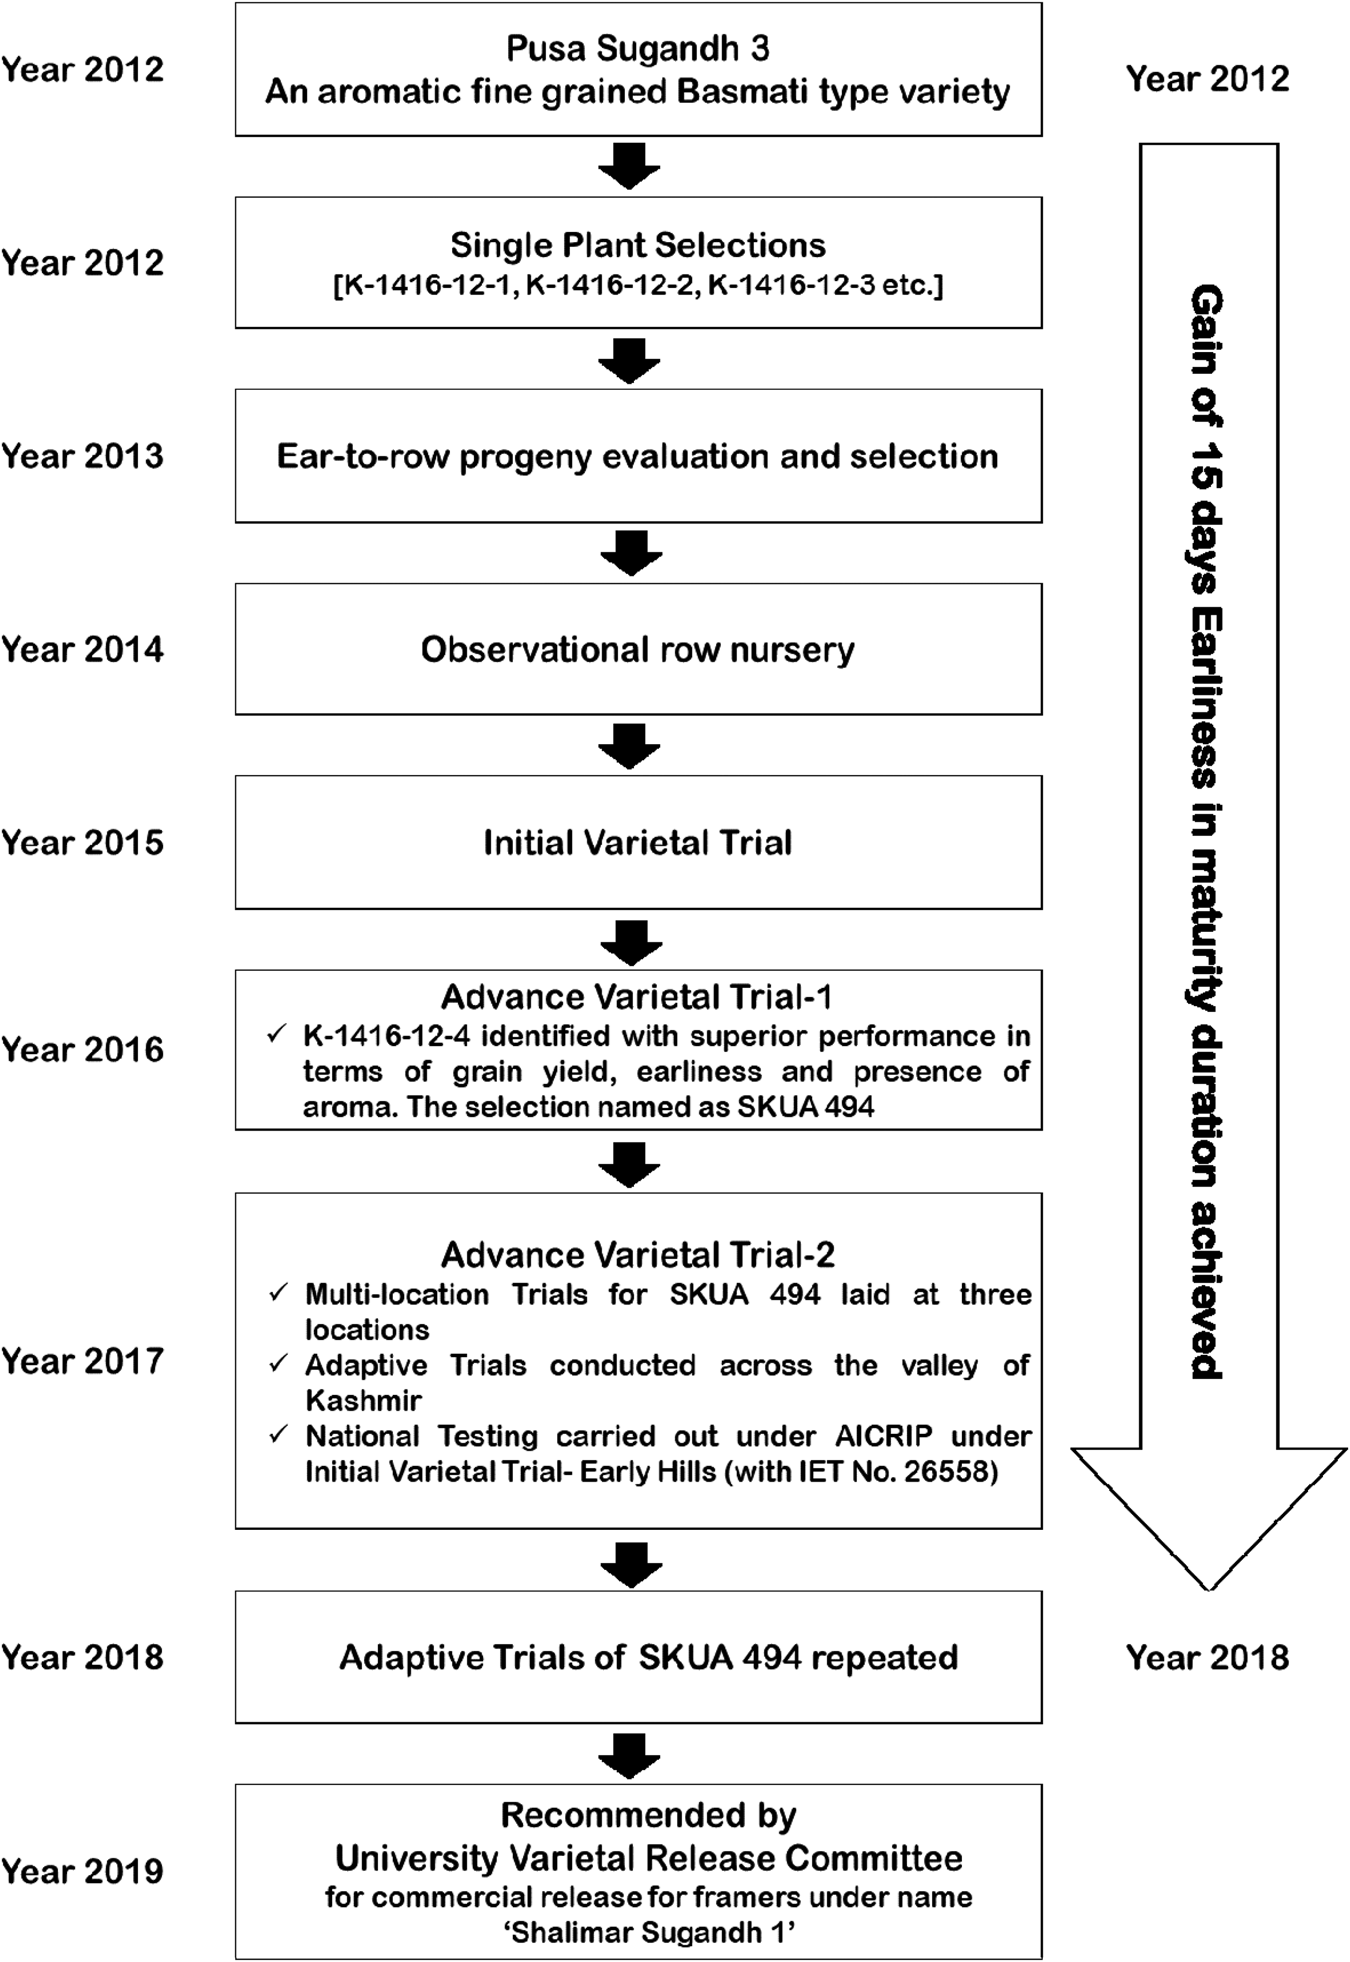
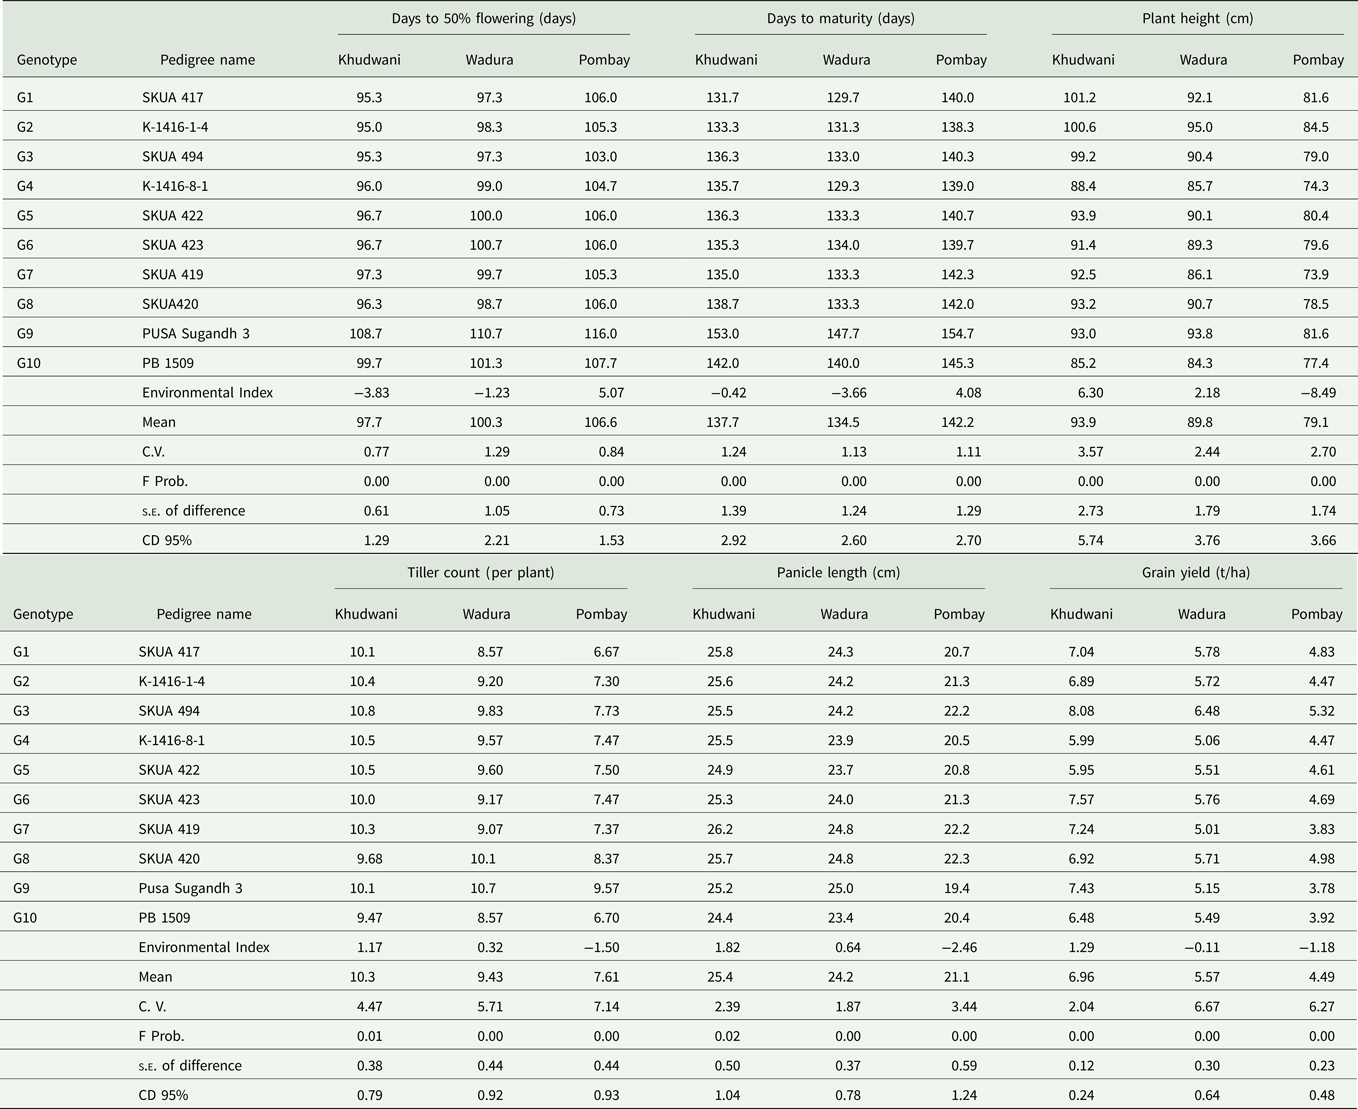
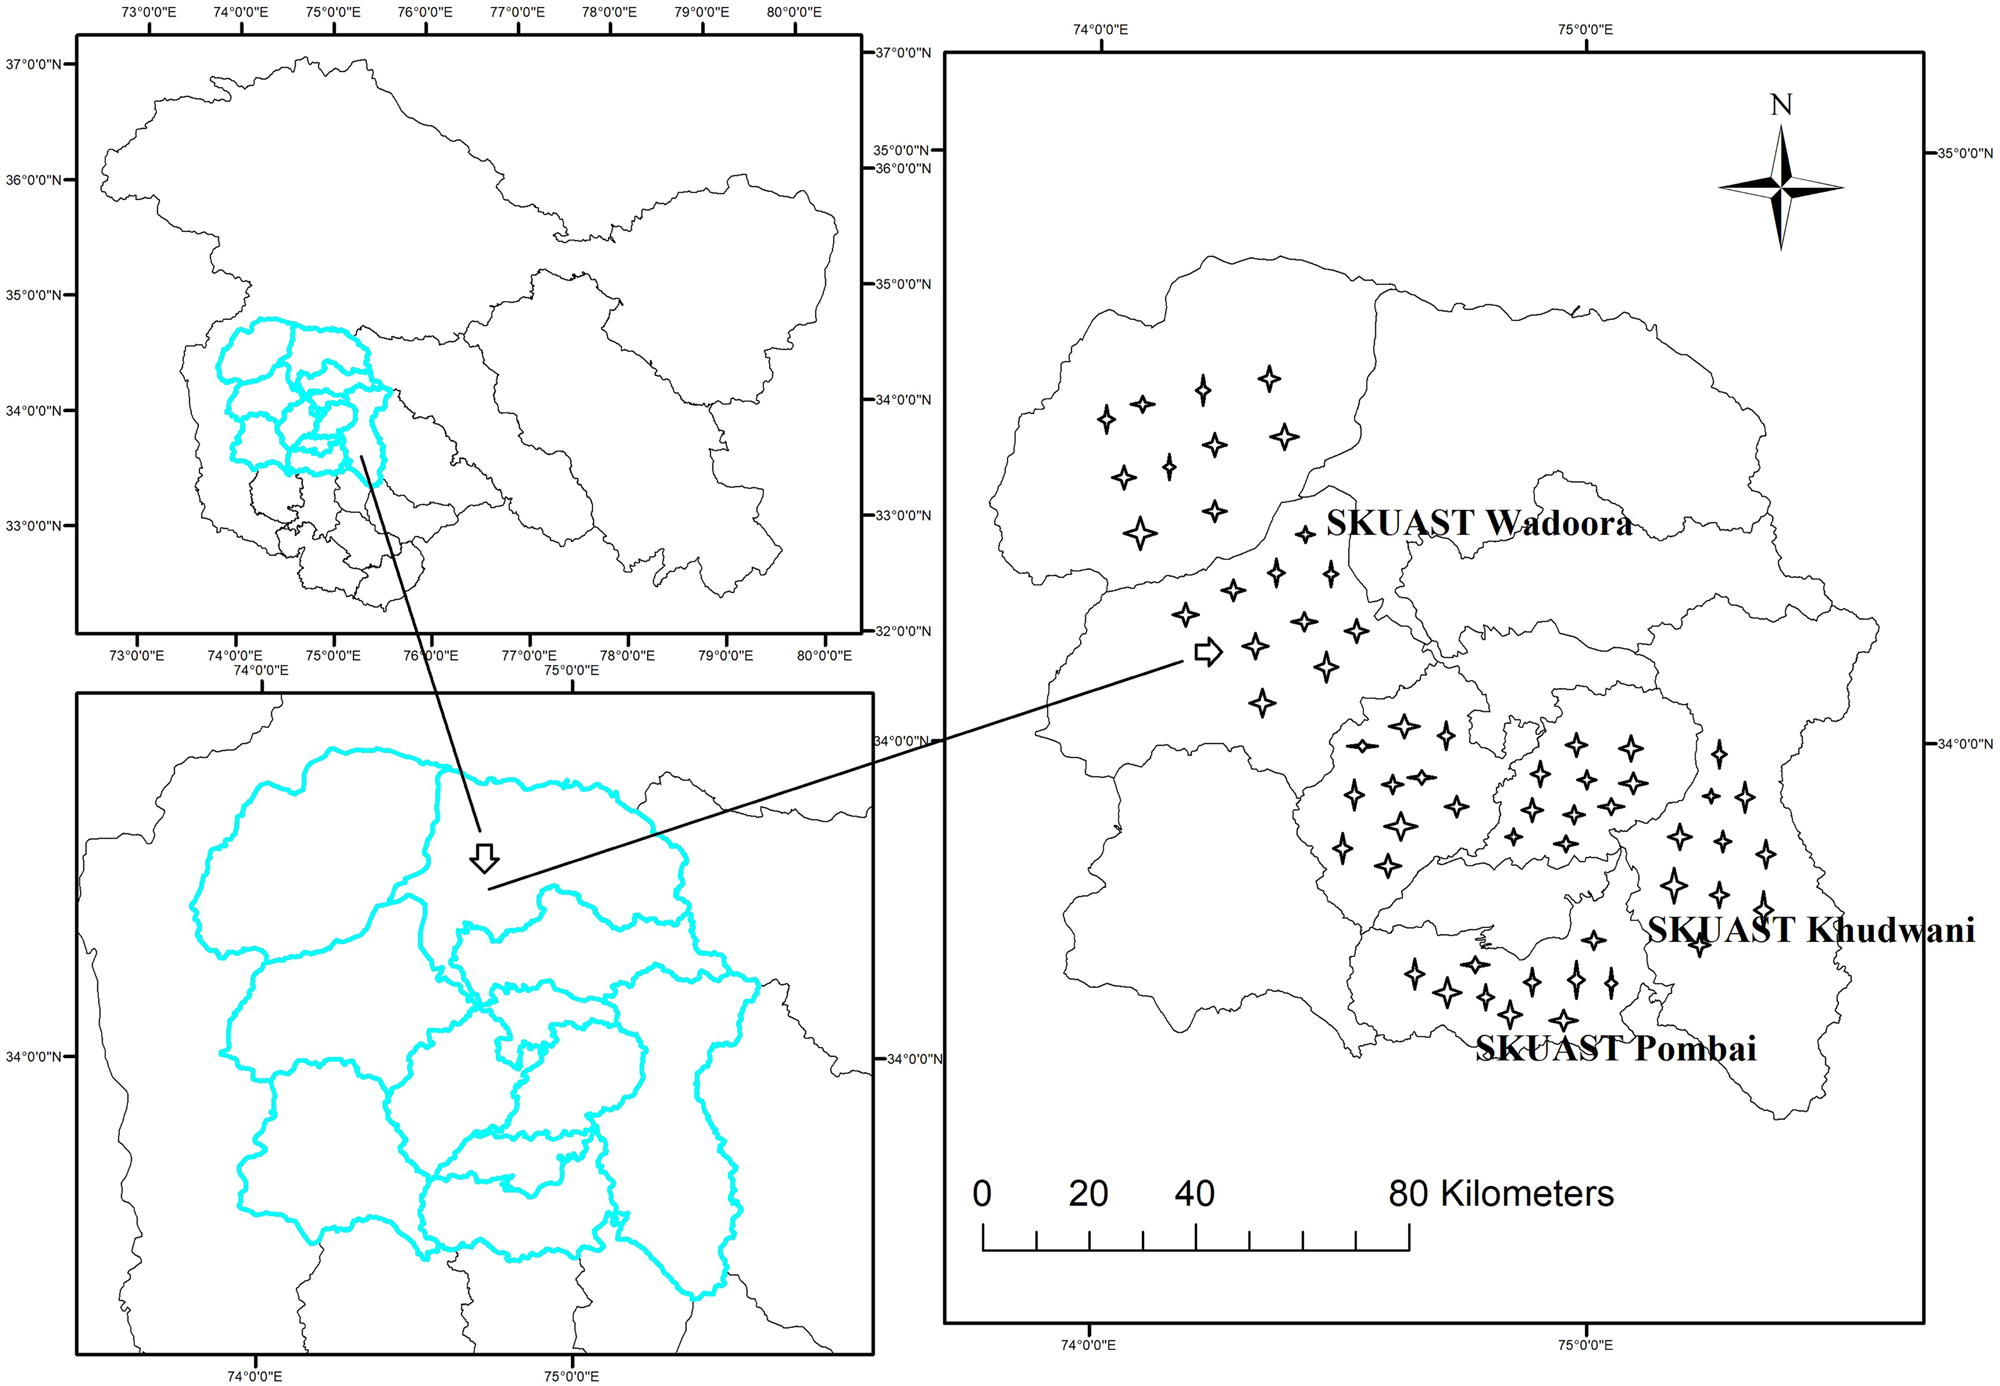
Multi-location trials were also conducted during Kharif 2017 at three locations of Kashmir valley, viz. Khudwani, Pombay (34.1°N, 74.8°E, 1960 m asl) and Wadura (34°N, 74°E, 1580 m asl) with the objective of identifying the most promising and stable selected line of PS3 for cultivation and adaptation in the cold temperate region of Kashmir Himalayas. Data were recorded consistently for six agronomic traits, namely: days to 50% flowering, days to maturity, plant height (cm), tiller count (per plant), panicle length (cm) and grain yield (t/ha). The most promising and stable derivative of PS3 was evaluated under national testing during 2017 across different hill zones of India within an altitudinal range of 800–1850 m asl. Regional demonstration-cum-adaptive trials were conducted to test the performance of the most promising line in six districts of the valley during Kharif seasons of 2017 and 2018 while using an area of 500 m2 at each selected location. Ten such trials were carried out successfully, covering 60 villages within a geographical boundary of six districts of the valley (Fig. 2). Observations were recorded for two important traits, i.e. grain yield and days to maturity. The selection-cum-breeding strategy followed to develop this basmati variant from PS3 is depicted schematically in Fig. 3. Post-harvest and cooking quality traits of the selected line were analysed using standard protocols along with its progenitor for the purpose of comparison and to validate the qualifying criteria for the newly developed basmati variant.
Map showing the distribution of study sites in Kashmir Himalayas, India.
Work flow of the breeding procedures and advance testing carried out during the development of new basmati rice variety SKUA 494 (Shalimar Sughand 1).

Physiological parameters such as cumulative GDD were determined by summing the daily mean temperature above a base temperature, expressed in degree days. For Oryza species, T base is considered to be 10 °C (Ghadekar, Reference Ghadekar2001). This was determined using the following formula suggested by Nuttonson (Reference Nuttonson1995).

where T max is the daily maximum temperature (°C), T min is the daily minimum temperature (°C) and T base is the minimum threshold/base temperature (°C).
Data analysis
Data analysis was conducted for the assessment of genetic variation and stability of genotypes across the environments using the Windostat program (Indostat services, v.9.2, http://www.indostat.org/). Multi-panel boxplots, density plots and scatter plots were generated using the baseline core graphic features of R and R studio (v.1.0.136, The R Foundation, https://www.r-project.org/).
Molecular analysis
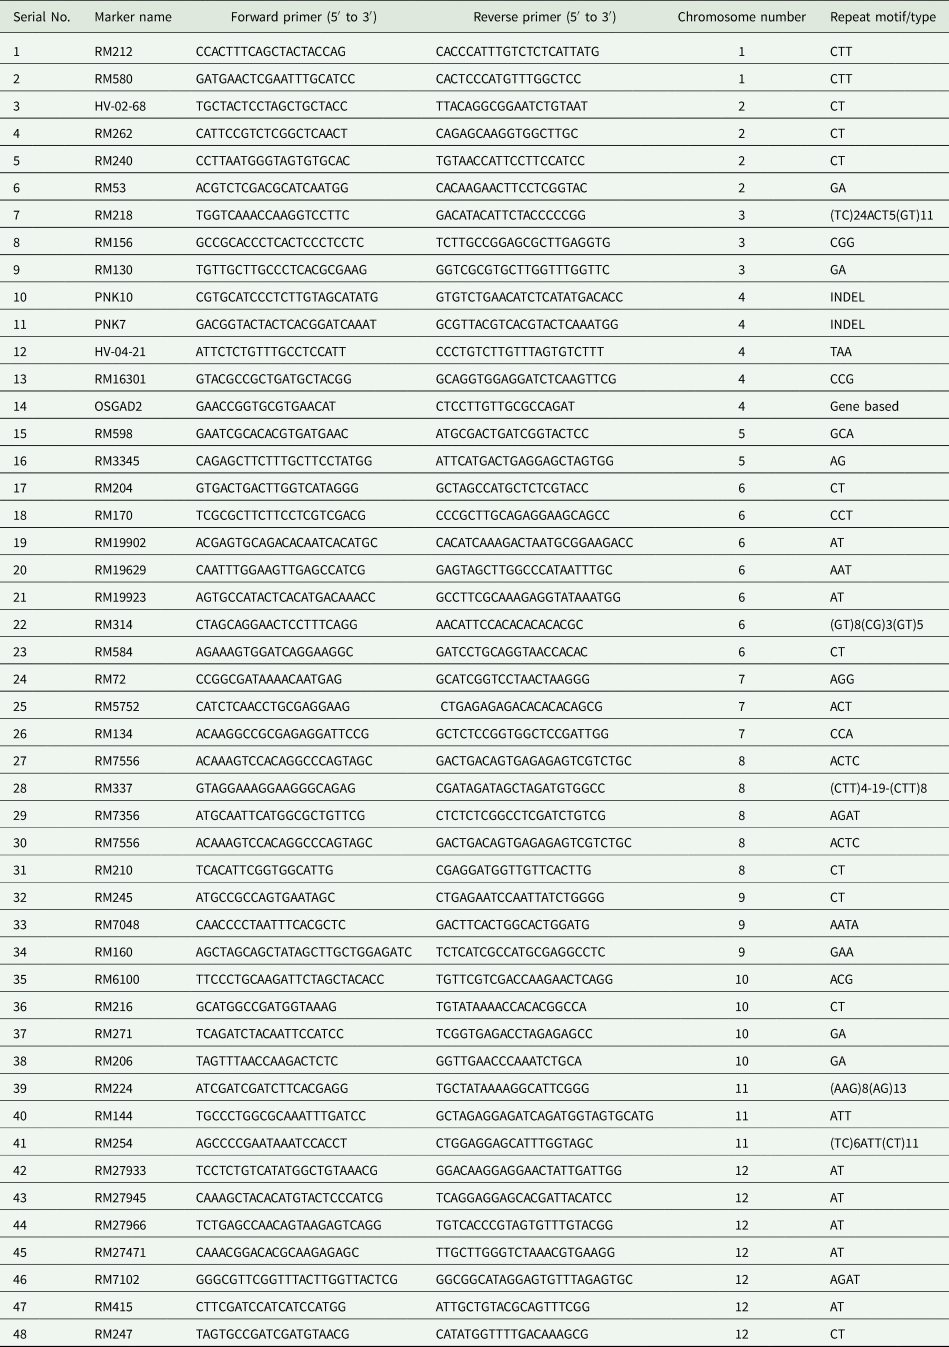
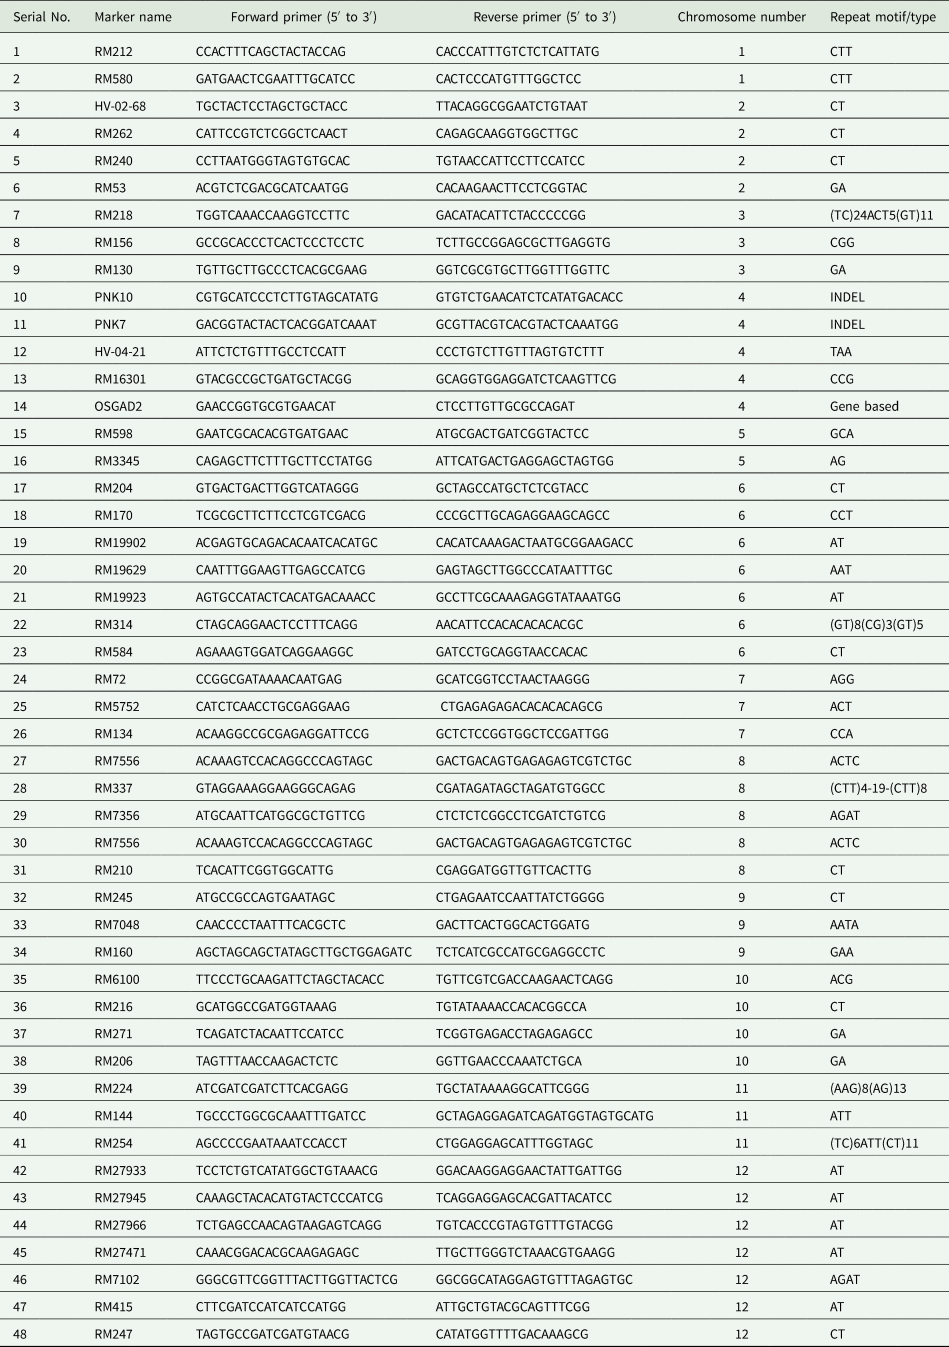
The genotypic differences between the most promising selections and their progenitors were assayed using SSR and sequence tagged site (STS) molecular markers. Genomic DNA of the two sister lines SKUA-494 and SKUA-420 along with their parental line Pusa Sugandh 3 was extracted from fresh, healthy and young leaf tissue of 14-day-old seedlings following the Cetyl-Tri Methyl Ammonium Bromide (CTAB) method with certain modifications (Murray and Thompson, Reference Murray and Thompson1980). The DNA was purified by adding RNase (10 g/100 ml) to the sample at the rate of 3 µl/100 ml of crude DNA: DNA quantification was performed using 0.8% agarose gel. The λ uncut DNA was used as a comparison and the final concentration was adjusted to ~50 ng/μl. Polymerase chain reaction master mix (2X) (ThermoFisher Scientific, Waltham, MA, USA), which includes Taq DNA Polymerase (0.05 U/μl), reaction buffer, 4 mm magnesium chloride and 0.4 mm deoxynucleoside triphosphate and 5 pmol each of forward and reverse primers, was added to the DNA in a reaction volume of 10 µl. The list of markers assayed along with chromosomal locations and primer sequences is given in Table 1.
List of markers assayed along with chromosomal locations and primer sequences
Polymerase chain reaction was performed in a thermal cycler (TaKara, Japan) with initial denaturation at 94 °C for 5 min, with varying cyclic regimes and final extension of 10 min at 72 °C. The amplified products were resolved on 1.5–3.5% agarose gel, depending upon the primer used. The gel slabs were visualized and documented in gel documentation system (Bio-Rad Laboratories Inc., Hercules, CA, USA).
Results
Distribution pattern of test genotypes with respect to different traits
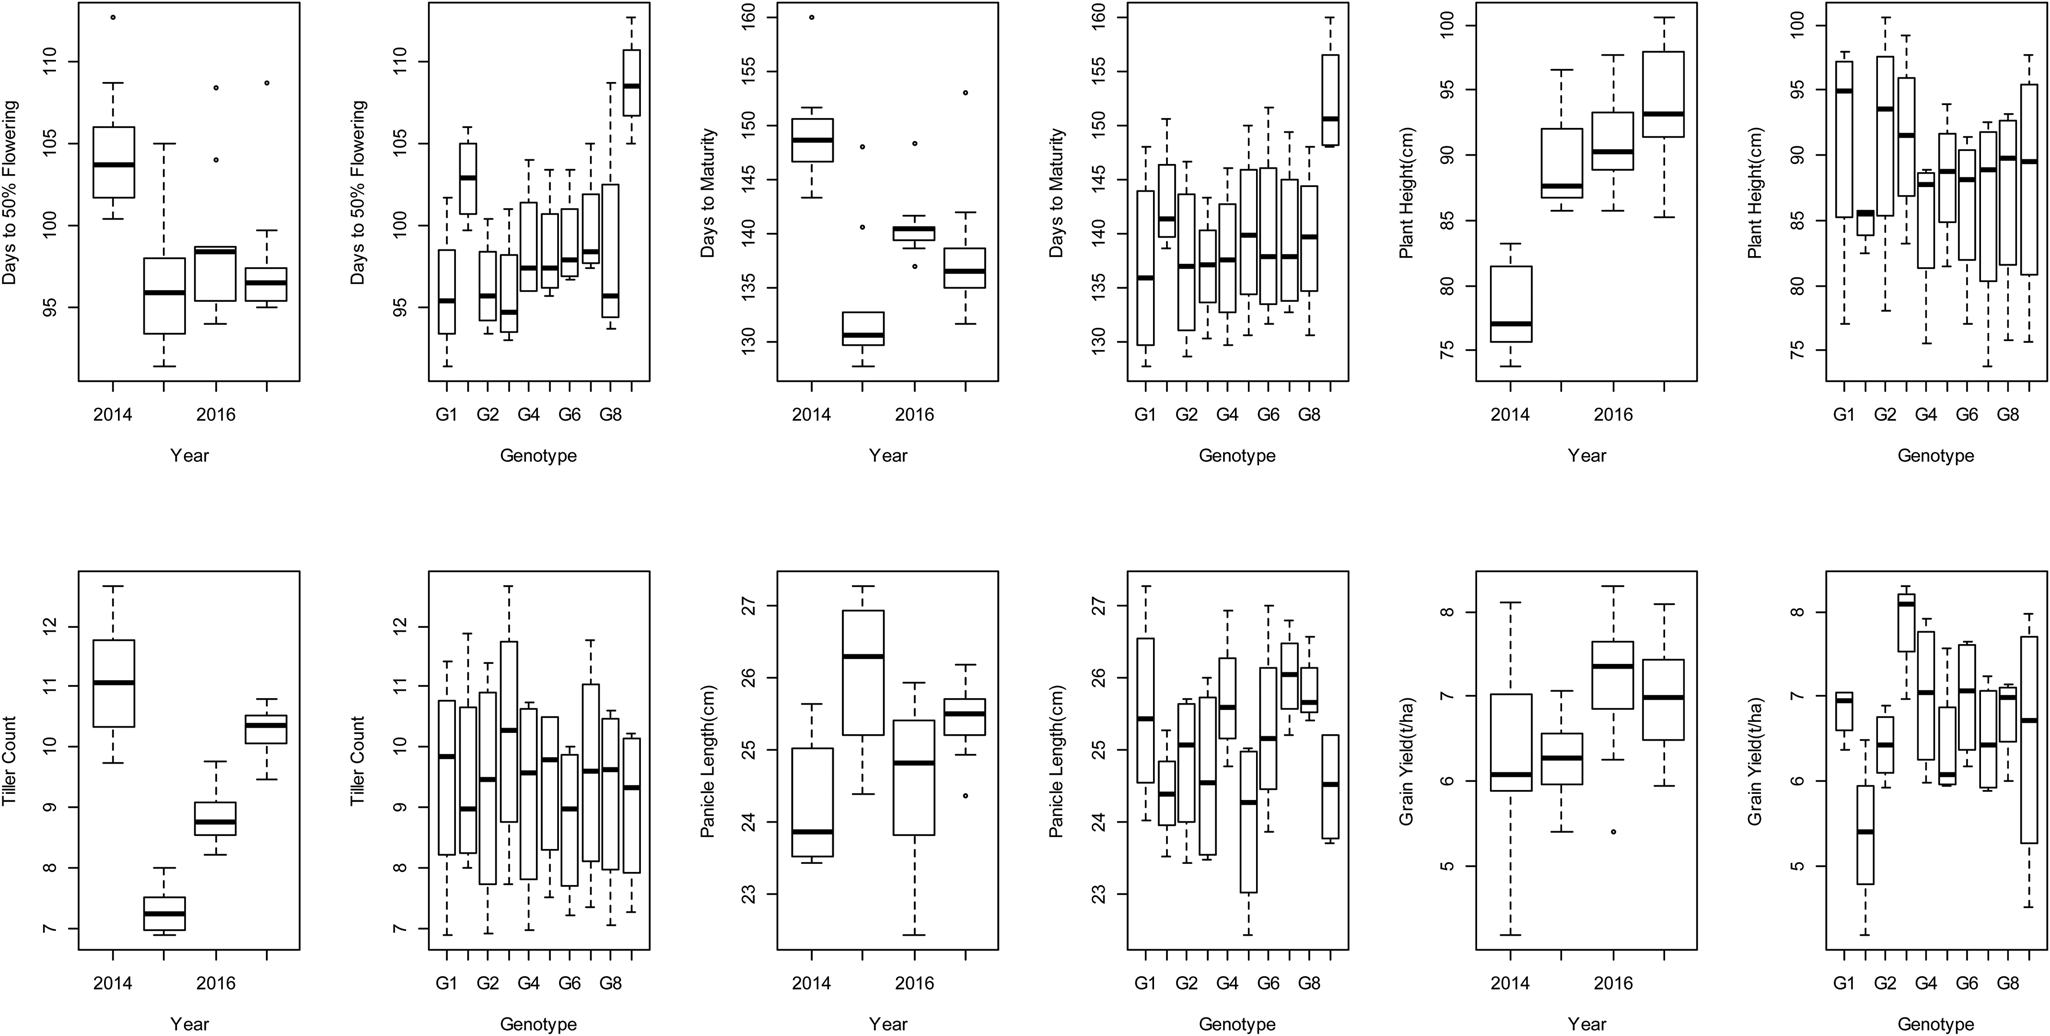
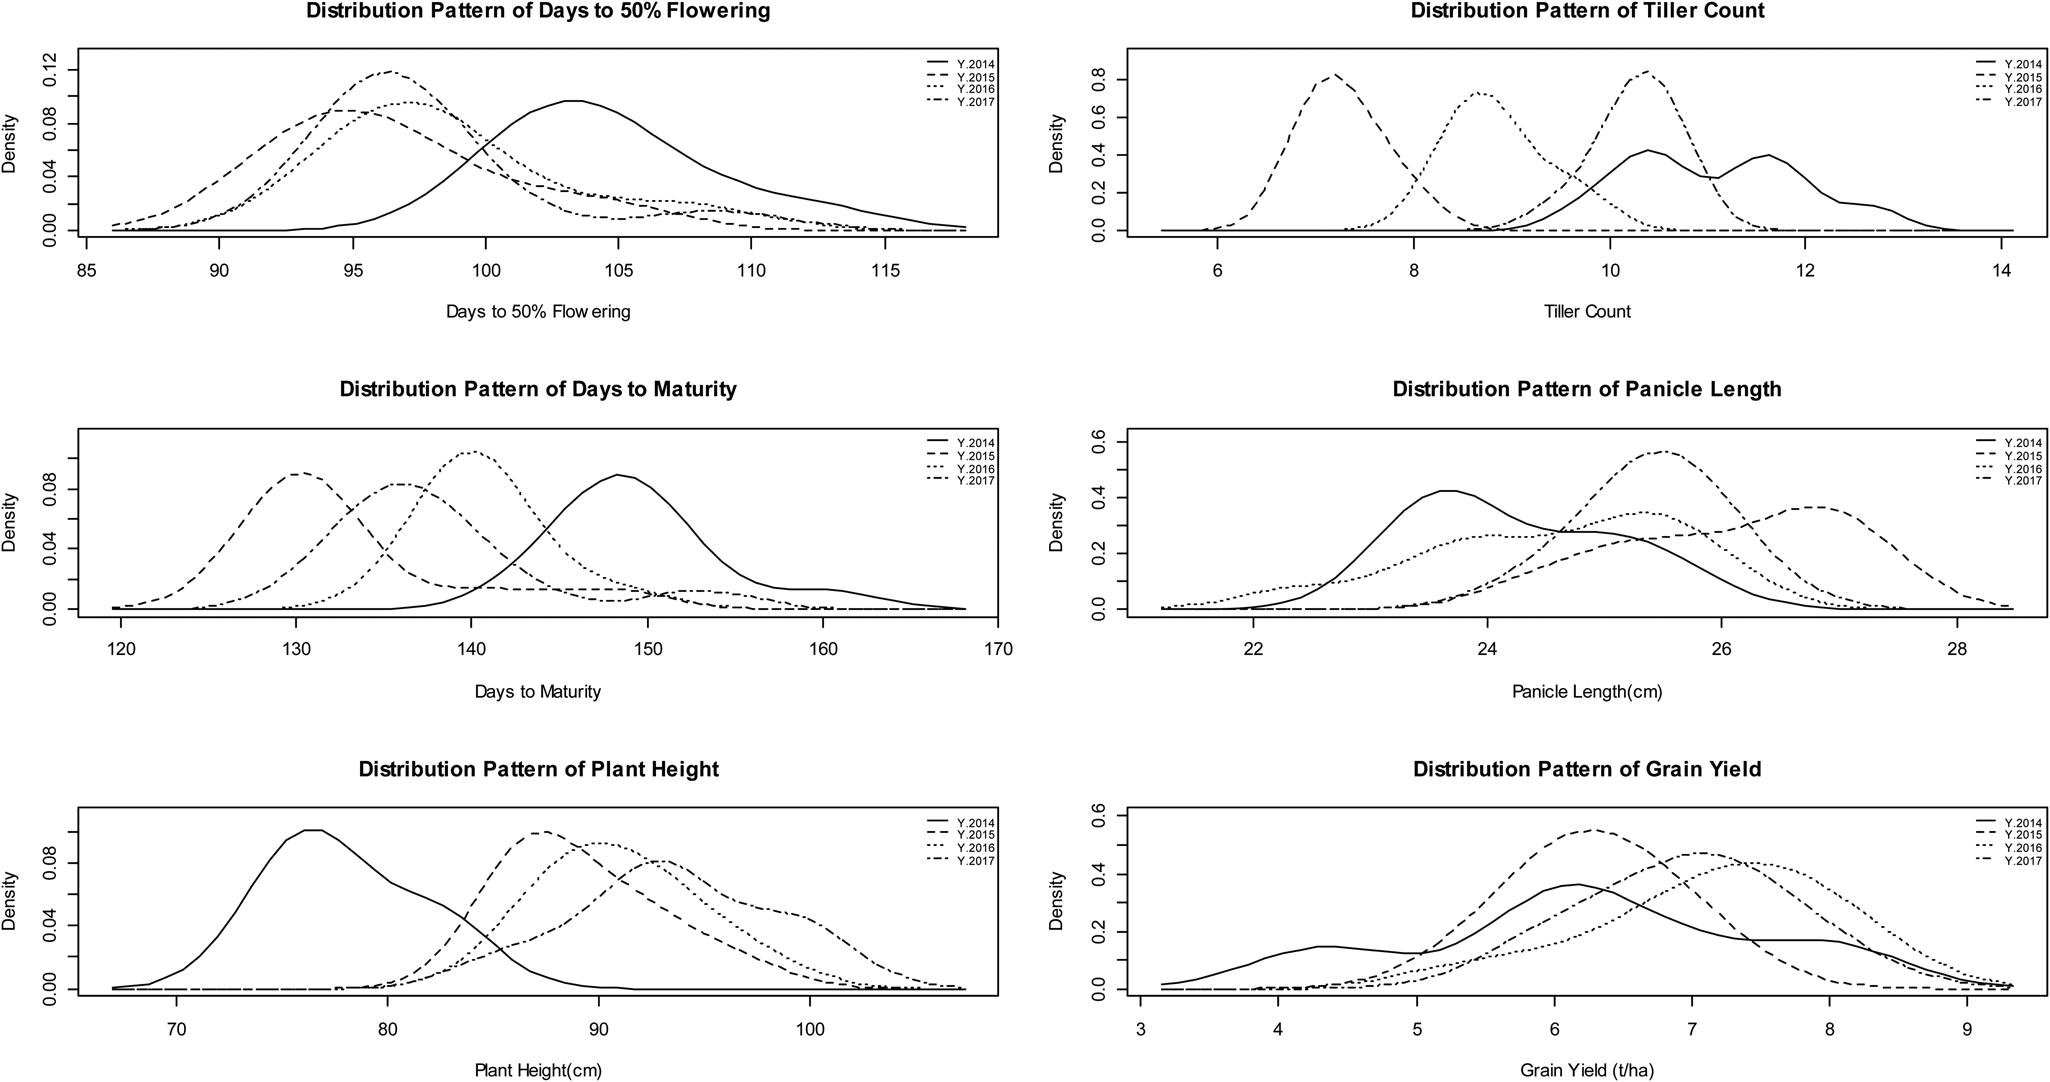
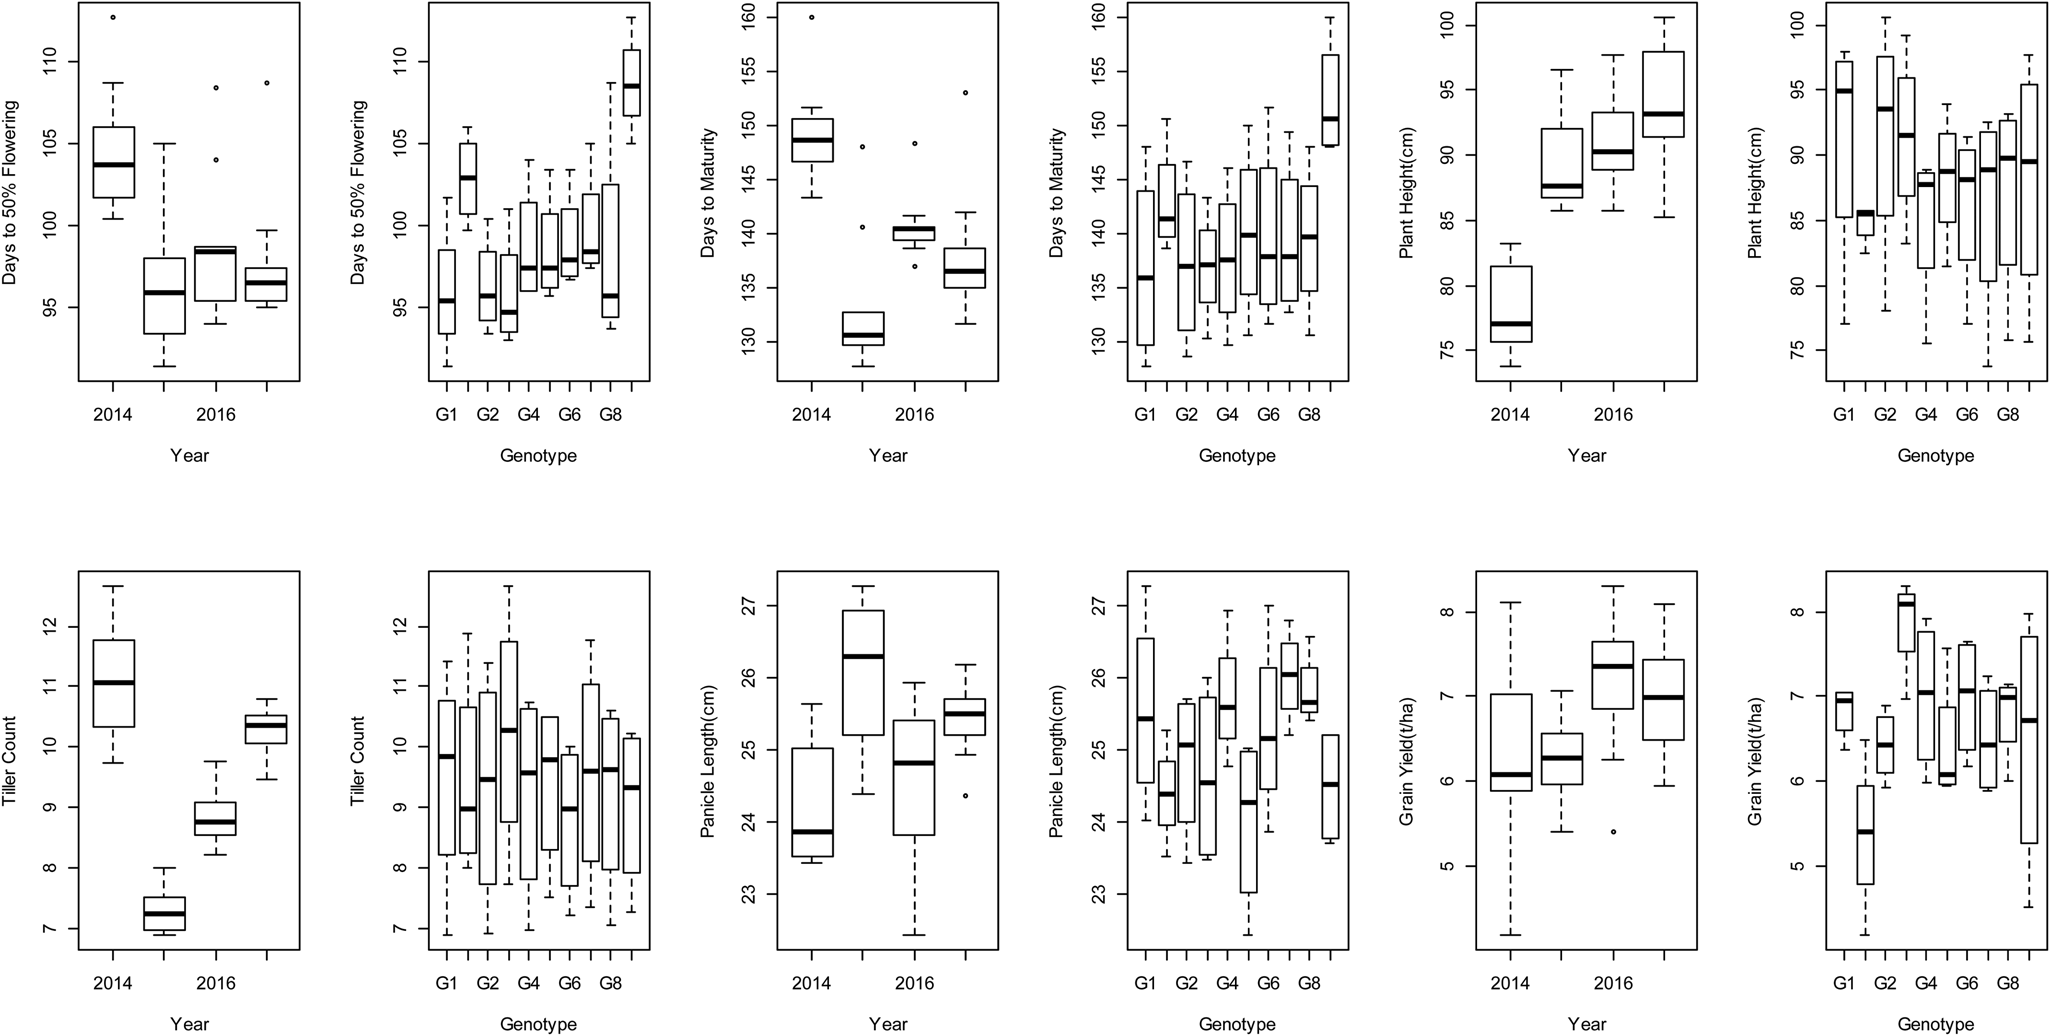
The performance of the genotypes evaluated over the period of 4 years (2014–17) exhibited both consistency and variations in the distribution pattern of observed phenotypic traits including days to 50% flowering, days to maturity, plant height, tiller count, panicle length and grain yield (Figs 4 and 5). For days to 50% flowering, rice genotypes (basmati type and selection derivatives) revealed non-significant differences in distribution means over the years 2015–17. The data for 2014 exhibited an upward deviation in the dispersion of phenotypic values for the trait. There was a correlated response in days to maturity by these genotypes, as revealed by their respective distribution patterns. A consistent performance was revealed by the genotypes over years with the exception of G9 (PS3) and G10 (PB 1509), which had significantly higher (P < 0.01) mean values for days to 50% flowering and days to maturity, i.e. 108/152 days for PS3 and 102/143 days for PB 1509, respectively, as compared to other basmati derivatives. A similar distribution pattern was observed for plant height, with significant (P < 0.01) reduction in the mean distribution of the trait, ranging from 73.7 to 83.2 cm in 2014 in comparison to the range of 85.2–100.6 cm observed in 2015–2017. The genotypes under evaluation exhibited a highly inconsistent distribution pattern for tiller count with significant forward progression of density distribution curves across the years, as vividly depicted in Fig. 5.
Boxplot of different phenotypic traits depicting variation and consistency across years and genotypes (G1, 10, G2-G9) for days to 50%flowering (DF50), days to maturity (DM), plant height (PH), tiller count (TC), panicle length (PL) and grain yield (GY).
Distribution pattern of different phenotypic traits over the period (2014–2017) depicting density overlaps and deviations for days to 50% flowering, days to maturity, plant height, tiller count, panicle length and grain yield.
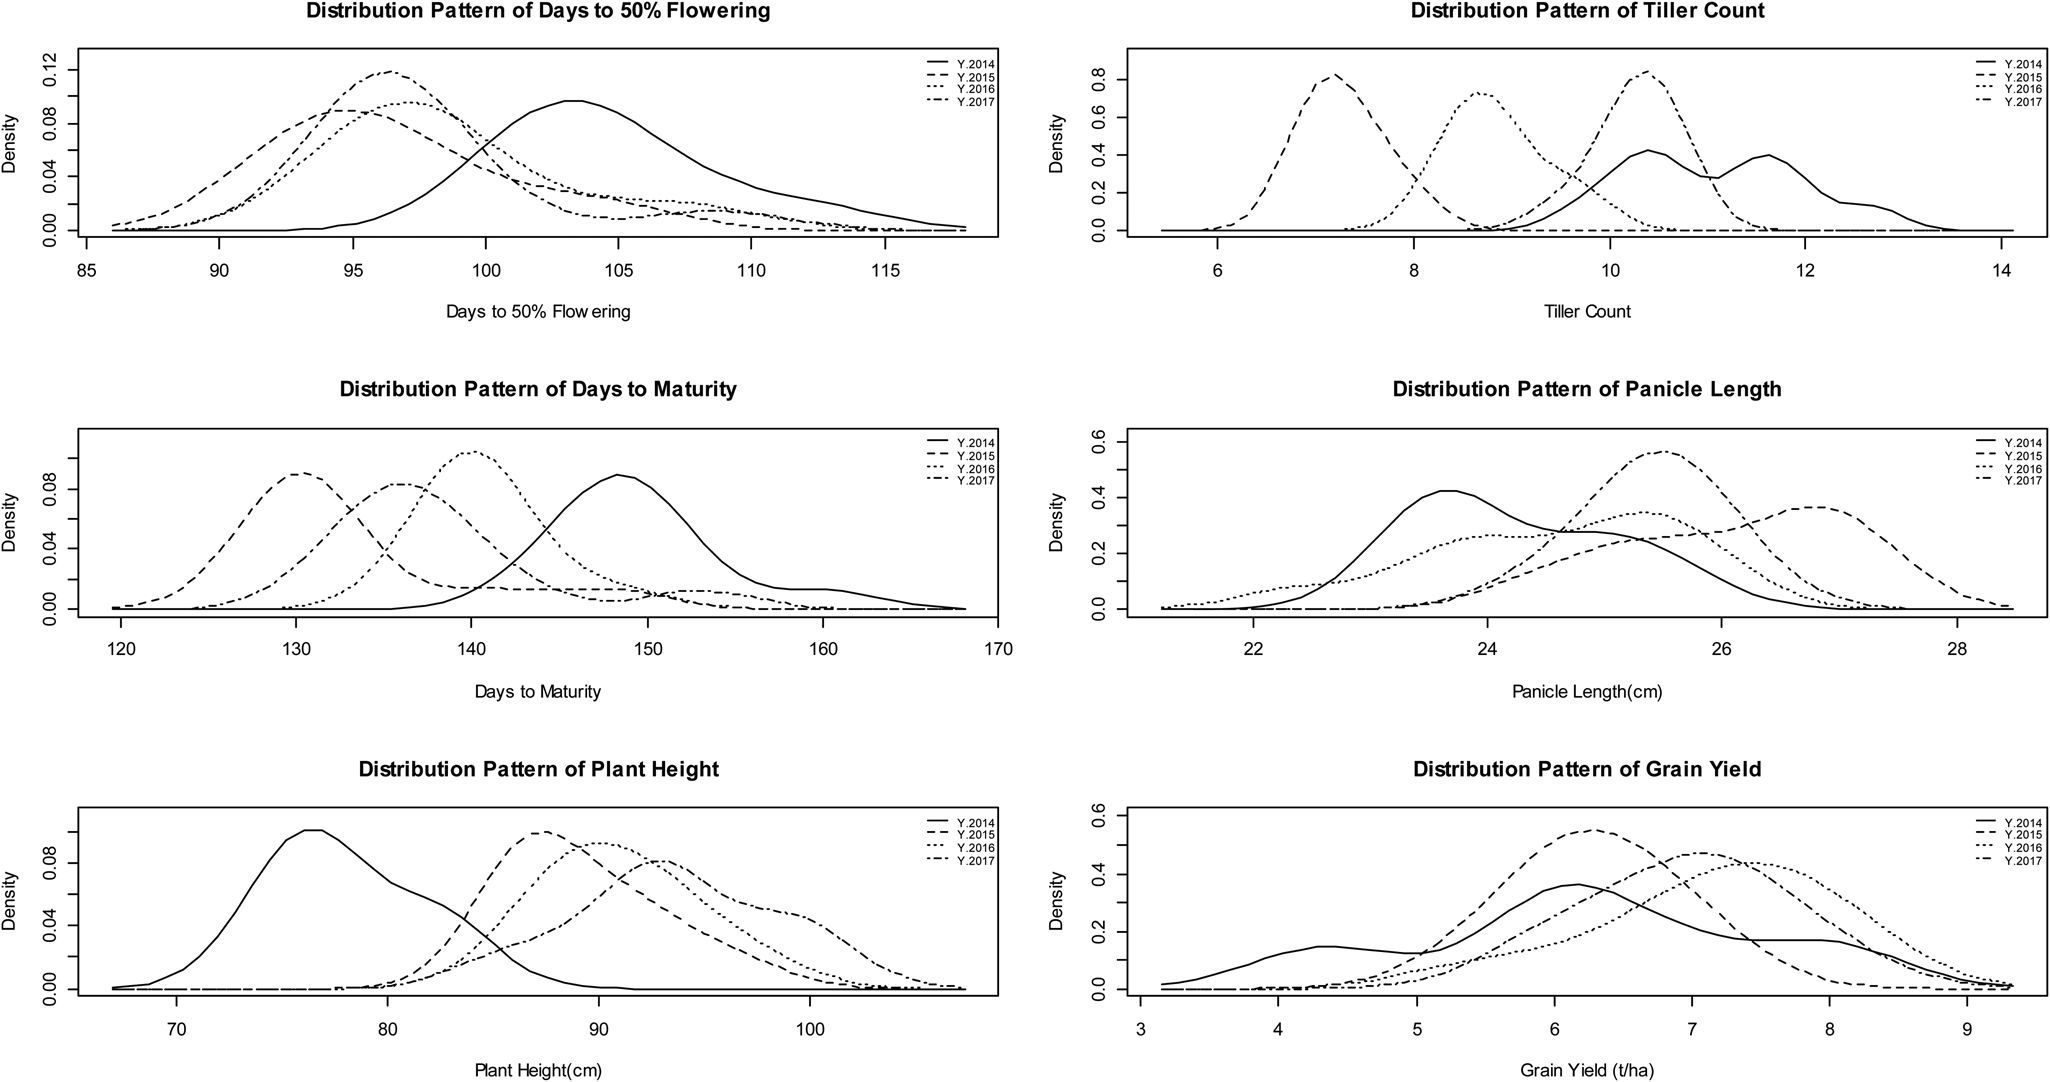
The distribution pattern of mean panicle length over the years 2014–2017 ranged between 23 and 26 cm, with few genotypes possessing a panicle length >27–28 cm observed in 2015 (Fig. 5). The genotypes revealed a marginally non-significant difference in the mean performance of panicle length across the years, though the corresponding value for G1 (SKUA-417) is plotted separately. Grain yield revealed a more consistent distribution with most of the genotypes having a yield of 6–8 t/ha (Figs 4 and 5). However, the performance of genotypes for grain yield exhibited a greater variability during 2014, with genotypes showing grain yield <5 t/ha. It was also observed that G3(SKUA 494) had the highest mean grain yield (>8 t/ha) and maintained this over the years, depicting its ideal adaptation to the temperate conditions of Kashmir valley as compared to its progenitor. These findings are also cross-validated and observed through density plots for grain yield (Fig. 5).
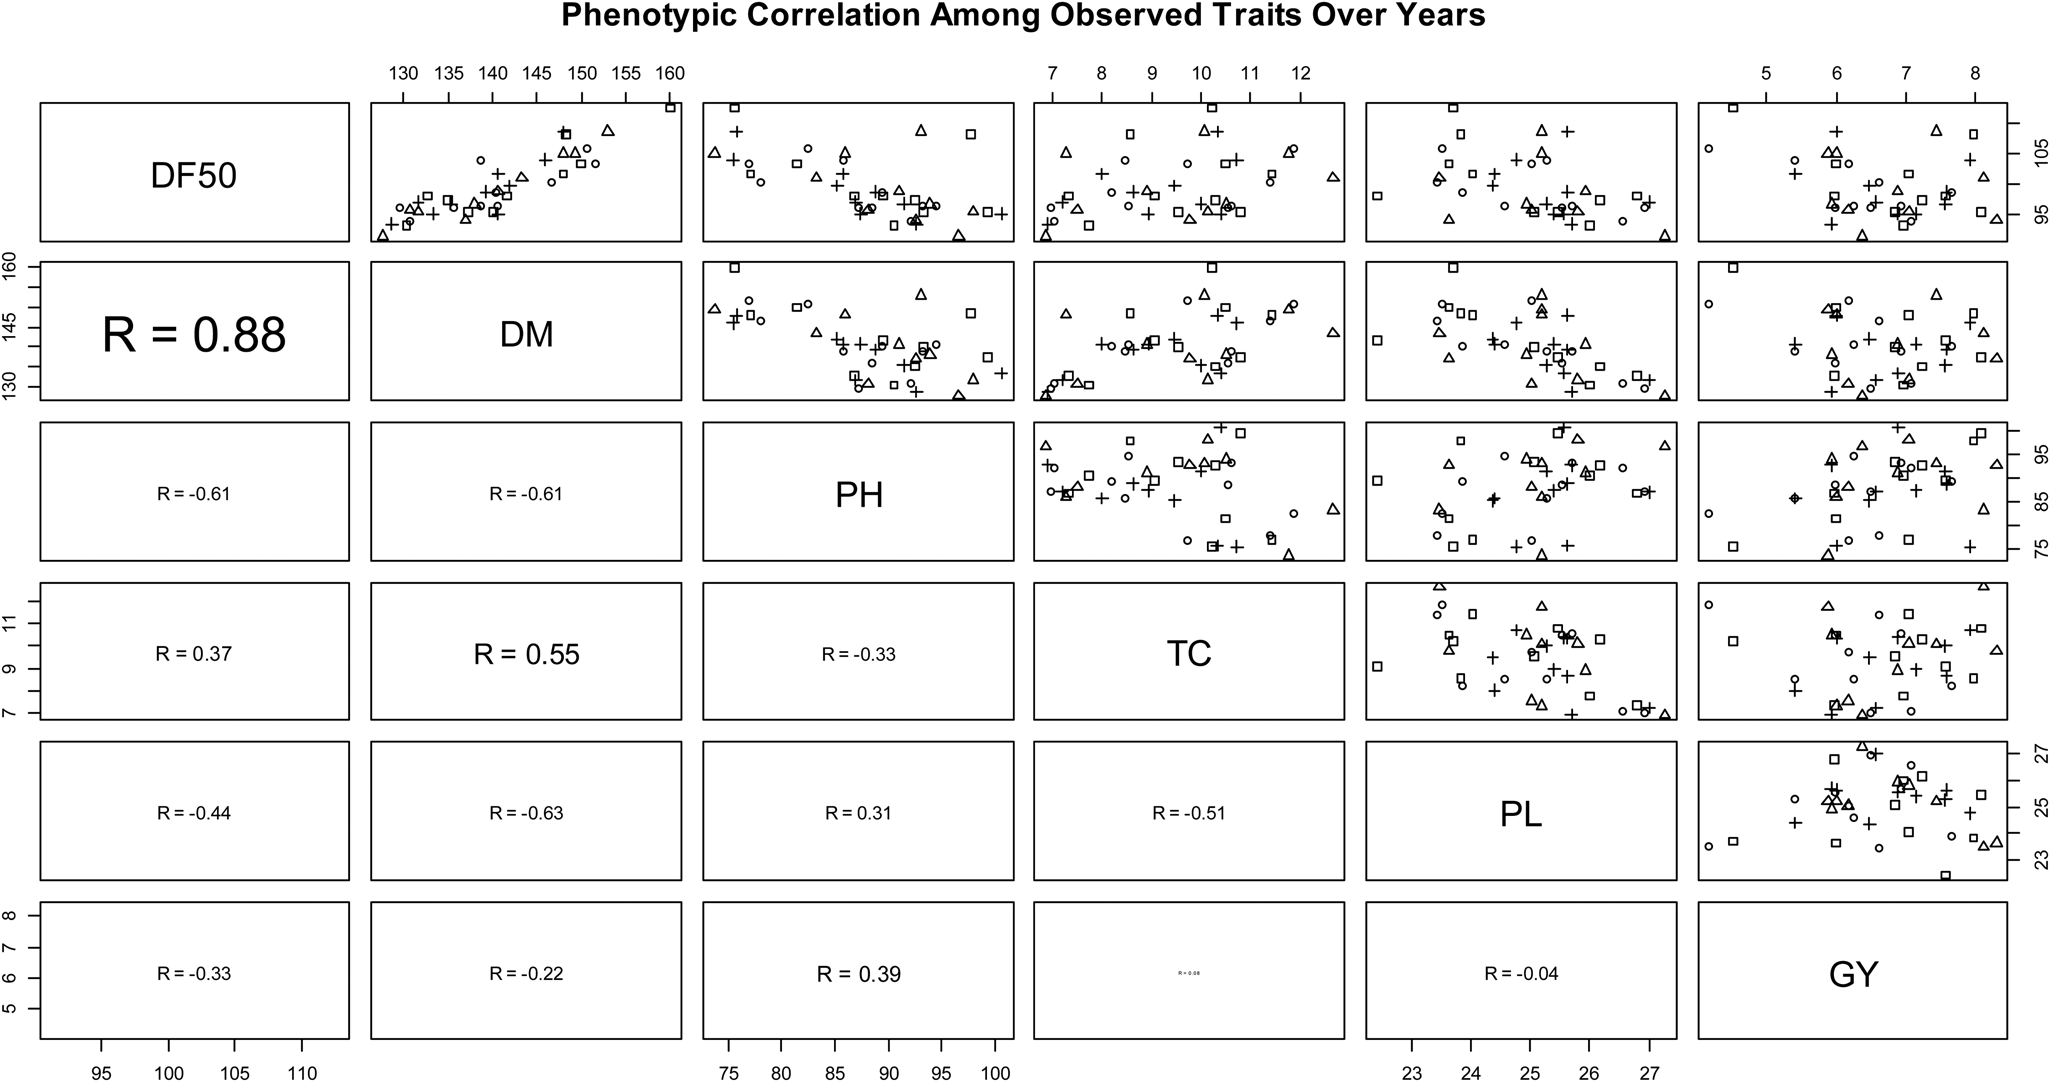
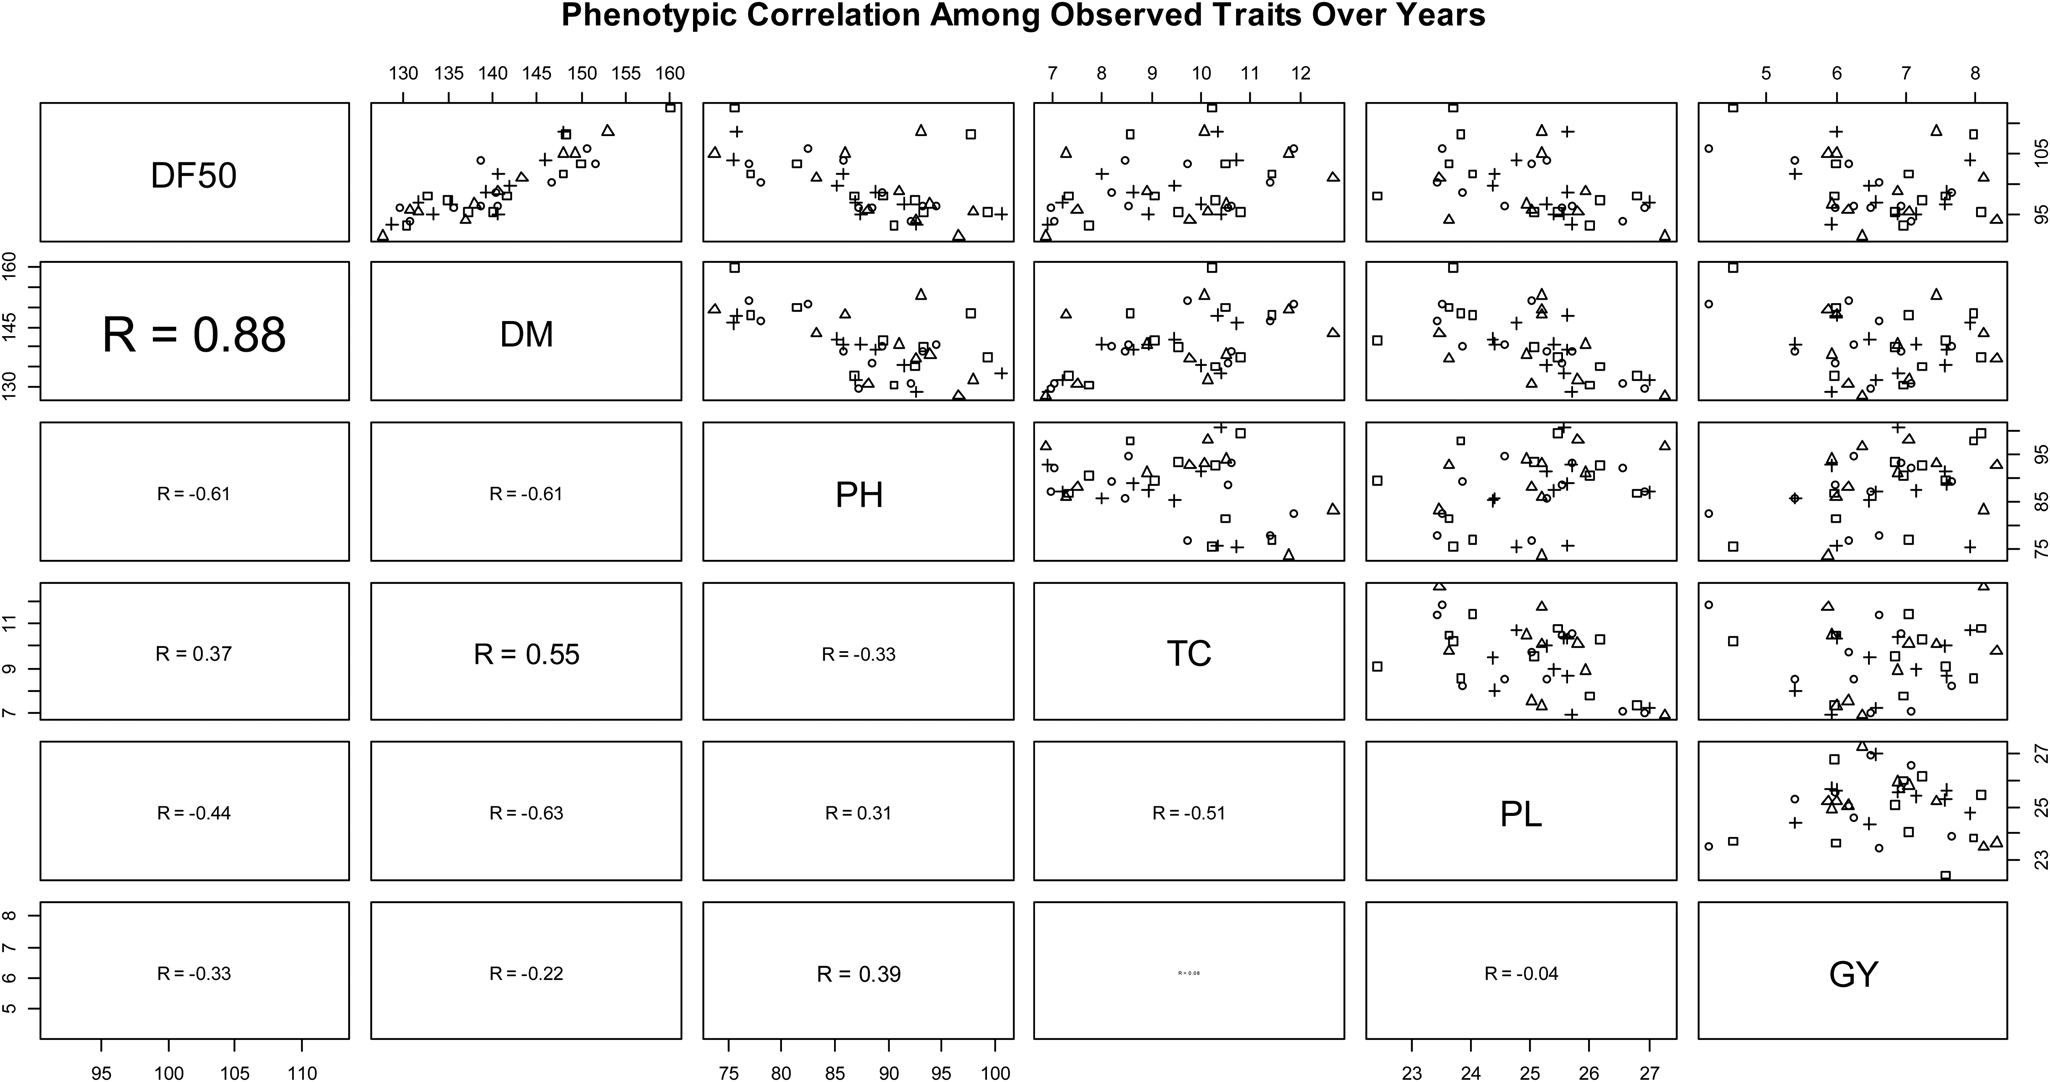
The correlation pattern between different phenotypic traits observed over the period of 4 years is depicted in Fig. 6. It is evident that days to 50% flowering and days to maturity exhibited a consistently strong and positive correlation (r ~ 0.88) as compared to other phenotypic traits. This was followed by a significant (P < 0.01) positive correlation between days to maturity and tiller count (r ~ 0.55). Days to 50% flowering and days to maturity also exhibited a significantly (P < 0.01) strong but negative correlation with plant height and panicle length. Plant height exhibited a positive correlation (P < 0.05) with grain yield (r ~ 0.39); however, other traits either revealed negative or non-significant correlations with grain yield (Fig. 6).
Correlation pattern among different phenotypic traits over the period (2014–2017) for days to 50% flowering (DF50), days to maturity (DM), plant height (PH), tiller count (TC), panicle length (PL) and grain yield (GY).
Overall analysis of the data revealed that G3 (SKUA 494) is the most promising and a stable variety with respect to grain yield (7.87 t/ha) in comparison to other selections and over its progenitor variety G9 (PS3) (6.48 t/ha). G3 (SKUA 494), G4 (K 1416-8-1) and G6 (SKUA 423) exhibited grain yield superiority of 21.5, 8 and 8%, respectively, over their progenitor PS3. The lowest yield among all the genotypes under evaluation was observed for the basmati control G10 (PB 1509). G3 (SKUA 494) also exhibited yield superiority against the selected progenies (from the base population) by a margin of 17.5%. Genetic advance observed for days to 50% flowering and days to maturity revealed an earliness of about 13 and 15 days, respectively, compared to its progenitor G9 (PS3). This earlier flowering and maturity was also observed among the selected progenies over the base population of PS3. However, progenies exhibited a non-significant difference in their mean phenotypes within and against their progenitor base population for tiller count and panicle length. A consistent superiority in the phenotypic performance of G3 (SKUA 494) was observed over the years with respect to the highest tiller count (9.9) followed by a few other genotypes including G7 (SKUA 419) (9.58) and G1 (SKUA 417) (9.49). The progenies G7 (SKUA 419) and G8 (SKUA 420) exhibited longer panicles of 26.20 and 25.83 cm, respectively. There was no significant change in the mean performance for plant height in the selections over the years when compared to the base population. However, G3 (SKUA 494) recorded just a 4% higher plant height over the base population.
Stability of the selections across different environments
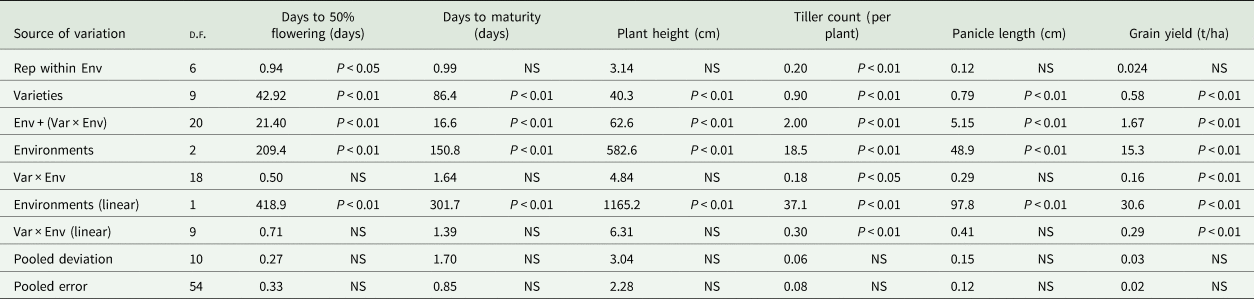
The extensive stability analysis was carried out using the mean phenotypic performance of the genotypes observed at three locations including Khudwani, Wadura and Pombay. The stability analysis was conducted based on the model given by Eberhart and Russell (Reference Eberhart and Russell1966). Both genotypes and environment exhibited contrasting natures, with significant (P < 0.01) variation in mean performance among different traits across locations (Table 2). It was observed that the effect of environment (E) along with genotype × environment (GE) was significant (P < 0.01) for all the studied traits. However, the linear component of GE interaction was significant only for grain yield (P < 0.01) and tiller count (P < 0.01). Significant variation (P < 0.01) due to environment (linear) was also observed for all the traits with non-significant pooled deviation.
Combined analysis of variance for grain yield and other agronomic traits for ten rice genotypes tested in three environments
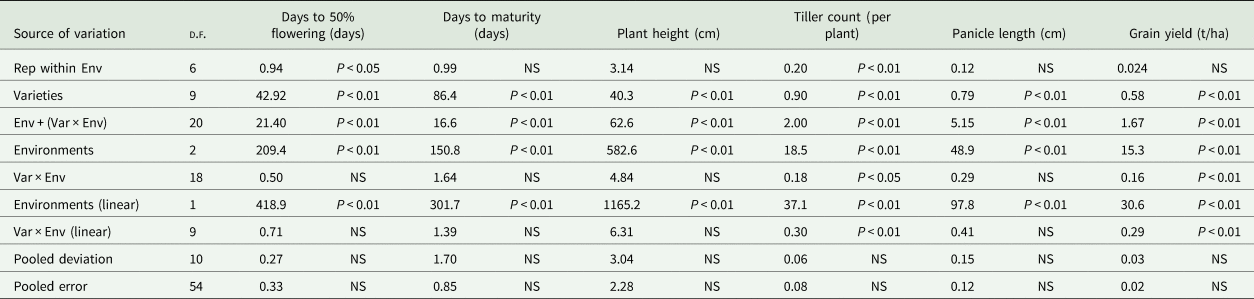
d.f., degrees of freedom; Rep, replication; Env, environment; Var, Variety; NS, not significant.
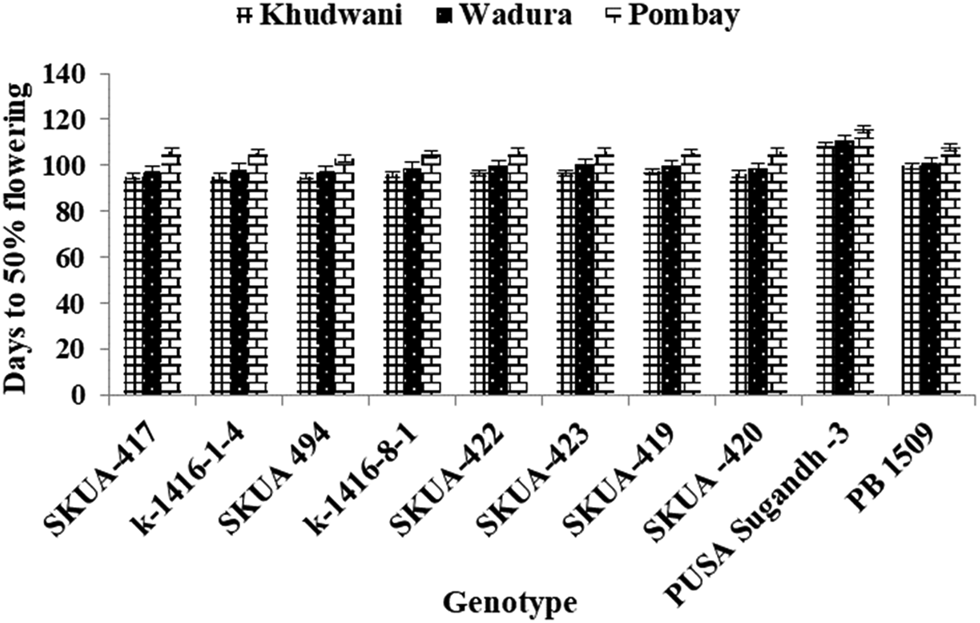
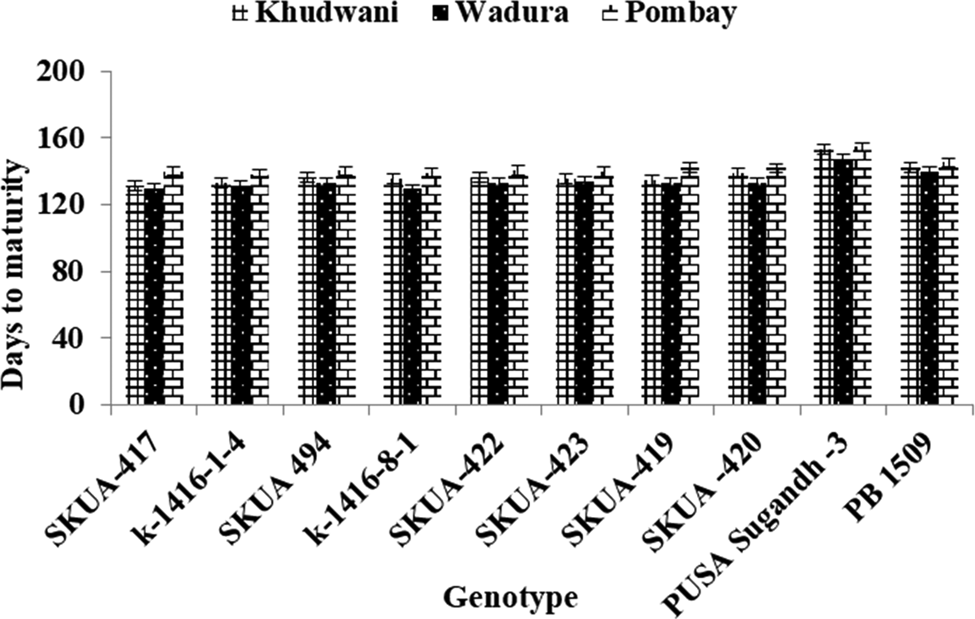
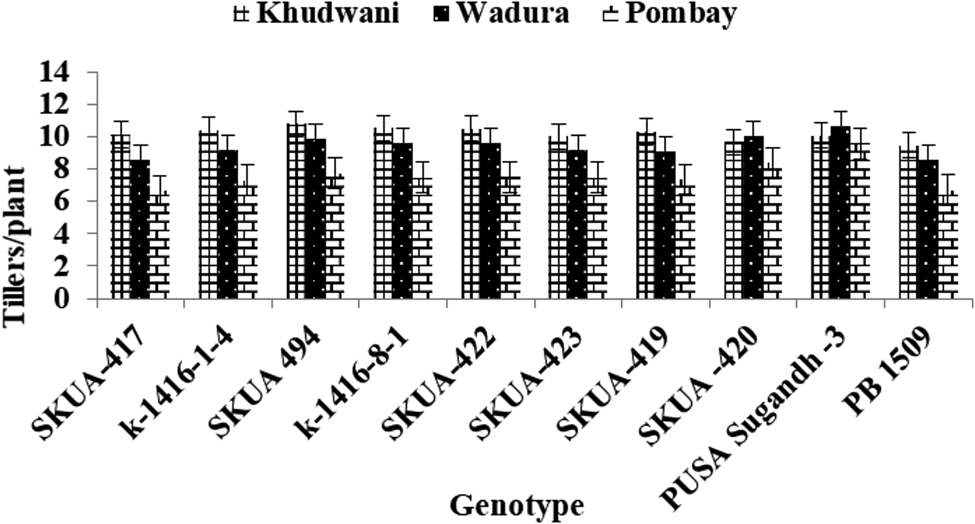
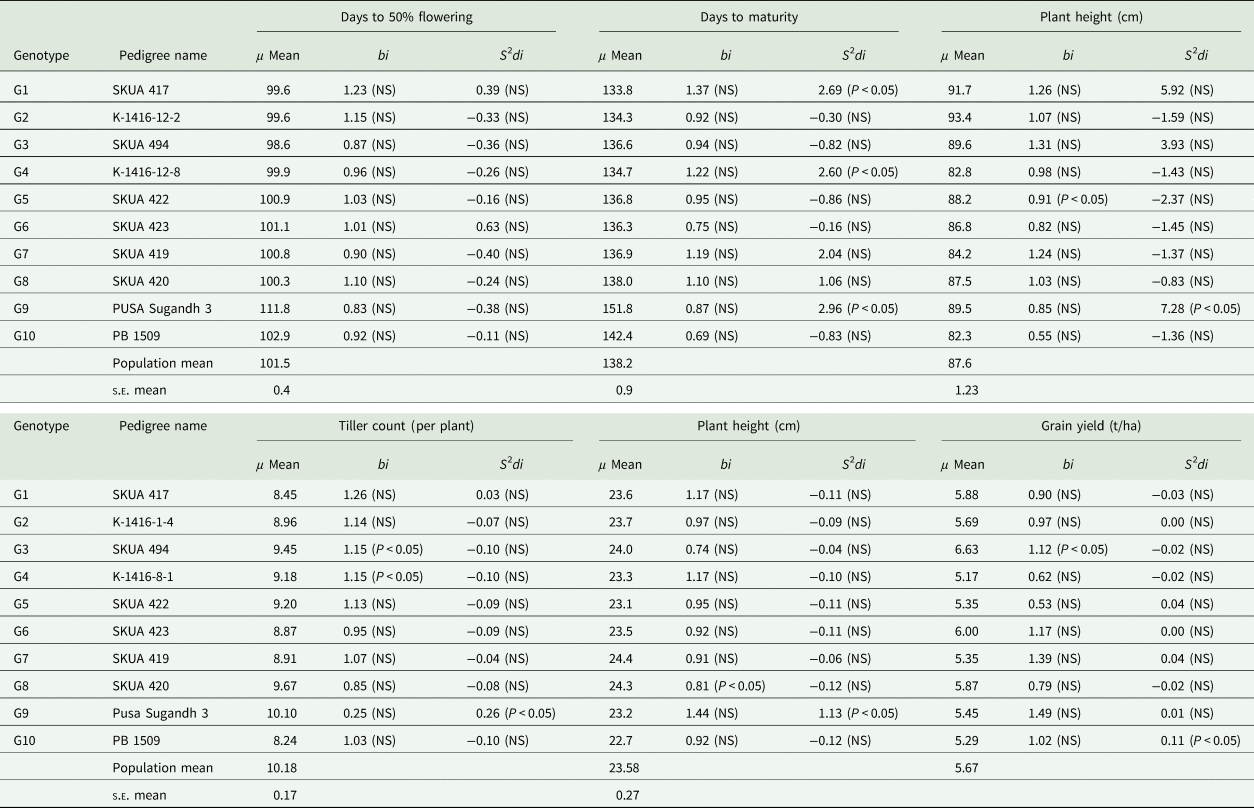
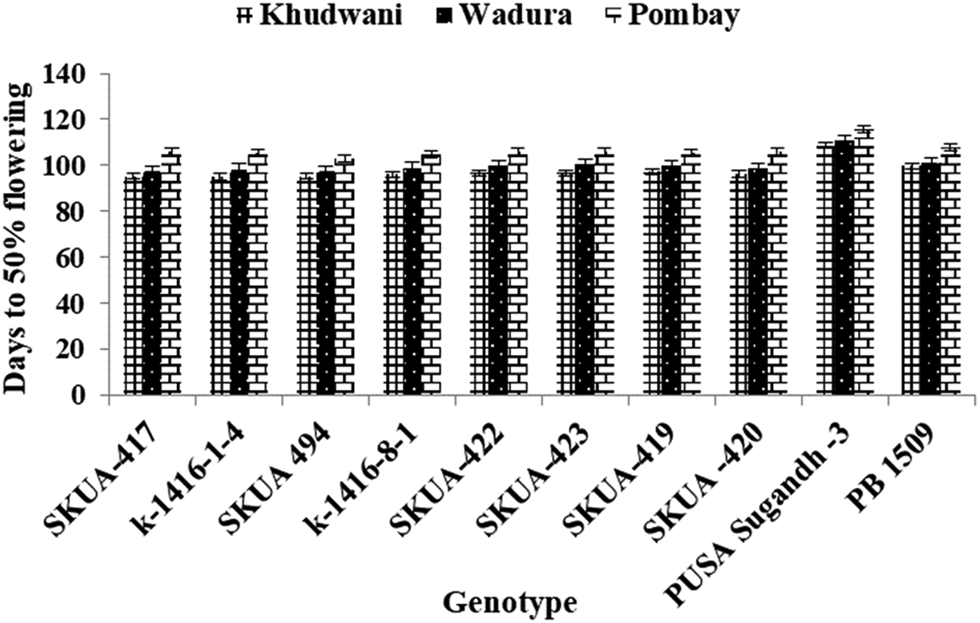
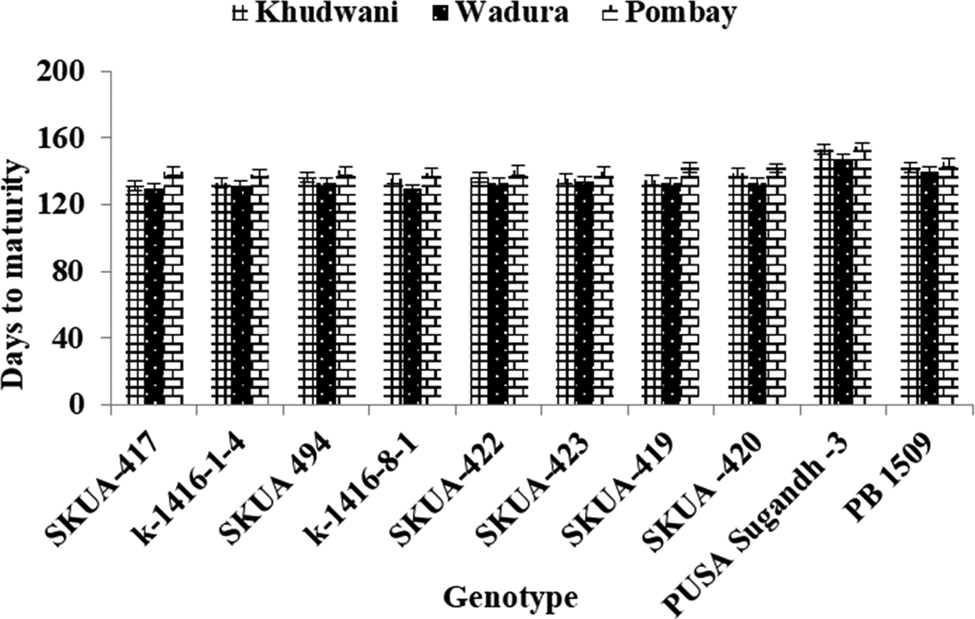
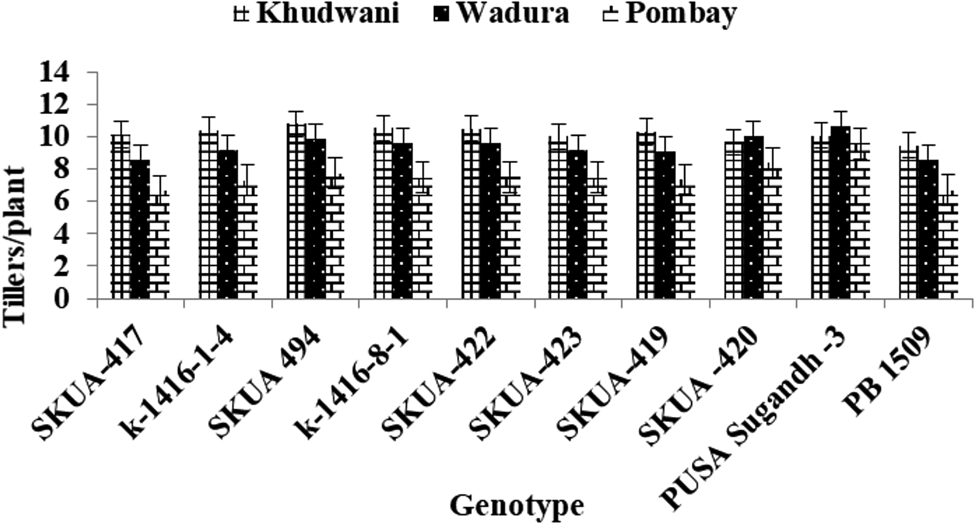
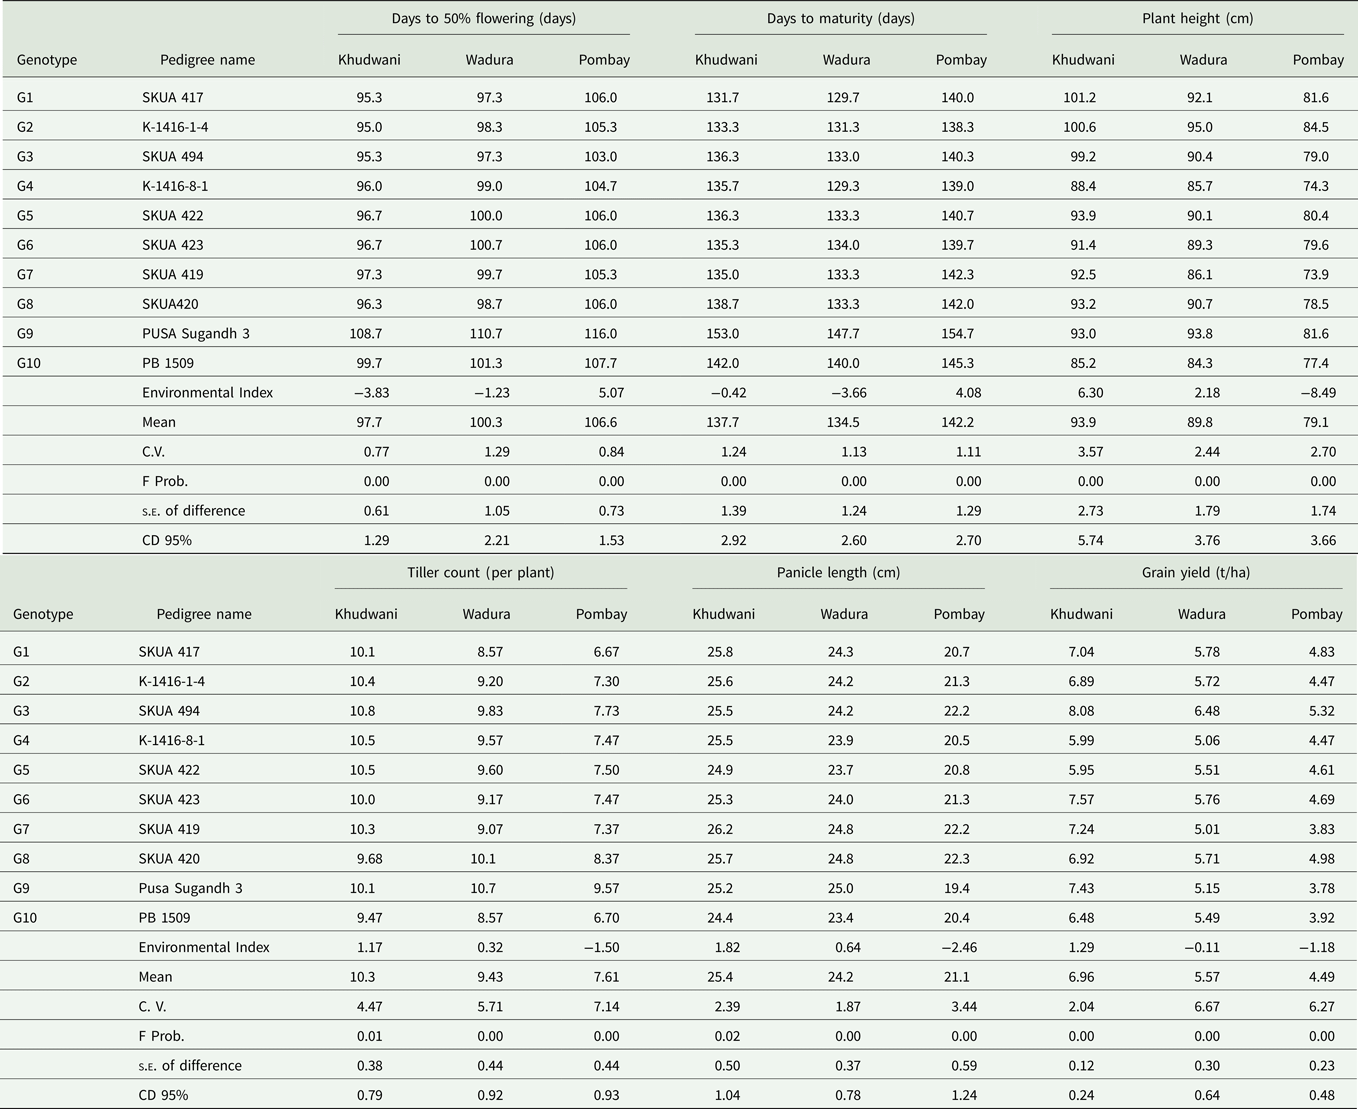
Stability of the genotypes was further observed based on the measure of response or sensitivity to the environmental change of a genotype as indicated by linear regression (bi). This was also observed by the measure of stability behaviour of genotypes as determined by deviation from regression (S 2di) with the lowest standard deviation near to zero being the most stable and vice versa (Table 3). All the selections including controls exhibited near to unit regression for all the observed traits except for days to maturity in PS3. Similarly, G5 (SKUA 422) for plant height, as well as G4 and G5 for tiller count, deviated significantly (P < 0.05) from unity. All the genotypes recorded non-significant S 2di values for all the traits and as such their performance could be predicted with the exception of G1, G4 and G9 for days to maturity. On the basis of mean values over the environments, G3 (SKUA 494) had the highest yield followed by G6, G1 and G8. The selection G3 (SKUA 494) was the earliest to flower followed by varieties G1, G2 and G4. G9 (PS 3) and was latest-maturing among all the genotypes. Environmental indices and overall mean values of phenotypic traits showed that the Khudwani location (E1) was most favourable for traits such as plant height, tiller count, panicle length, grain yield, early flowering and early maturity (Table 4), while the Wadura location (E2) was a comparatively poor environment for all the traits. Pombay was least favourable for plant height, tiller count, panicle length and grain yield. All the genotypes exhibited delayed flowering and maturity at this location (Figs 7–10).
Performance of the genotypes for days to 50% flowering under three environments.
Performance of the genotypes for days to maturity under three environments.
Performance of the genotypes for tiller count (number of tillers per plant) under three environments.
Performance of the genotypes for grain yield (t/ha) under three environments.

Stability parameters for grain yield and other agronomic traits
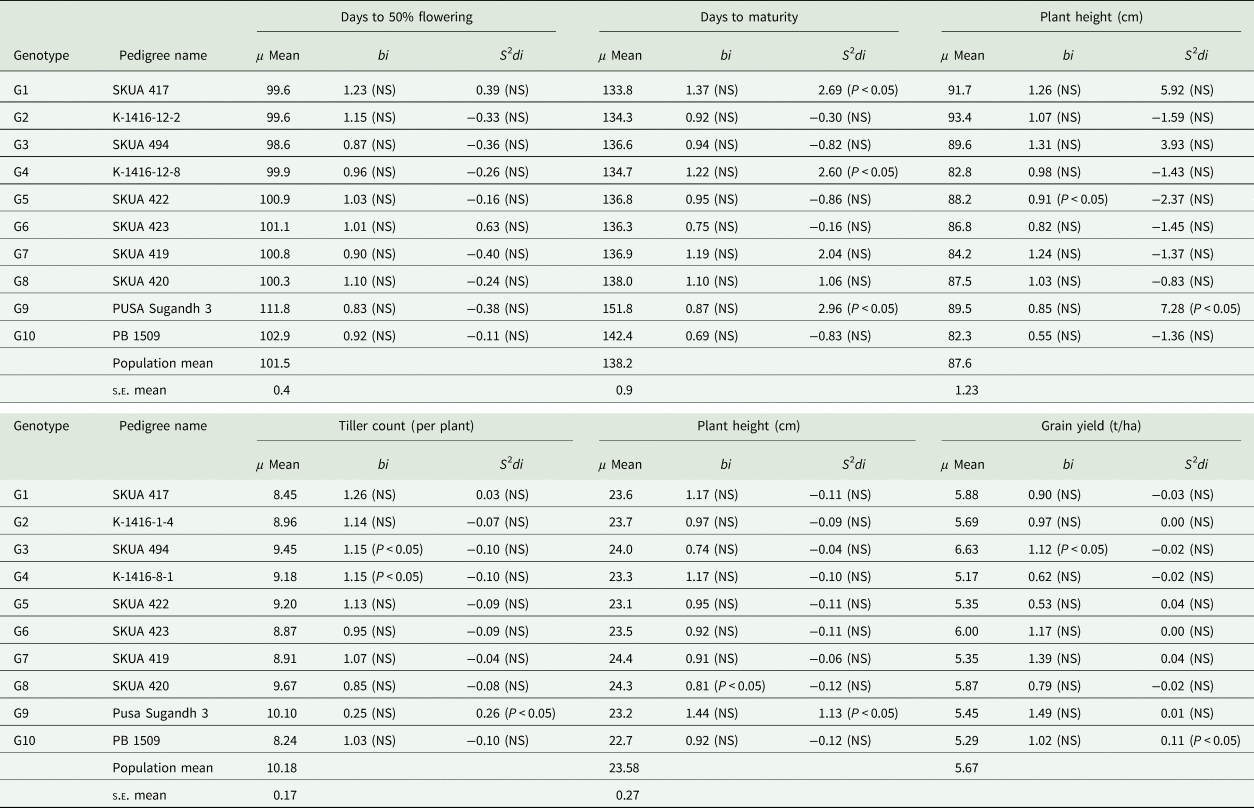
NS, not significant.
Mean and environmental indices of the test genotypes in three environments
Growing degree days required for the test genotypes
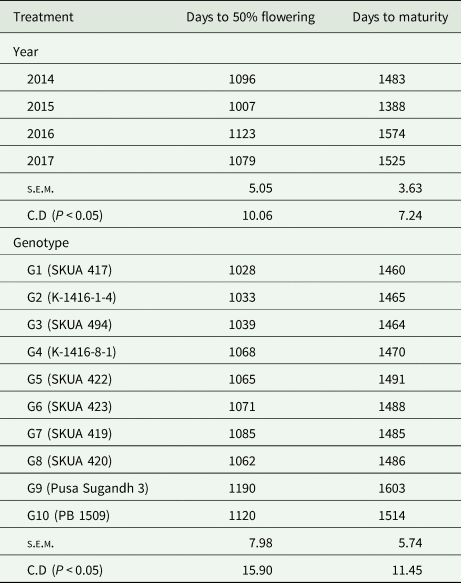
The genotypes tested behaved differently under different environmental conditions. Over the years, a lower GDD accumulation was recorded during 2014 and 2015. During 2014, the consecutive rains and subsequent drop in atmospheric temperature during the first fortnight of September resulted in lower GDD accumulation. However, in 2015, the crop was planted 8 days later than the previous year. G9 (PS3) matures in 130–135 days under north Indian sub-tropical conditions with a GDD accumulation of 1900–2000 units. Under temperate Kashmir conditions, PS3 matures in about 145–150 days accumulating an average of 1190 units up to 50% flowering and about 1600 units up to maturity (Table 5). Early selections showed a significant (P < 0.05) drop in GDD accumulation, with the lowest figures recorded for G1, G2, G3 (SKUA 494) andG4.
Effect of years and basmati genotypes on GDD accumulation at days to 50% flowering and maturity
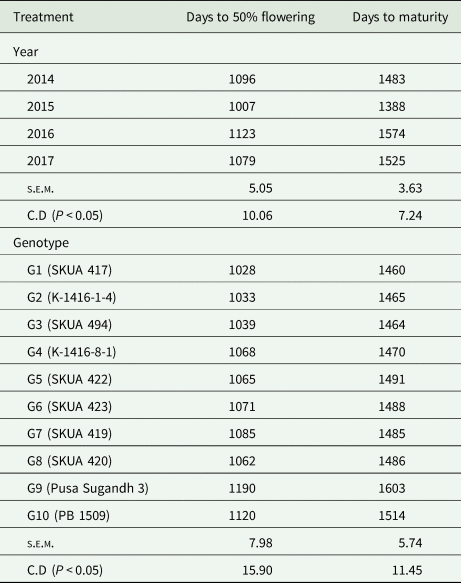
s.e.m., Standard error of the mean.
Adaptive and multi-location trials
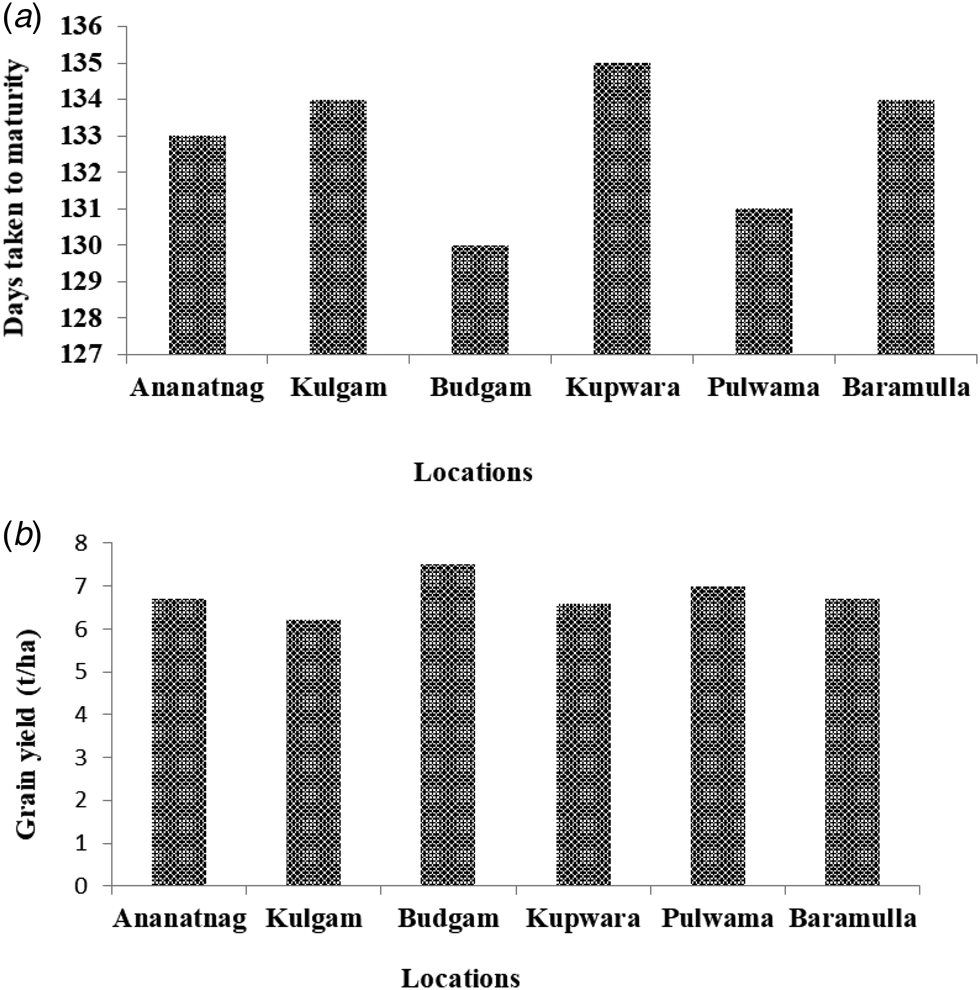
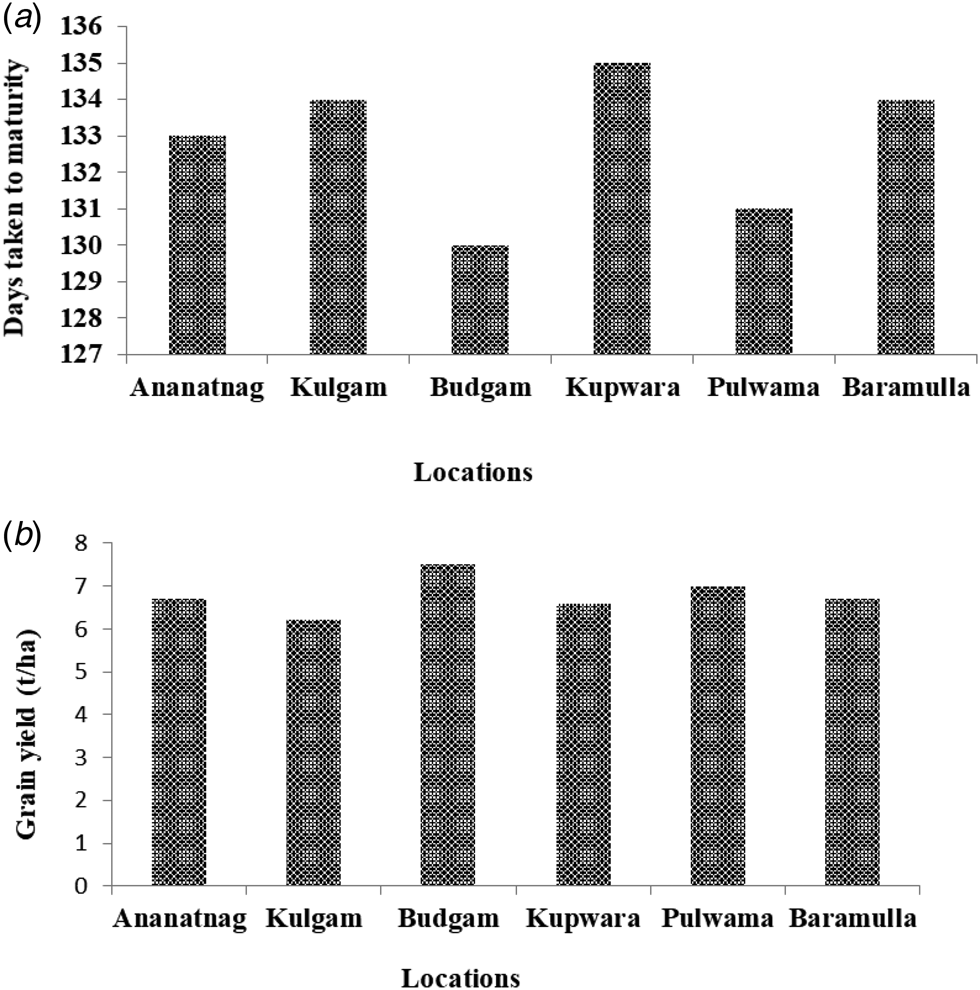
To elucidate the adaptation across broader environments and to precisely observe the stability of evolved genotype G3 (SKUA 494), a series of adaptive trials were conducted during 2017 and 2018. There was a non-significant deviation in the average performance of SKUA 494 for yield and maturity traits. The average yield potential of this newly developed variety was found to be about 6.8 t/ha, with a seed-to-seed span of 133 days. This gives a comparative edge of early maturity to SKUA 494, a basmati variant that is highly important for its successful adoption and popularity under temperate agro ecologies (Figs 11(a) and (b)). G3 (SKUA 494) was further tested across different available mega-environments of India under the multi-location testing programme of the All India Coordinated Rice Improvement Project (AICRIP) during 2018. The variety showed large variation in grain yield, ranging from as low as 2.47 t/ha at Almora (grown as a rainfed crop) to as high as 7.85 t/ha at Khudwani (under irrigated conditions). The variety performed with an overall average grain yield of 5.10 t/ha across different rice research centres of hilly regions of India (Fig. 12).
(a) Mean performance of promising genotype SKUA 494 for days to maturity in adaptive trials conducted at various locations across the six districts of Kashmir valley. (b) Mean performance of promising genotype SKUA 494 for grain yield (t/ha) in adaptive trials conducted at various locations across the six districts of Kashmir valley.
Grain yield (t/ha) performance of promising genotype SKUA 494 in national testing at 12 Hill Centres of India.

Quality analysis of the promising genotypes
The analysis of quality and post-harvest traits of newly developed basmati genotype G3 (SKUA 494) showed that 1000 grain weight, rough grain length, milled kernel length and breadth, and length/breadth ratio are comparable with progenitor genotype G9 (PS3) and PB 1509 (Table 6). No significant differences were observed in the cooking quality for kernel length after cooking, kernel breadth after cooking and kernel elongation ratio. Hulling, milling and head rice recovery were relatively better for SKUA 494 over PS3 and PB 1509. SKUA 494 revealed intermediate values for alkali spreading value (ASV), GC and AC, which were comparable with the control varieties. High aroma was observed for SKUA 494 based on penal test and was considered to be at par with both controls (Table 6).
Quality parameters of SKUA 494 in comparison to PS3 and PB 1509

Molecular marker-aided estimation of polymorphism between source variety and derived genotypes
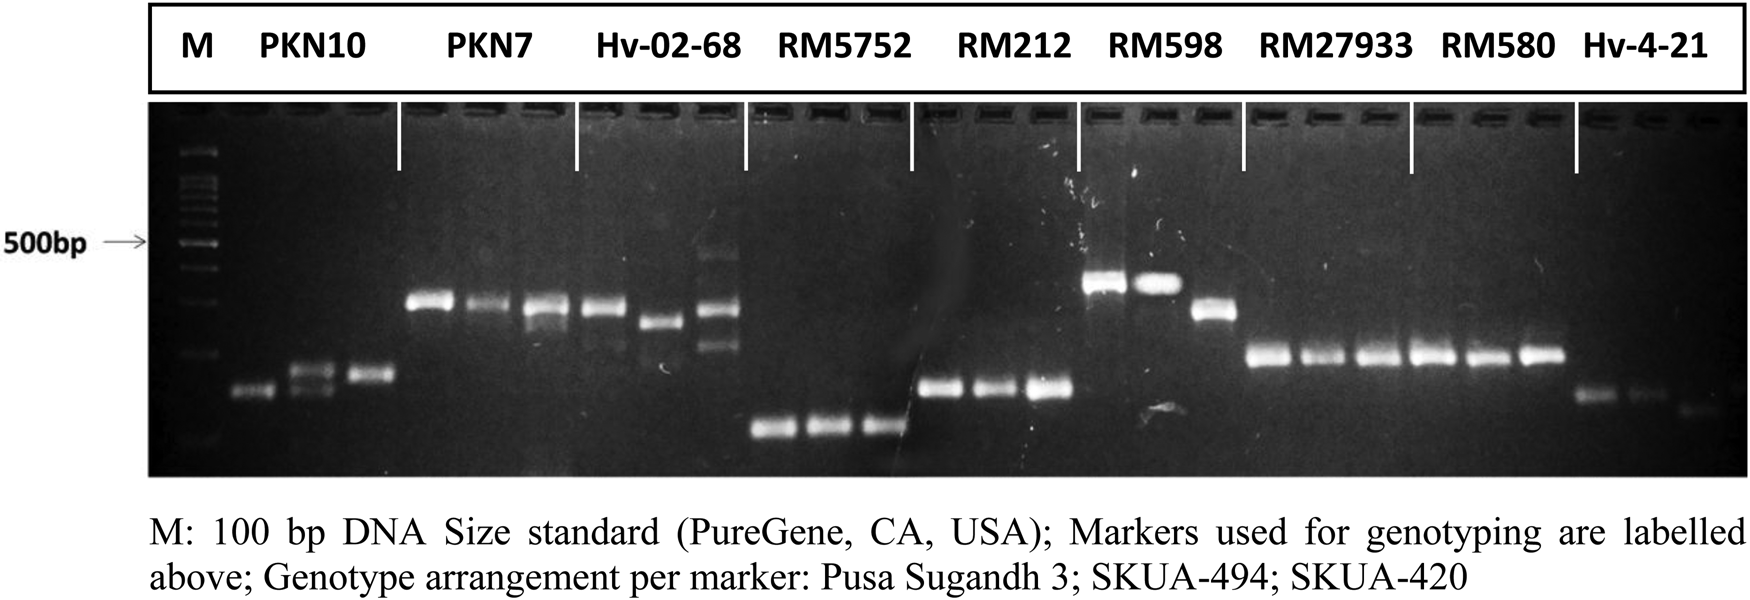
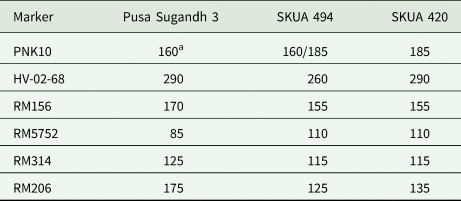
Polymorphism survey was carried out between SKUA 494, SKUA 420 and Pusa Sugandh 3 using a total of 48 SSR and STS markers (Table 7). The markers PNK10, HV-02-68, RM156, RM5752, RM314 and RM206 discriminated SKUA 494 and SKUA 420 from Pusa Sugandh 3. The marker PNK10 amplified a fragment size of 160 and 185 bp in Pusa Sugandh 3 and SKUA 420, respectively, while SKUA 494 was found to be heterozygous at the locus. Pusa Sugandh 3 and SKUA 420 carried 290 bp size allele for the marker HV-02-68 while SKUA 494 amplified 260 bp fragments. In Pusa Sugandh 3, the markers RM156, RM5752 and RM314 amplified 170, 85 and 125 bp alleles, respectively. Alternately, SKUA 494 and SKUA 420 both amplified 155, 110 and 115 bp alleles at the corresponding loci. PS3 showed 175 bp allele for RM206 against 125 and 135 bp fragments for SKUA 494 and SKUA 420, respectively (Fig. 13). A nested primer targeting Badh-2 locus (Bradbury et al., Reference Bradbury, Henry, Jin, Reinke and Waters2005) was assayed in Pusa Sungandh-3 and SKUA-494 where both of them amplified 257 bp aroma-specific allele against an alternate 355 bp fragment linked to non-fragrant trait.
Allelic profile of Pusa Sugandh 3, SKUA-494 and SKUA-420.
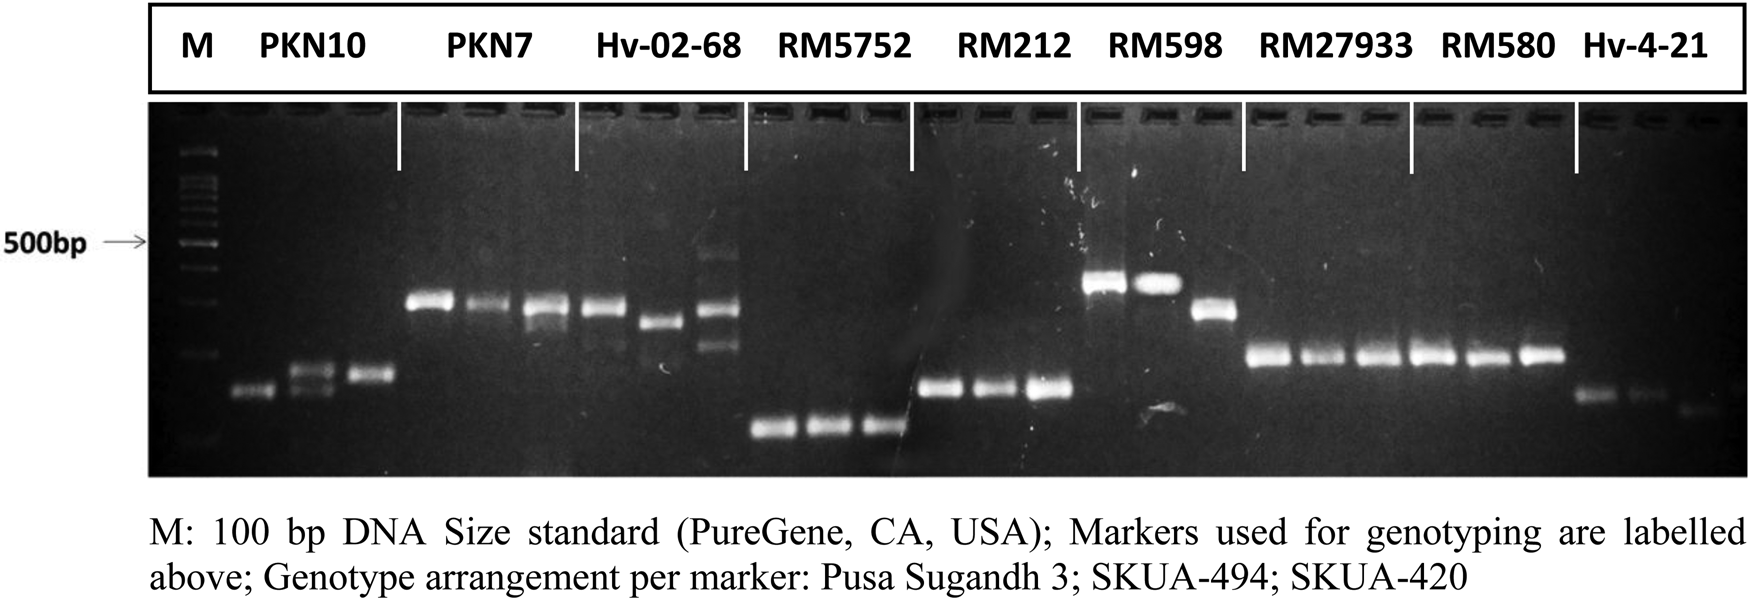
Amplification profile of discriminatory markers across three genotypes
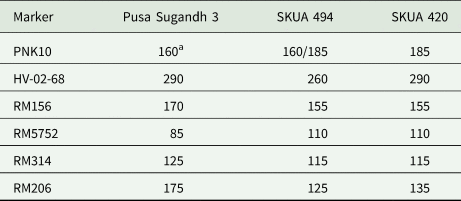
a Figures represent allele size in base pairs.
Discussion
Evolving new variants from the base population
Development of a new variant in a highly self-pollinated crop species such as rice is assumed to be driven by multiple evolutionary forces (Van, Reference Van1960; Saini et al., Reference Saini, Saini, Kaur, Francies, Gani, Rajendra, Negi, Jagtap, Kadam, Singh, Chauhan, Salgotra and Zargar2020). These forces are responsible for producing individuals with diverse phenotypes as compared to their baseline variety. The new derivative G3 (SKUA 494) from G9 (PS3) has followed an analogous evolutionary phenotypic change and has been progressively selected, evaluated and refined as a stable first early BR variety for high altitude regions of northern Himalayas. The evolutionary changes in principle are based on four factors viz., initial heterozygosity in the common ancestral population, and residual heterozygosity after n-generations of inbreeding, contamination from out-crossing and mutations. After several generations of inbreeding (in the absence of selection), an inbred strain has a random allelic mix from the ancestral population. Therefore, a pure line would differ from another divergent strain equal to (h) times the number of loci examined, where (h) is the heterozygosity of these loci in the ancestral population (Fitch and Atchley, Reference Fitch and Atchley1985).
SKUA 494 may be considered as a secondary selection based on a divergent character of a natural variant in the population of PS3. The variant breeds true with respect to PS3 with a major difference in days to heading, which is earlier by 12–15 days. Since Oryza sativa is autogamous and out-crossing is only of the order of 0.41%, improvement and increments are observed by a process of re-selection, as conducted in PS3, attributed to the discharge of hidden genetic variance or a favourable random mutation in the heading trait. SKUA 494, being a secondary selection from PS3, exhibited a marked difference for days to heading with a significant adaptive advantage under the temperate ecology of Kashmir, where cultivation of BR is a major challenge due to problems in maturity. The present methodology of secondary selection has remained at the core of developmental strategies in the case of other revolutionary rice varieties under indica group, e.g. K1039, K988, K972 and some japonica varieties (Prasad et al., Reference Prasad, Patwary and Biswas2001).
Residual heterozygosity in rice has been reported to occur at an average of 3.1% of the loci in diverse cultivars (Lu et al., Reference Lu, Redus, Coburn, Rutger, McCouch and Tai2005). Therefore, it is possible to select for different alleles within apparently homozygous rice cultivars. It is assumed that the expression of residual heterozygosity may be one of the reasons for the emergence of a new variant in PS3 that evolved into a new variety, i.e. SKUA 494. The marker PNK10 amplified a fragment size of 160 and 185 bp in Pusa Sugandh 3 and SKUA-420, respectively, while SKUA-494 was found to be heterozygous at that locus. The rest of the marker loci were homozygous. It is possible that the selection of early variant within Pusa Sugandh 3 was possible because of the hidden cryptic variation that did not express under sub-tropical conditions where the variety evolved and only appeared under temperate conditions, due to which the flowering date was delayed by 25 days for the original Pusa Sungadh 3. The role of residual heterozygosity in evolution is an established phenomenon in many commercially important self-pollinated or cloned crops, such as barley (Soleimani et al., Reference Soleimani, Baum and Johnson2005) and wheat (Hainer and Hesemann, Reference Hainer and Hesemann1988; Soleimani et al., Reference Soleimani, Baum and Johnson2002). Residual heterozygosity has also been demonstrated in rice cultivars using SSR markers (Agrama and Yan, Reference Agrama and Yan2009), InDels/SSRs (Wen et al., Reference Wen, Mei, Feng, Yu, Huang, Wu, Chen, Xu and Luo2009) and single nucleotide polymorphism markers (Eizenga et al., Reference Eizenga, Agrama, Lee, Yan and Jia2006; Tian et al., Reference Tian, Zheng, Hu and Yu2006). There are many reasons for self-fertilized plants to retain heterozygosity within a cultivar. If a population of plants rather than a single plant is used to increase the seeds for use as a cultivar, the heterozygosity among individuals within the population is maintained (Allard, Reference Allard1960; Briggs and Knowles, Reference Briggs and Knowles1967). Other factors that add heterozygosity in self-pollinating plants include low but measurable amount of out-crossing (Gealy et al., Reference Gealy, Mitten and Rutger2003), spontaneous mutations (Allard, Reference Allard1960) and invisible selection occurring from localized stresses such as soil bacteria, micronutrient concentrations, pesticides, etc.
Le Rouzic and Carlborg (Reference Le Rouzic and Carlborg2007) proposed the concept of genetic charge to describe the evolutionary potential of hidden variation responsible for the phenotypic change that is discharged or exploited in response to primary/secondary selections. Genetic charge describes the genetic diversity that is present but not currently expressed in a population and has the potential to contribute to future selection response. Although not visible, the genetic charge is thus an important component of a species' potential to evolve. In the process of developing SKUA 494 from PS3, genetic charge may have played a role in changes to days to heading and yield attributing traits. It can be further argued in the light of this concept that the genetic architecture of a trait is composed of all the genetic elements that currently or in future could contribute to phenotypic expression. At any point in time, only a part of the components of genetic architecture is variable and contribute to the genetic diversity of a population. Part of this diversity has an impact on the phenotypic stage and therefore replaces the visible variation (Le Rouzic and Carlborg, Reference Le Rouzic and Carlborg2007). The part of genetic diversity that has the potential to affect the phenotype but is not expressed under the current genotypic or environmental conditions is generally referred to as cryptic genetic variation or hidden variation, which plays an important role in the evolution of cultivars as observed in the present case.
Multi-location testing of the genotypes
Multi-environment testing of several derivatives from PS3 resulted in the identification and development of new basmati genotype G3 (SKUA 494). The early-maturing BR type is ideally suited to the high altitude conditions of the temperate northern Himalayas, especially for Kashmir Valley. Conducting multi-location trials plays an important role in understanding the nature and magnitude of GE interaction so that high-yielding and early-maturing basmati types are identified. Among the newly developed derivatives from PS3, the consistent performance of G3 over the diverse locations and years is attributed to an overall non-significant phenotypic variation across the years and locations (stable phenotype). Differential response of genotypes evaluated over different locations and years is attributed to varying rates of environmental influence on yield and other traits, due mainly to factors such as soil fertility, unpredictable weather conditions and/or the presence of other biotic and abiotic stresses (Kang, Reference Kang1993). These fluctuations are often referred to as GE interactions. In the presence of GE interaction, the use of genotypic means across environments as the criteria for selecting superior genotypes is not dependable (Kang, Reference Kang1993). Therefore, GE interaction and stability analysis has continued to be an important statistical tool in assessing the varietal stability and suitability for cultivation across the ecological zones.
Various components of variance for all the traits revealed a significant diversity among the genotypes and environments with varying rates of environmental influence on phenotypic expression. It has been observed that derivatives from G9 (PS3) exhibited a differential and significant response under multi-environment evaluation with respect to grain yield and tiller count and is attributed to significant GE interactions within the environments. Significant variation due to environment (linear) revealed the linear contribution of environmental effects and additive environment variance on all the traits under evaluation. The non-significance of pooled deviation indicated a linear response of genotypes and signifies their predictable nature. Stability of the genotypes was tested using the Eberhart and Russell (Reference Eberhart and Russell1966) model. Linear regression (bi), which measures the sensitivity of genotypes to environmental changes and deviation from regression, was also used to appraise the stability of genotypes (Breeze, Reference Breeze1969); the lowest standard deviation, near to zero, is the most stable and vice versa. On the basis of these traits, a stable genotype is one that has high mean yield (x), regression coefficient equal to unity (bi = 1) and mean square deviation from regression (S 2di) near to zero. These variables have been used in several studies to characterize a number of rice genotypes as stable or unstable under multi-environment testing (Bhakta and Das, Reference Bhakta and Das2008; Gouri Shankar et al., Reference Gouri Shankar, Ansari and Ilias Ahmed2008; Panwar et al., Reference Panwar, Joshi and Ali2008; Satyanarayana et al., Reference Satyanarayana, Chamundeswari, Girija Rani, Ramana Rao, Ravi Kumar, Srinivas and Suneetha2017). On the basis of stability variables, stability index and overall mean for most of the traits, the newly developed basmati genotypeG3 (SKUA494) depicted most stable performance across the locations and over the years when compared to other derivatives of PS3. SKUA 494 was concluded as the most promising genotype followed by SKUA423 and SKUA417. The genotype G3 as the promising variety has been duly recommended for general cultivation in the Kashmir valley due to its huge economic potential. Higher environmental indices for most of the traits under ecological conditions of Khudwani (1590 m asl) and the better performance of SKUA494 signifies its adaptation to an altitude ranging between 1650 and 1750 m asl. Kashmir valley has more than 0.1 million ha rice area in this altitudinal range, which constitutes about 0.75 of the total area under rice. In order to ensure its large-scale adaptation across different agro-ecological zones of the valley, adaptive varietal trials are often being considered a prerequisite. This was done in technical collaboration with the Jammu and Kashmir State Department of Agriculture and other allied extension agencies for its popularization, seed production and for further integration in the seed system chain. Numbers of trials were increased to an adequate rate to ensure greater involvement of farmers. The adaptive trial system takes care of determining the suitability of otherwise a new variety G3(SKUA 494) in the farmer's situations under the local resources, constraints and abilities. The practice also benefited the evaluation of genotype G3 (SKUA 494) to avoid faulty or hasty recommendations.
Accumulation of growing degree days and influence on maturity
Temperature is a major environmental factor that determines the rate of plant growth and development. Various developmental stages, as well as harvest date of crop, can be estimated from the knowledge of accumulated GDD. Thermal time can be used as a tool for characterizing thermal responses in different crops as it is an independent variable to describe plant development (Dwyer and Stewart, Reference Dwyer and Stewart1986). On average, these early selections have 8.6% lower GDD requirements, which is comparable to the NB rice varieties cultivated in the Kashmir valley. Such a physiological change has reduced the risk of crop failures due to cold weather during flowering and grain filling stages of rice crop.
Quality evaluation
Incorporation of desirable quality features into the conventionally bred varieties is highly important from the commercial point of view. There have been many successful interventions in the development and incorporation of eating and cooking quality traits in BR, including desirable biochemical traits such as low phytic acid through mutagenesis, followed by back-cross breeding (Asante et al., Reference Asante, Amoako-Andoh, Traoré, Bissah, Cobb, Qureshi, Dar and Wani2019; Lau and Latif, Reference Lau, Latif, Qureshi, Dar and Wani2019; Qamar et al., Reference Qamar, Hameed, Ashraf, Rizwan and Akhtar2019). Therefore, the newly developed variety G3(SKUA 494) was evaluated for various physiochemical and cooking quality traits in order to identify its feasibility as per the prevailing consumer preferences. These preferences are grain appearance, size and shape of the grain, behaviour upon cooking, taste, tenderness and flavour of cooked rice. Milling recovery depends on grain shape and appearance, which has a direct effect on the percentage of hulling, milling and head rice recovery (Khush et al., Reference Khush, Kumar and Virmani1988). The cooking quality features evaluated were AC (Juliano, Reference Juliano1979), GC (Cagampang et al., Reference Cagampang, Perez and Juliano1973) and ASV (Little et al., Reference Little, Hilder and Dawson1958). These traits reveal important starch properties, which influence cooking and eating characteristics. Rice types that have intermediate amylose (20–25%) are preferred in most of the rice-growing areas of the world. However, most of the varieties of temperate regions, particularly in Kashmir valley, show low AC: SKUA 494 possesses intermediate (24%) AC and is therefore desirable. Similarly, GC test separates rice into three categories viz., very flaky with hard GC (gel length ⩽40 mm), flaky with medium GC (gel length 41–60) and soft GC (gel length ⩾61 mm), and the varieties with soft GC are preferred as the cooked rice is more tender. SKUA494 exhibited a soft, tender GC (65 mm). Similarly, the aroma of rice is an economically important trait, playing a large role in consumer acceptability: fragrant rice has widespread popularity among consumers worldwide (N. Shobha Rani, unpublished). The aroma of Basmati is appreciated by many consumers globally and represents a high-value trait (Singh et al., Reference Singh, Singh, Mohapatra, Krishnan and Ellur2018). Even though more than 100 volatile aromatic compounds have been identified in cooked rice (Buttery et al., Reference Buttery, Turnbaugh and Ling1988), the inheritance of scent in SKUA 494 was found to be controlled by 2-acetyl-1-pyroline, as indicated by nested badh 2 marker (Bradbury et al., Reference Bradbury, Henry, Jin, Reinke and Waters2005).
Molecular profiling of promising genotype
Out of 48 SSR/STS markers surveyed, six revealed clear polymorphism between the genotypes SKUA 494, SKUA 420 and PS3 using a simple agarose-based assay. The polymorphism per cent (12%) was supposedly lower than expected between any two random genotypes in O. sativa and the derived lines do not differ from PS3 in any of the phenotypic traits other than days to flowering and maturity. Interestingly, a single polymorphic marker, RM156 coincides with the genomic location at 125.7 cM and is located near the quantitative trait loci (QTL) for days to heading viz., Hd6. This QTL was mapped on chromosome 3 using a back-crossed population (BC4F2) derived from a cross between a japonica rice variety, Nipponbare (early) as the recurrent parent and an indica rice variety, Kasalath (late) as the donor parent (Yamamoto et al., Reference Yamamoto, Lin, Sasaki and Yano2000). Takahashi et al. (Reference Takahashi, Shomura, Sasaki and Yano2001) narrowed down Hd6 locus to a 26.4 kb genomic region encoding protein kinase CK2 known to cause photoperiod sensitivity. This may be the reason that PS3 flowers in 85 days after sowing under altitudes of 300 m asl against 105 days under Kashmir conditions (1600 m). SKUA 494, in comparison, takes 90–95 days in Kashmir and thus matures 15 days earlier than PS3. The difference in maturity days between PS3 and SKUA 494 is mainly due to differences in days to heading and flowering with an almost similar duration from flowering to maturity.
Conclusion
Short growing seasons with persistent cold conditions have been the main problem for basmati cultivation in the Kashmir, India. Multi-environment testing of several derivatives from Pusa Sugandh 3 resulted in the identification and development of SKUA 494, which possesses high grain yield, earliness, better grain quality and adaptability for agro-ecological conditions and suitability to the prevailing cropping systems. Cultivation of this variety has the potential to boost the rural economy of not only Jammu and Kashmir but other temperate rice-growing regions of India and elsewhere.
Acknowledgements
Technical support from the ICAR-Indian Institute of Rice Research, Hyderabad, India in conducting this study is duly acknowledged. The authors are also thankful to the Agriculture Production Department, Jammu and Kashmir, India for their support in conducting adaptive trials
Financial support
This research received no specific grant from any funding agency, commercial or not-for-profit sectors.
Conflict of interest
The authors declare that they have no conflict of interest.
Ethical standards
Not applicable.