Introduction
Cover crops can provide a sustainable, on-farm source of N for organic farming systems, reducing the need for off-farm inputs. Crop yields can be maintained by replacing or supplementing N fertilizer with residue N from legume cover crops that fix N, cereal cover crops that scavenge residual available N, or a combination of cereal–legume cover crop residuesReference Sainju, Whitehead and Singh1, Reference Fortuna, Blevins, Frye, Grove and Cornelius2. Effective cover crop N contribution depends on sufficient N accumulation in the cover crop biomass and timely mineralization of the accumulated NReference Griffin, Liebman and Jemison3, Reference Teasdale, Abdul-Baki and Park4. The degree of synchrony between N supply from cover crop residue and crop N uptake can influence the efficiency of crop N useReference Teasdale, Abdul-Baki and Park4. This depends on cover crop composition, environmental conditions, the timing of field events and the type of crop grownReference Cherr, Scholberg and McSorley5.
Mixing cereal cover crops with legumes can enhance N cycling because the combined cover crops often have larger biomass and total N content than legumesReference Sainju, Whitehead and Singh1. Cereal rye is a standard winter cover crop in many regions because it establishes quickly and thrives in cool conditions6. Hairy vetch has been shown to be a hardy winter legume, but it prefers warm soil temperatures and therefore establishes more slowly in cool conditionsReference Mosjidis and Zhang7. There is evidence that cover crops grown in biculture have a wider range of tolerance to adverse environmental conditions than grown in monocultureReference Creamer, Bennett and Stinner8, Reference Gaskell9. In addition, rye may act as a nurse crop to the hairy vetch, as has been observed in other experimentsReference Björkman and Shail10, Reference Grubinger11.
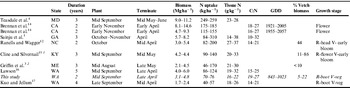
Cereal–legume mixtures have lower C:N ratios and more plant available N than cereals grown in monocultureReference Ranells and Wagger12, Reference Kuo and Sainju13. Despite these potential benefits it is still unclear as to how the proportions of cereal and legume residues in cover crop mixtures affect N release. Table 1 compares cover crop above-ground biomass, C:N ratios, N uptake and concentration from rye–legume winter cover crop studies conducted across a broad geographical range in the USA. The studies are listed in approximate order of cover crop N uptake. Management practices that affect N content and release dynamics from plant residue are changes in residue quality due to planting date, enhanced mineralization due to a combination of cover crops and fertilizer, and a reduction in residue sizeReference Giacomini, Recous, Mary and Aita18, Reference Snapp and Borden19, Reference Wagger, Cabrera and Rannels20.
Comparison of above-ground biomass and nitrogen from cereal rye–legume cover crop mixtures. All data are for hairy vetch as legume except for Brennan et al., where mixed legumes were used.

1 Cline and Silvernail saw difference in hairy vetch % depending on whether cash crop was fertilized the previous season. We did not see the same effect.
2 Griffin et al. reported hairy vetch % was less than 10% for one year, but did not report the other 2 years.
GDD, growing degree days; R, rye; V, vetch.
The biological processes involved in soil N transformations are temperature-dependentReference Davidson and Janssens21. In general, temperatures between 20 and 30 °C are considered ideal for N mineralizationReference Curtin, Campbell, Carter and Gregorich22. The effect of temperature on N mineralization can be standardized using a Q(10) factor, which calculates the increase in mineralization rate for every 10 °C increase. Research has demonstrated that N mineralization is also a function of growing degree days when moisture is adequateReference Honeycutt and Potaro23. The advantage of using growing degree days to account for the effect of temperature on N mineralization is that it allows for comparison between laboratory and field trialsReference Ruffo and Bolero24. Some studies have demonstrated that N mineralization rates increase exponentially with temperature up to 35 °CReference Cookson, Cornforth and Rowarth25. Others have shown linear correlations for rates of N mineralizationReference Wang, Wan, Xing, Zhang and Han26. Soil properties and management practices likely account for differences between these resultsReference Kruse, Kissel and Cabrera27, Reference Quemada and Cabrera28.
Cover crops influence subsequent crop yield primarily via their effect on N availabilityReference Torbert, Reeves and Mulvaney29, Reference Vaughan and Evanylo30. Crop yields can be maintained by replacing or supplementing N fertilizer applications with winter legume or cereal–legume cover crop residuesReference Sainju, Whitehead and Singh1, Reference Fortuna, Blevins, Frye, Grove and Cornelius2. Reported N fertilizer replacement values for winter-grown cover crops to subsequent cash crops vary greatly. Several studies examine sweet corn performance after legume and mixed cereal–legume cover crops because of its marked response to N additions. Other researchers have reported yields equivalent to N-fertilizer treatments when grown in rotation with hairy vetchReference Cline and Silvernail15, Reference Carrera, Abdul-Baki and Teasdale31. In contrast, some studies have demonstrated poor yield response to rye–hairy vetch blends and lowered N contributions from hairy vetch and rye–hairy vetch blends (62–75 kg N ha−1) below recommended fertilizer ratesReference Zotarelli, Avila, Scholberg and Alves32.
Predicting how much N cover crop residues will supply to subsequent cash crops using field experiments alone is challenging. Nitrogen mineralization is controlled by many factors, including residue compositionReference Ranells and Wagger12, Reference Jensen, Salo, Palmason, Breland, Henriksen, Stenberg, Pedersen, Lundstrom and Esala33 and environmental parameters such as temperature and soil moistureReference Ruffo and Bolero24, Reference Wang, Wan, Xing, Zhang and Han26. Laboratory incubations that are conducted at optimum moisture and temperature provide a method for comparing N availability across a range of residue types and compositions, which improves our capacity to predict cover crop N availabilityReference Robertson, Wedin, Groffman, Blair, Holland, Harris, Nadelhoffer, Robertson, Bledsoe, Coleman and Sollins34. Variations in cereal:legume cover crop biomass ratios that can differ widely in the field, can be easily examined using this method. Field data can then be used to validate laboratory results and standardized using growing degree days.
In this study, field and laboratory experiments were conducted to improve our understanding of the N contribution of rye–hairy vetch cover crop mixtures in organic farming systems. This experiment was designed to determine whether rye–hairy vetch cover crop quality (C:N ratio, fiber fractions) could be managed to increase and time N mineralization from cover crops with nitrogen uptake in organically grown sweet corn with and without feather meal. This research provides information to growers with regard to N credits derived from rye–hairy vetch cover crop mixtures in the Pacific Northwest, USA.
Methods
Laboratory incubation
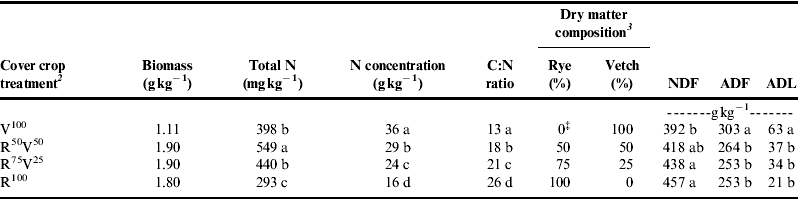
The release of plant available inorganic N (NH4+ + NO3−)–N from cover crop residues was estimated via laboratory incubation. The experiment included four cover crop treatments and an unamended control. Treatments were labeled based on the percent vetch relative to rye in cover crop biomass: 100% vetch (V100), 50% vetch (R50V50), 25% vetch (R75V25), and 0% vetch (R100). Application rates for the cover crop residues in the incubations varied among treatments, but were proportional to a 5-year average of cover crop biomass (Table 2) observed for pure rye (1.80 g kg−1), pure vetch (1.11 g kg−1), and rye-vetch biomass mixtures (R50V50; 1.90 g kg−1), (R75V25; 1.90 g kg−1) measured during a previous 5-year study located on the same field site at WSU Puyallup, WA, USAReference Lawson16.
Cover crop (R = rye, V = vetch) biomass and total N added, tissue N concentration, C:N ratio, dry matter composition and fiber content1 (NDF, ADF and ADL) of residues used for incubation.
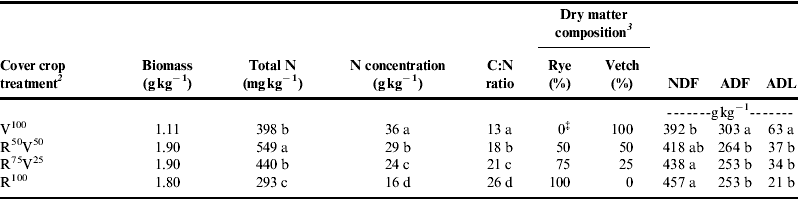
1 NDF, neutral detergent fiber; ADF, acid detergent fiber; ADL, acid detergent lignin.
2 ANOVA was run in SAS Proc Mixed. Values within a column followed by the same letter are not significantly different at P ≤ 0.05.
3 Dry matter composition in incubation study is percent of each cover crop applied to incubation vessel. Vetch and rye for V100 and R100 were harvested from pure vetch and pure rye stands in April 2009, while vetch and rye for the R50V50 and R75V25 treatments were separated from mixed stands and reconstituted as the mixtures noted in the table.
Cover crop samples used in the incubations were harvested from stands on a field unit adjacent to the field experiment planted to sweet corn (described in the ‘Experimental design’ section). This field unit was located on the same soil series as the field experiment and was planted and managed using identical seed sources and management practices as those of the field experiment. The cover crops were planted in mid September and harvested in late April. Above-ground cover crop biomass was harvested from a 6.1 × 0.91 m swath approximately 5 cm above the soil surface with a flail mower. The harvested forage from each plot was weighed wet, and a subsample (approximately 500 g) was collected and oven dried at 55 °C to determine dry matter. Hairy vetch and rye for V100 and R100 were harvested from pure vetch and pure rye stands and any weeds removed, while vetch and rye for the R50V50 and R75V25 treatments were separated from appropriate mixed stands and reconstituted as the mixtures noted above. Residues were dried at room temperature before reconstitution and incubation.
Cover crops applied in the incubation were analyzed for total C, N and biochemical fractions. These residue quality parameters were expected to correlate with the amount and timing of release of N from residues in incubations and field plots. A subsample of each of the residues and residue mixtures was dried at 55 °C and ground to pass through a 2-mm sieve. Total C and N in residue were measured by dry combustion with a TruSpec CN Carbon/Nitrogen Determinator (Leco, St. Joseph, MI). Biochemical fractions of the residues were determined by using the neutral detergent and acid detergent stepwise fiber fractionation procedure developed by Van Soest et al.Reference Van Soest, Robertson and Lewis35 using an ANKOM-automated system with filter bags (ANKOM Technology Corp., Fairport, NY). Neutral detergent fiber (NDF) includes hemicellulose, cellulose and lignin as the primary components; acid detergent fiber (ADF) consists of cellulose and lignin; and acid detergent lignin (ADL) is the component remaining after cellulose has been removedReference Stubbs, Kennedy and Fortuna36.
The method for the laboratory incubation was similar to that of Fortuna et al.Reference Fortuna, Harwood, Robertson, Fisk and Paul37. Soil was collected from four plot replicates of the untreated control in the field experiment to a depth of 15 cm. Soil cores from each individual field replicate were composited, passed through a 2-mm sieve, and pre-incubated at room temperature for 7 days. Incubation vessels were 120- ml specimen vials (diameter 53 mm, height 60 mm). Pre-incubated soils (50 g oven dry equivalent) were weighed into the specimen vials and packed to a bulk density of 1.2 g cm−3. Air-dried residues were cut into 5–7 cm lengths and were mixed into the soil with a spatula such that less than 10% was visible from the surface, to simulate rotary spading, cultivation that uses rotary motion to turn spade-shaped blades to invert the soil surface. Incubations were maintained at 40% water-filled pore space (WFPS), 18% gravimetric water content. Once a week, soil samples were weighed and less than a gram of distilled water was added to the soil surface of each vessel with a pipette to maintain WFPS at 40%. The caps were not tightly sealed, which allowed gas exchange, but slowed drying. Temperature was maintained at 25 °C. There were five treatments, each with three replicates and eight sample dates, for a total of 120 incubation vessels. Specimen vials were removed and sampled 0, 7, 15, 28, 50, 70, 106 and 157 days after set-up and inorganic N, (NH4+ + NO3−)–N was measured. Inorganic N was extracted from 10 g soil samples with 100 ml of 1 M KCl. Samples were shaken on a reciprocal shaker for 1 h and then filtered through No. 42 Whatman filters. Aliquots were run on an automated, continuous flow QuikChem 8000 Injection Flow Analysis System (Hach Instruments, Loveland, CO). Nitrate–N was determined using the cadmium reduction methodReference Gavlak, Horneck and Miller38. Ammonium–N was determined using a salicylate–nitroprusside methodReference Mulvaney and Sparks39. In addition, the electrical conductivity (EC) and pH of incubated soils at time intervals 7, 15, 28, 50, 70 and 157 were measured in 1:5 soil:H2O mixturesReference Gavlak, Horneck and Miller38.
Field study
Experimental design
Site description
The field study was conducted from September 2008 to September 2010 on a site located (longitude 122°18′W, latitude 47°0′N) at the Washington State University Puyallup Research and Extension Center, in the Puget Sound region of western Washington, USA. The soil developed in recent alluvium and is classified as a Puyallup fine sandy loam (coarse-loamy over sandy or sandy-skeletal, isotic over mixed, mesic Vitrandic Haploxerolls). The climate in Puyallup is temperate, characterized by mild, dry summers and cool, wet winters, with a mean annual temperature of 10.9 °C (1995–2010). Average annual precipitation is 1029 mm yr−1 (1995–2010) with approximately 75% of the precipitation received between October and March. The plot area has not been certified organic, but has been under organic management since 2004. The entire field received compost at approximately 34 Mg ha−1 dry matter in July 2008.
The field experiment was designed to evaluate the N contribution of a rye–hairy vetch mixture to organically grown sweet corn. The study was arranged in a randomized complete block split-plot design. Each of the four blocks contained randomized replicates of each treatment. Main plot treatments were cover crop planting date (early, late or no cover). Split-plot treatments, also randomized, were the N-fertilizer rates applied to sweet corn (0, 56, 112 and 168 kg N ha−1 as feather meal available N). Main plots measured 24.4 × 6.1 m, split plots measured 6.1 × 6.1 m. Early and late planting dates were mid September and early October each year and the rye–hairy vetch treatments were a 50:50 mixture by seed weight ratio. The N source was feather meal, a relatively fast release, commercially available organic fertilizer containing 12% N. Approximately 75% of the N is available in a growing season under maritime Pacific Northwest conditionsReference Gale, Sullivan, Cogger, Bary, Hemphill and Myhre40.
Baseline soil data
Soil samples taken to a 30 cm depth prior to cover crop planting in August 2008 at the start of the field experiment, indicated that phosphorus, potassium and pH levels were uniform across the field site. Bray-1 P content was 280 mg kg−1Reference Mehlich41 and NH4OAc extractable potassium analyzed using a Thermo IRIS Advantage HX Inductively Coupled Plasma (ICP) Radial Spectrometer (Thermo Instrument Systems, Inc., Waltham, MA) was 206 mg kg−1Reference Gavlak, Horneck and Miller38. Soil pH at the field site was 5.9Reference Gavlak, Horneck and Miller38.
Management
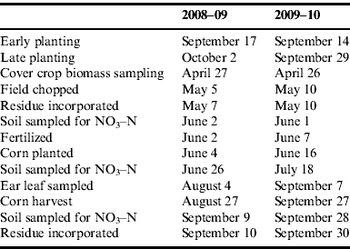
Common rye and hairy vetch were drilled together in the fall using a 3.1 m John Deere grain drill and chopped in the spring using a flail mower set 5 cm above the soil surface. Cover crops were incorporated using a rotary spader, a cultivator that uses rotary motion to turn spade-shaped blades to invert the top 25 cm of the soil. Seeding rate for the rye–hairy vetch mixture was 112 kg ha−1; all vetch seed was inoculated with Rhizobium leguminosarum biovar viceae to ensure N fixation. Feather meal was hand-broadcast across each split plot at the appropriate rate prior to planting sweet corn. ‘Golden Jubilee’ sweet corn was seeded in June with a Cole Planter on 1.5 m beds with 0.76 m between-row and 0.1–0.15 m in-row spacing at the rate of 86,100 seeds ha−1. Each plot was 8 rows wide. Weeds were controlled as necessary via cultivation (basket-weeder, tine-weeder and sweeps) and hilling. Irrigation was supplied as needed via sprinklers on 2.4 m risers. Approximately 20–25 mm of water per irrigation was applied on four dates in 2009 and on two dates in 2010. After harvest, sweet corn stover was flail mowed and incorporated with a rotary spader, and the plots were prepared for cover crops for the next season. Dates of field activities and sampling are listed in Table 3.
Dates of sampling and field activities.

Field measurements
In late April cover crop above-ground biomass was measured by harvesting a 6.1 × 0.91 m swath approximately 5 cm above the soil surface with a flail mower. The harvested forage from each plot was weighed wet, and a subsample (approximately 500 g) was collected and oven dried at 55 °C to determine dry matter. The remaining residue was returned to the plots. The dried subsample was ground to pass a 2-mm sieve and analyzed for total C and N using a TruSpec CN Carbon/Nitrogen Determinator (Leco). Three additional subsamples were hand clipped from representative 0.25 m2 quadrats in each plot, and proportions of rye, vetch and weeds were determinedReference Sarrantonio42.
Soils were sampled for NO3−–N analysis on three occasions: 3–4 weeks after cover crop incorporation, 3–4 weeks after corn planting, and after harvest (Table 3). Monitoring soil NO3− enabled us to determine the lag between cover crop incorporation and N mineralization, as well as the potential N credit provided by the cover crop mixtures. Ten soil samples (0–30 cm depth) were collected randomly from each plot with a 2.5- cm diameter probe and composited at each sampling date. Soil was immediately dried at 30 °C to stop microbial activity. Soil moisture was determined on a subsample dried at 105 °C. Dried soil was passed through a 2-mm diameter screen opening and (NO3−)–N content determined. Nitrate–N was extracted from 10 g soil samples with 100 ml of 1 M KCl. Samples were shaken on a reciprocal shaker for 1 h and then filtered through No. 42 Whatman filters. Aliquots were run on an automated, continuous flow QuikChem 8000 Injection Flow Analysis System (Hach Instruments). Nitrate–N was determined using the cadmium reduction methodReference Gavlak, Horneck and Miller38.
The in-season N status of corn ear leaves in the zero-feather meal plots was measured at silking. Ear leaves from 10 plants from the middle four rows of each plot were removed, dried at 55 °C, ground to pass through 2-mm screen opening, and total C and N determined via dry combustion with a TruSpec CN Carbon/Nitrogen Determinator (Leco).
At harvest, ears of corn were hand picked from within a 6.1-m section of an inner row in each plot. Fresh weight and number of corn ears were recorded. Total above-ground biomass of sweet corn plants was removed from a 6.1-m section of a second inner row in each plot and the fresh weights recorded. Ten plants randomly chosen from each biomass sample were run through a wood chipper in the field, mixed, subsampled (approximately 900 g wet weight), dried at 55 °C, and ground to pass through a 2-mm screen opening for total C and N analysis. Water content was determined and used to calculate dry weight. All plant residues (cover crop, sweet corn ear leaves and sweet corn biomass) were analyzed for total C and N by dry combustion with a TruSpec CN Carbon/Nitrogen Determinator (Leco).
Data analysis
Net N released from cover crop residues during the laboratory incubation was calculated by subtracting inorganic N content of the control soil from total inorganic N content of each cover crop treatment. The percent N release was calculated by dividing net N released from cover crop residue by total N content of residue applied. Net N mineralization data were fitted to a simple exponential model (Eqn 1)Reference Curtin, Campbell, Carter and Gregorich22, which assumes a single pool of potentially mineralizable N, mineralized at a rate proportional to its concentration:
 $$N_{\rm m} = N_{\rm o} [{\rm 1} - {\rm exp}\left( {kt} \right)]$$
where N m is mineralized N at time t, t is the incubation time, N o is the potentially mineralizable N pool, and k is the mineralization rate constant. Curve fitting of N mineralized was approximated by least-squares iteration with the SAS NLIN procedure (SAS 9.2, SAS Institute, Cary, NC, 2008). The confidence intervals for each parameter were used to test for significant differences among parameters for each treatment. Non-overlapping confidence intervals indicate significant differences in parameters. A two-factor factorial analysis of variance was performed using SAS PROC MIXED to determine the effect of the ratio of rye to hairy vetch biomass on N mineralization using SAS 9.2 (SAS Institute, 2008). Two- and three-way analyses of variance (ANOVAs) were performed on cover crop biomass, the percent of rye and hairy vetch in the total cover crop biomass, total residue N content, and soil nitrate–N, using the SAS PROC MIXED procedure. Means were considered significantly different at the Bonferroni adjusted P-value of 0.05. Pearson correlation was used to test for monotonic trends between: net N mineralization and residue quality, EC and soil nitrate–N, and EC and pH in the SAS CORR procedure. Growing degree days were calculated per the Baskerville–Emin methodReference Andresen43, using base temperature of 4 °C.
Results and Discussion
Nitrogen release from cover crop residues in the laboratory incubation
Contrary to Kuo and SainjuReference Kuo and Sainju13, we did not observe net N immobilization at any time during the incubation or field experiments. In our incubation study, the N concentration for R100 (the treatment with the highest C:N ratio) (Table 2) was above the critical value for net N mineralization observed by Odhiambo and BomkeReference Odhiambo and Bomke44 (14 g kg−1), but lower than that reported by Kuo et al.Reference Kuo, Sainju and Jellum45 (18 g kg−1). The literature demonstrates that there is a wide variation in the critical N concentration necessary for net N mineralization, ranging from 10 to 18 g kg−1.Reference Kuo, Sainju and Jellum45, Reference Vigil and Kissel46 The net accumulation of (NH4+ + NO3−)–N during the N mineralization incubation study was positive in all cover crop treatments at all sample dates (Fig. 1a), indicating that all the residues had C:N ratios sufficiently narrow (13–26) to allow for mineralization of N (Table 2).
Net nitrogen (N) mineralized from rye (R) and hairy vetch (V) residues as mg N kg−1 soil (a) and as percentage of residue N added (b) P ≤ 0.05.

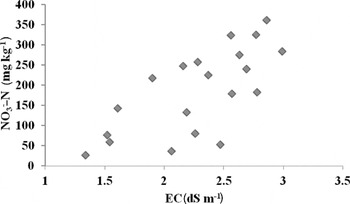
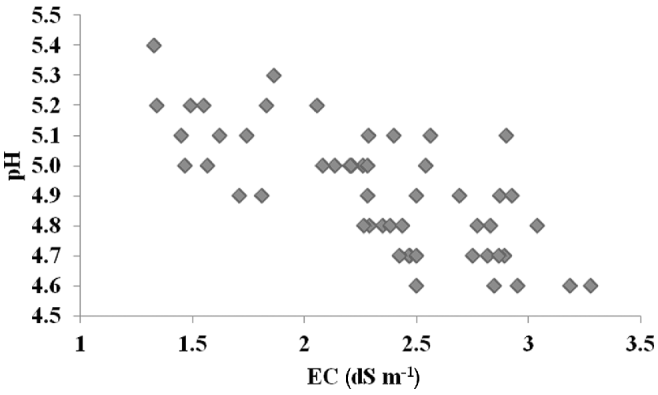
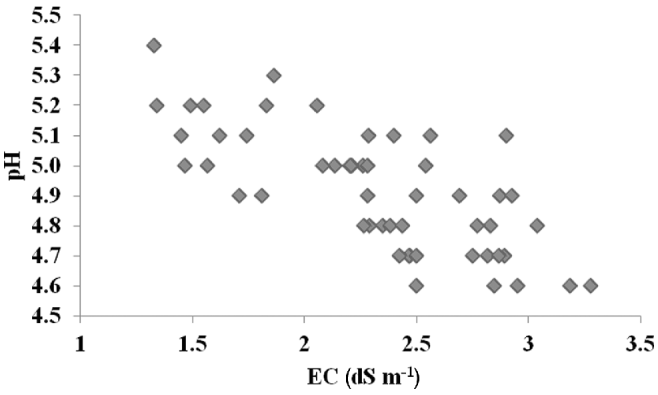
Nitrogen accumulation curves (Fig. 1a) show a rapid mineralization phase for all cover crop treatments during the first 28 d followed by a plateau. This plateau is partly due to the salt effect that occurs as soil NO3−–N builds up, resulting in an increase in EC (Fig. 2) and a decrease in pH (Fig. 3) associated with an increase in H+ ion activity produced during the process of nitrification. Residue amendments that contained vetch or a mixture of rye:vetch blends reduced the pH of the soil from a baseline of 5.5 in unamended control treatments by approximately half a pH unit. The EC of untreated incubated soils ranged from 0.50 to 0.73 dS m−1. Residue amended soils had EC values ranging from 1.3 to 3.0 dS m−1 after day 7 of the incubation. Although these values are considered only slight to moderately saline, EC values within this range decrease mineralization rates (C and N), nitrification and yields in most agricultural and horticulture crops (Smith and Doran)Reference Smith, Doran, Doran and Jones47. The negative relationship between pH and EC values in amended soils (−0.72, P = 0.001) and the positive correlation (0.70, P = 0.001) between EC and nitrate–N during the duration of our incubation measured via a Pearson correlation have been observed by other researchers across a range of field and laboratory conditionsReference Smith, Doran, Doran and Jones47–Reference Stamatiadis, Doran and Kettler49. Application of single and repeated injections of sludge increased EC and decreased pH in a terraced cropland of eastern Nebraska, USAReference Stamatiadis, Doran and Kettler49. During the study, a single sludge application temporarily reduced the soil pH by 0.40 unit. Amending and incubating soils with vetch and rye:vetch blends in this study resulted in a similar drop in pH. Increases in EC under laboratory conditions result in more dramatic decreases in microbially driven processes such as mineralization, nitrification and denitrification during laboratory incubationsReference Adviento-Borbe, Doran, Drijber and Dobermann48. The relative effect of pH versus EC on microbial processes in this study was confounded by a low baseline soil pH and ions other than nitrate (Cl−, SO42−, CO32−, PO43− and OH−), which contributed to increases in EC. Future studies will include measurements of gaseous N loss, and treatments that provide control pH and EC concentrations.
The relationship between EC (dS m−1) and nitrate–N (NO3−–N) in soil incubated for 150 days with residue amendments that included: rye, hairy vetch and rye–hairy vetch blends (50% vetch:50% rye and 75% rye:25% vetch). Pearson correlation was used to test for monotonic trends. The Pearson correlation coefficient (0.70) positively correlated EC and NO3−–N at P < 0.001.

The relationship between EC (dS m−1) and pH in soil incubated for 150 days with residue amendments that included: rye, hairy vetch and rye–hairy vetch blends (50% vetch:50% rye and 75% rye:25% vetch). Pearson correlation was used to test for monotonic trends. The Pearson correlation coefficient (−0.73) negatively correlated EC and pH at P < 0.001.
The proportion of N mineralized increased as the proportion of vetch in the mixtures increased (Fig. 1b), as expected based on the C:N ratios of the mixtures (Table 2). As little as 25% vetch residue combined with rye showed a significant increase in mineralized N compared with rye alone (Fig. 1a). This result is consistent with other findingsReference Kuo and Sainju13. The amount of N mineralized in the laboratory incubation depended on both the proportion of cover crop N mineralized, and the amount of cover crop N added to the incubation vessels. Because the incubations were set up at rates proportional to field yields of the various mixtures from LawsonReference Lawson16, the rye:vetch mixtures (R75V25 and R50V50) were amended at higher residue rates than the V100 treatment (Table 2). As a result, total N mineralized from the pure vetch and the R75V25 treatment was similar, even though the proportion of N mineralized from the pure vetch was greater (Fig. 1a and b).
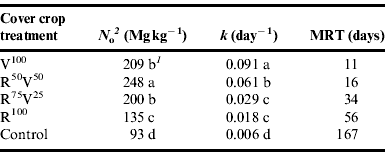
Net N mineralization from cover crop residues fit a single-pool first-order kinetic equation. The size of the mineralizable pool of N (N o) for R50V50 (248 mg kg−1) was nearly double R100 (135 mg kg−1) (Table 4). The other treatments (R75V25 and V100) had similar N o values that were slightly smaller than R50V50. N o was influenced by the proportion of the rye and vetch residues and the amount of residue applied. The rate constant k was highest for V100 and decreased as the rye component in the mixtures increased. Although N o was similar between V100 (209 mg kg−1) and R75V25 (200 mg kg−1), the rate constant k was significantly smaller for R75V25, 0.029 versus 0.091 day−1 (Table 4). This suggests that although similar total N release is expected for these treatments, the timing of release is much more rapid for V100. The slower release of N from R75V25 residues may be better timed with the critical period of crop N uptake and therefore enhance N uptake efficiency.
First-order parameters for net N mineralization1 from cover crop residues (R = rye, V = vetch) in a laboratory incubation study.
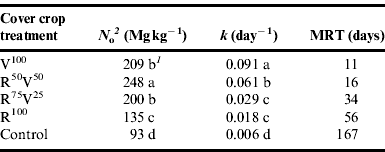
1 A non-linear regression equation was fitted. An ANOVA analysis was run on the individual parameters N o and k. Values within columns followed by the same letter are not significantly different at P ≤ 0.05.
2 N o, potentially mineralizable N pool; k, decay constant; MRT, mean residence time.
Effect of residue C:N and fiber fractions on N release
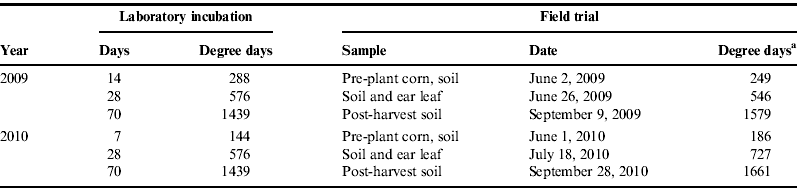
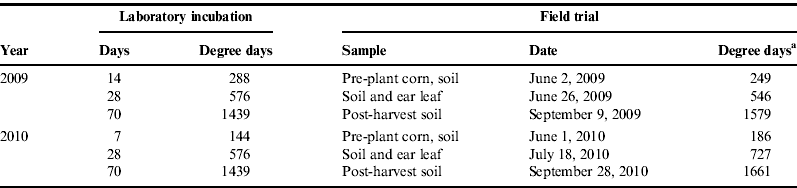
Residue C:N ratio was negatively correlated with net N release from rye, vetch and mixtures of rye–hairy vetch cover crops for the first 70 days of the 150-day incubation (Pearson correlation coefficients ranged from −0.83 to −0.93), which is consistent with other studiesReference Vigil and Kissel46, Reference Chaves, De Neve, Hofman, Boeckx and Van Cleemput50. The C:N ratio of residues was a better predictor than fiber characteristics. In this study, NDF was negatively, but more weakly correlated to net N mineralization through the first 70 days of the incubation. Pearson correlation coefficients between NDF and N mineralization ranged from −0.64 and −0.83. Others have reported that the NDF fraction and hemicellulose, a component of the NDF fraction, are sometimes weakly related with N release from plant residues, and neither are particularly good predictors of N releaseReference Jensen, Salo, Palmason, Breland, Henriksen, Stenberg, Pedersen, Lundstrom and Esala33, Reference Chaves, De Neve, Hofman, Boeckx and Van Cleemput50. Our data indicate that N release patterns from cover crop residues with narrow C:N ratios can be predicted based on the C:N ratio and correlated using growing degree days (Table 5). Other researchers have used similar predictorsReference Schomberg and Endale51.
Correlation of growing degree days elapsed between cover crop incorporation and soil sampling in incubation and soil and ear leaf sampling in field.
Field study: cover crop biomass, plant composition and quality
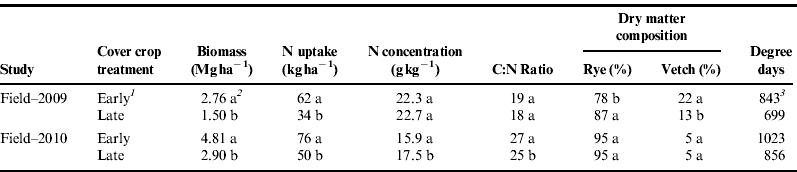
Planting date and year had a significant effect on cover crop biomass accumulation, species composition, and C:N ratio (Table 6). Rye was killed at the booting stage and vetch in the vegetative stage, which reduced the potential for high C:N ratios. The number of growing degree days accumulated between planting and harvest dates was greater in 2010 and may account for the difference in biomass production between years (Table 6). The ratio for the early planted cover crop biomass in 2009 was approximately 3:1 rye–hairy vetch, which is consistent with cover crop stands grown in a similar study at WSU Puyallup, WA, USAReference Lawson16. Delaying the planting date decreased the amount of hairy vetch in the biomass relative to rye in 2009. The early-planted cover crops in our study had biomass yields similar to other studies in cool climates, but total N was near the low end of the range, clustered with other data from western Washington (Table 1). Cool conditions in western Washington during the establishment and spring growth phases may limit hairy vetch production, resulting in lower N uptake. In 2010, cover crop stands were dominated by rye, which accounted for 95% of the total biomass. It is unclear why hairy vetch did not grow well in 2010. Lower tissue N concentrations and higher C:N ratios in 2010 compared to 2009 can be accounted for by the low amount of hairy vetch biomass (5%) present in those stands (Table 6). The cover crops effectively competed with weeds both years, with weeds averaging 3% of total biomass in 2009 and less than 1% in 2010.
Cover crop (R = rye, V = vetch) biomass yield, total N uptake, tissue N concentration, C:N ratio, and dry matter composition for residues sampled from the field in 2009 and 2010.
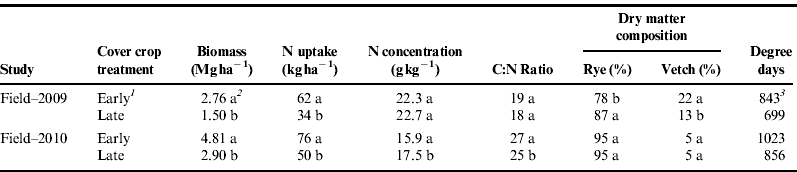
1 Early and late cover crops were seeded at a 50:50 rye–hairy vetch proportion in the field.
2 An ANOVA was run in SAS Proc Mixed. Values within a column and year followed by the same letter are not significantly different at P ≤ 0.05.
3 Degree days elapsed between cover crop planting date and incorporation. Calculated on a base temperature of 4.4 °C.
In-season soil nitrate and sweet corn ear leaf N
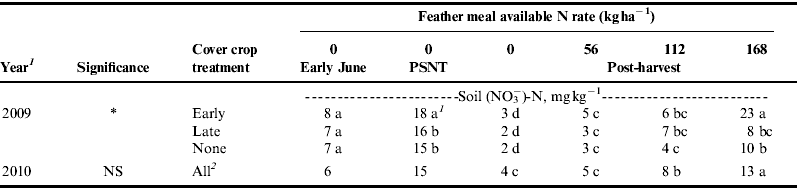
Cover crops were not a major source of soil nitrate for sweet corn uptake. The early-planted cover crop had a significant, but small effect on field soil NO3− levels in the zero-feather meal plots at the time of the pre-sidedress nitrate test (PSNT) in 2009, and no effect in 2010 (Table 7). The lack of response to cover crop derived N in 2010 was likely due to the lower proportion of hairy vetch in the cover crop mixtures compared with 2009. Nitrate concentrations in the late-planted cover crop treatment were not different from the control in either 2009 or 2010. In both years, soil NO3− in the zero-feather meal plots was highest at the time of the PSNT test (approximately 8 weeks after cover crop incorporation in 2009 and 11 weeks in 2010), and lowest immediately after sweet corn harvest (Table 7). All of the nitrate-N levels measured in the PSNT test were less than the sufficiency level for silage corn (25 mg kg−1) developed for manured systems in the maritime Pacific Northwest, USAReference Marx, Christensen, Hart, Gangwer, Cogger and Bary52.
The effect of cover crop and feather meal rate on soil nitrate (NO3−)–N concentration measured in early June, at pre-sidedress nitrate test (PSNT) time, and post-harvest. Zero-feather meal plots only were sampled in early June and at PSNT.
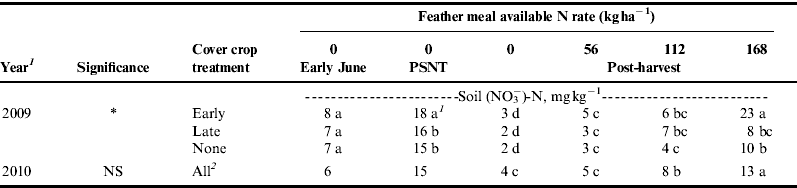
1 ANOVA was run in SAS PROC MIXED. Values followed by the same letter within each test date and year are not significantly different at P ≤ 0.05. *Indicates significance at P ≤ 0.05. NS = not significant.
2 There were no significant differences among treatments in 2010.
Ear leaf nitrogen is another in-season test for N sufficiency (Table 8). Regional standards for the Pacific Northwest report that sweet corn is N deficient when ear leaf N concentrations are below 28 g kg−153. The early cover crop treatment (without feather meal) had significantly higher ear leaf N concentrations (28.6 and 24.7 g kg−1 in 2009 and 2010) at silking compared with the no cover crop treatment without feather meal (26.0 and 21.2 g kg−1 in 2009 and 2010). Sweet corn in 2009 on the early cover crop treatment was the only treatment that contained sufficient N based on ear leaf analysis.
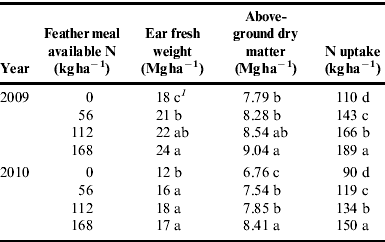
Sweet corn fresh ear yield and above-ground dry matter as affected by feather meal for 2009 and 2010 field seasons averaged over all cover crop treatments.
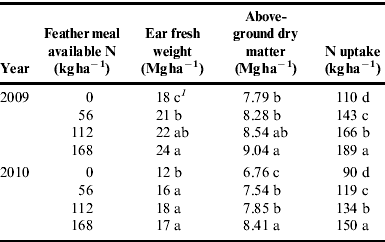
1 ANOVA was run in SAS PROC MIXED. Values followed by the same letter within a year and column are not significantly different from each other at P ≤ 0.05.
Sweet corn N uptake, dry matter production and fresh ear yield
Cover crop N contribution to the sweet corn was relatively small compared with soil N and feather meal N. Cover crop effects on sweet corn above-ground biomass, ear yield and N uptake were small and not statistically significant (data not shown; P = 0.05). Total N accumulated in the above-ground biomass of the early (mid September) planted cover crop was 70–75 kg ha−1 with ANR in the sweet corn estimated as 15–30 kg ha−1. Planting in October reduced cover crop N accumulation to 40–50 kg ha−1 and ANR to less than 10–20 kg ha−1. Feather meal effects were significant (P < 0.05) for all three measurements (Table 8), with an ear yield plateau occurring at the 112 kg ha−1 rate. The only N effect of cover crop was apparent in the post-harvest soil nitrate samples for the early cover crop in 2009 (Table 7), and then only at the highest feather meal rate, which was in excess of the peak rate for ear yield. There were no significant interactions between cover crop and feather meal treatments.
The lack of significant response to cover crops was likely a combination of low N supply from the cover crops (Table 6) and high background available N in the soil. Soil background N was 87–98 kg N ha−1 as measured by N uptake into sweet corn in the unfertilized, no-cover crop control plots. These measurements are consistent with field data from previous experiments with similar soil and environmental conditionsReference Gale, Sullivan, Cogger, Bary, Hemphill and Myhre40, Reference Cogger, Bary, Fransen and Sullivan54.
Nitrogen supply from cover crops—comparison of field and laboratory incubations
The incubations showed that the composition of the cover crop mixtures had a large effect on the initial mineralization rate, with pure hairy vetch (C:N = 13) releasing N at three times the rate of the R75V25 mixture (C:N = 21). The slower rate of N release from the rye–vetch mixtures may result in N release that is better timed with crop N uptake, increasing N uptake efficiency. In the field, cover crop N contribution to sweet corn was small compared with soil and feather meal N because of low cover crop N accumulation and the high proportion of rye in cover crop mixtures.
The number of growing degree days between cover crop incorporation and sweet corn harvest varied between year (1430 days in 2009 and 1650 days in 2010), but was comparable to the number of growing degree days accumulated over the first 70 days of the laboratory incubation (1439 days). Combining sweet corn N uptake data from the field trial with incubation N release data provided an estimate of cover crop available N. In 2009, early cover crop N content was 62 kg ha−1 and the composition was similar to a mineralization rate of 50% over a 70-day period that was measured in the R75V25 treatment of the incubation. This treatment provided an estimated 31 kg ha−1 of available cover crop N. In 2010, N content was 76 kg ha−1 with a composition similar to pure rye (70-day mineralization rate of 36%), providing an estimated 28 kg ha−1 available N. The late-planted cover crops provided less than 20 kg ha−1 of available N using similar calculations. Therefore, the N contribution of cover crops was insufficient relative to the seasonal N requirement of sweet corn.
Conclusions
The rye–hairy vetch blends grown in this study had modest biomass yields, similar to other regions with cool spring and fall climates, but contained less hairy vetch and had lower N accumulation than reported from other parts of the USA. Relatively cool temperatures during the critical times of establishment in the fall and biomass production in April likely favored rye over the hairy vetch. We did not observe immobilization of N in the pure rye incubation or in field plots containing rye and rye–hairy vetch mixtures, either in the field or in the laboratory incubations. This may be because the rye did not mature beyond the boot stage at the time of termination. The incubations showed that the composition of the cover crop blends had an effect on the initial mineralization rate, with pure hairy vetch releasing N at three times the rate of a 75% rye–25% hairy vetch (R75V25) blends. The slower rate of N release from the rye–vetch mixtures may result in N release that is better timed with crop N uptake, increasing N uptake efficiency. Our study indicates that there is the potential to manage rye, or predominantly rye, cover crop mixtures for improved soil quality without creating conditions that result in N immobilization in the field during the period of crop N uptake. While cereal–legume cover crop mixtures have been shown to be a reliable source of N to cash crops in other parts of the USA, this does not appear to be the case in the maritime region of the Pacific Northwest, USA. Long-term additions of cover crop biomass contribute to soil organic N, but cover crops were an insufficient source of seasonal plant available N in our system. Future research should address short-term increases in EC that influence the rates of microbial processes controlling mineralization and gaseous losses during incorporation of cover crop amendments under field and laboratory conditions.
Acknowledgements
Funding for this project was provided by the Agricultural Research Center at Washington State University through Emerging Research Issues Initiative and Hatch Projects 0711 and 0722, and the USDA-CSREES Integrated Organic Program. The authors acknowledge the technical assistance of Elizabeth Myhre, Bethany Smith and Jillian Hendershot. The authors would like to thank Dr John Doran for his editorial advice and constructive suggestions.