

Introduction
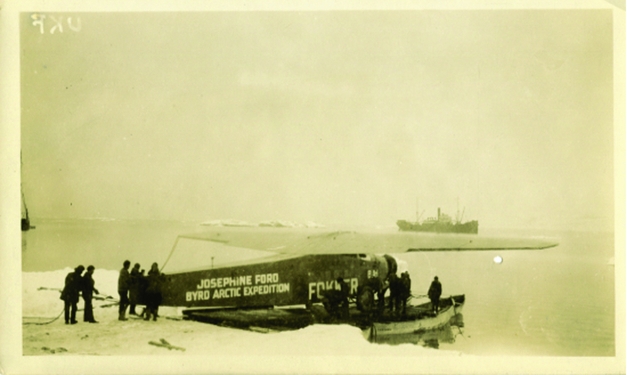
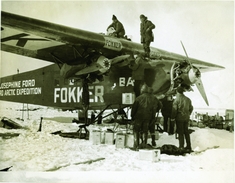
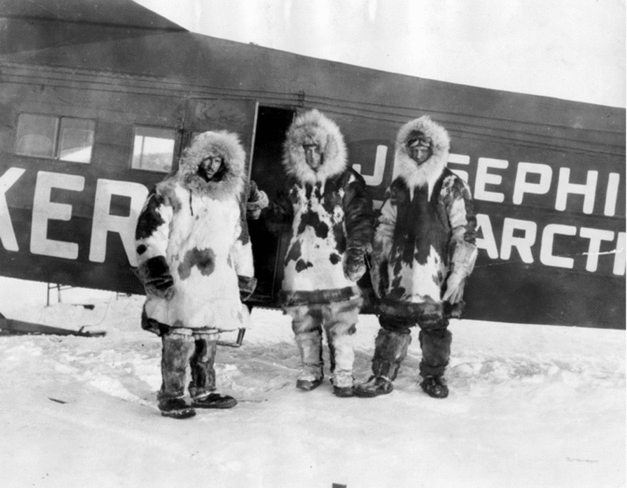
The 1920s saw a wave of public enthusiasm for the daring feats of heroic aviators, with Charles Lindbergh flying solo across the Atlantic in May 1927, and Amelia Earhart being the first woman to duplicate the flight the following year. In May of 1926, attention was focused on King's Bay, Spitsbergen, where American Richard Byrd in a Fokker tri-motor and Norwegian Roald Amundsen in a dirigible were both poised to fly over the North Pole, a new first. Fig. 1 shows Byrd's plane being transported to shore on a makeshift raft after his arrival in Spitsbergen. A recently-discovered photograph (Fig. 2) shows the aircraft, Josephine Ford, being fueled before an attempted takeoff. Byrd's crew smoothed a downhill runway in the snow, but three attempts to take off in his heavily overloaded craft were unsuccessful. After the runway was lengthened and some excess weight removed, Byrd and his pilot, Floyd Bennett (Fig. 3), succeeded on their next attempt in spite of having had little sleep for the previous 36 hours.
Byrd's Fokker tri-motor, Josephine Ford, minus tail and two of its engines, being ferried ashore on a raft after access to the dock was blocked by another ship. The Ohio State University, Byrd Polar and Climate Research Center Archival Program. BPRCAP,2012.12 Box 1, folder 10, image 1.

Fuel being added to Josephine Ford, equipped with skis, in preparation for an attempted takeoff at King's Bay, Spitsbergen. This photograph was recently rediscovered and donated to the Byrd Polar and Climate Research Center Archival Program at The Ohio State University. BPRCAP.2012.12 - Box 1, Folder 10, Image 10.

Prior to takeoff on his historic flight, Byrd (centre) and pilot Floyd Bennett (right) pose with his aircraft. The Ohio State University, Byrd Polar and Climate Research Center Archival Program. Papers of Admiral Richard E. Byrd, image #7842_1.

They flew over landmarks until reaching the north end of Amsterdam Island. From there they flew due north towards the North Pole, 1224 km away, with direction obtained by a sun compass (Byrd Reference Byrd1928: 190). They returned triumphant 16 hours later, somewhat sooner than expected, just two days before Amundsen left on his successful flight over the Pole. Richard Byrd's claim to have flown to the North Pole in 1926 has remained controversial and studies of his navigation continue. The controversy has centered not on direction but on distance (Newsom Reference Newsom2013); did he travel far enough to reach the Pole? A recent description of Byrd's flight is in Bart (Reference Bart2013).
Two types of errors inherent in his dead reckoning measurement of speed and distance are systematic effects due to changes in atmospheric pressure versus altitude during the flight and other errors arising in making his measurements. The first of these was addressed in a previous paper (Newsom Reference Newsom2013), and this paper is a study of the second type of error.
Method of dead reckoning
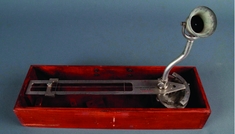
Byrd depended heavily on a Pioneer Instrument Company ‘Drift Indicator’ (Fig. 4) to find ground speed. Byrd was very familiar with this model, having directed its design based on a heavier device developed by Arturo Crocco for use in dirigibles (Bart Reference Bart2013: 215). As explained in Newsom (Reference Newsom2013), it was mounted over a hole in the bottom of the fuselage and Byrd would watch a feature on the ice appear to go between two wires (one fixed and the other moveable) mounted at right angles to the direction the plane was moving; the faster the ground speed, the less time it would take. At higher altitudes, the moveable wire was moved closer to the fixed wire to compensate for the slower angular speed. In this way, the time it took a feature to appear to go between the two wires depended only on the ground speed of the airplane. (The drift indicator had a second calibration with the wires closer together for use at low altitudes, where otherwise the two wires would be too far apart.)
Pioneer Drift Indicator, showing fixed (right) and movable wires used to find ground speed when the viewing aperture (upper right) was moved into position over the wires. Smithsonian National Air and Space Museum (NASM 9A08369).

Here are the steps a navigator needed to go through to record distance traveled. (I use the units Byrd reported: pressure in inches of mercury, altitude in feet, and speed in knots.)
-
1) record the time from his chronometer.
-
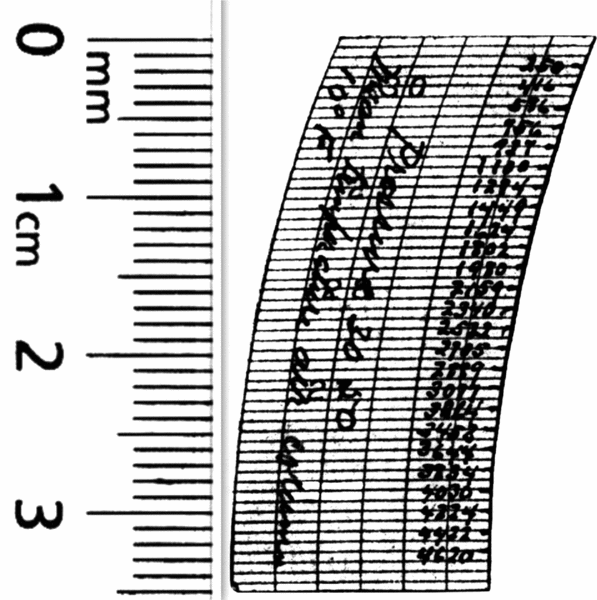
2) hold a calibration strip next to the pen on his recording barograph; the calibration strip was labeled with altitude for every change of pressure of 0.2 inches of mercury (Fig. 5).
Fig. 5.Photocopy of the calibration strip probably used by Byrd on his 1926 flight (Newsom Reference Newsom2013), with altitudes marked for different atmospheric pressures. The ruler at left shows that the original height of the strip was only 35 mm, making the altitudes difficult to read. The Ohio State University, Byrd Polar and Climate Research Center Archival Program. Papers of Admiral Richard E. Byrd, folder #4239.

-
3) set the moveable wire on the drift indicator to his altitude found from the barograph.
-
4) use a stop watch to time how long it took a feature on the ice to appear to move between the two wires.
-
5) look up on a table the ground speed that corresponded to the reading on the stop watch. The Pioneer Instrument Company provided such a table with each drift indicator that listed speed in miles per hour, or Byrd may have used a different table with speeds in knots. Pioneer Instrument Company sold a ‘Pioneer Speed Timer,’ a special stop watch reading knots, statute miles per hour, or kilometers per hour instead of seconds (Pioneer Instrument Company 1928), but Byrd did not use this since he refers (Byrd Reference Byrd1926a) to using a stop watch and tables to get speed. The Pioneer Drift Indicator could also be used to find ground speed without knowing altitude by recording airspeed and drift on successive legs flown on roughly orthogonal directions (Wright 1972: 78–80), but again Byrd makes no mention of performing such a manoeuvre so I assume he did not make use of this technique.
-
6) record the time from the chronometer again
-
7) subtract the earlier chronometer time from the later time to find the duration that the plane was flying at the derived speed
-
8) locate on another table the distance traveled between the two chronometer readings at the measured ground speed, and write down this distance
-
9) record a running total of distance traveled. Then cycle back to step 2) and repeat over and over.

The results of these observations should be recorded in a navigation log (R. Connor, personal communication, 29 January 2014). Byrd (Reference Byrd1926a) claimed he ‘never let three minutes go by without getting the speed and drift.’ Since he reported that 7h 40m elapsed between his last landmark (the north end of Amsterdam Island) and the North Pole, this would require over 150 repetitions of the above procedure. He also reported (Byrd Reference Byrd1928: 194–195) that he and Bennett took turns piloting, although he then listed the five times he relieved Bennett as pilot so Bennett could ‘stretch his legs’ and add gasoline to the fuel tanks. This sounds as if Byrd's turns as pilot were rather brief and he spent the great majority of the time on the flight north using the drift indicator, although Bennett (Reference Bennett1926) later claimed that in the first six hours of the flight Byrd did the piloting for about 20 minutes out of every hour.
Estimated random errors in dead reckoning
Each step has an associated error. I tried to duplicate the dead-reckoning procedure for his flight north to see how much error arose in each step of my simulation. I started with digitized readings of atmospheric pressure from Byrd's barograph recording at three-minute intervals from 1:38 to 9:05 GMT, and I calculated an altitude in feet for each pressure assuming a scale height of 25,246 feet and sea-level pressure of 30.50 inches of mercury. I made up a ground speed for each interval, varying from 74 to 91 knots, with an average of 82. Higher speeds generally corresponded with times when the plane was descending and slower speeds for ascending, but with a varying headwind or tailwind and random noise added to each value.
I made up times for each chronometer reading, with the time intervals varying between 2m 40s and 3m 25s, with an average of 3 minutes. The values for altitude, ground speed, and chronometer time were entered in a spreadsheet, and the time for a feature on the ice to appear to go between the two wires on the drift indicator (the ‘stopwatch interval’) was easily calculated. Since the Pioneer Drift Indicator has different scales for altitudes below and above 2000 feet, the calculated stopwatch intervals were much shorter (about 4 seconds) for altitudes below 2000 feet than they were for higher altitudes (which averaged 16.5 seconds). I used these data to generate a navigation log for my simulation.
To simulate the setting of the movable wire on the drift indicator, I printed on two strips of paper the same altitudes engraved on the drift indicator for both low (below 2000 feet) and high altitudes. I taped these strips on a slide rule where the movable cursor served the function of the movable wire on the drift indicator.
My printed navigation logs were from spreadsheets usually with the following columns:
-
A) serial number for each reading
-
B) time (chronometer reading), with steps of approximately three minutes but with small random variations
-
C) the stopwatch interval in seconds calculated as described above
-
D) blank column to be filled in with altitude I found from the barograph recording
-
E) blank column for entering derived speed in knots
-
F) blank column for entering derived distance traveled in the time interval, in nautical miles (nmi)
-
G) blank column for entering the accumulated distance traveled in nmi.
I also printed two tables (one for altitudes below 2000 feet and the other for higher altitudes) giving distance traveled versus the stopwatch interval, and a two-dimensional table listing distance traveled as a function of ground speed and time interval between the chronometer readings.
When I tried the simulated navigation, it quickly became clear that I could not use a copy of the original barograph recording. Altitude could vary considerably in a few minutes so it was impossible to place the calibration strip at exactly the right time. This would not have been a problem for Byrd, since he could use the position of the barograph pen when the reading was made. To make the simulation more realistic, I printed barograph recordings with small straight lines to show the barometric pressure every three minutes (with every five lines labeled with the serial number).
The most challenging part of doing the simulation was reading the tiny printing on the calibration strip. The barograph took chart type 1068, which has a width of only three inches (76 mm) for a range of atmospheric pressure from 19 to 31 inches of mercury. Since the calibration strip was labeled with altitudes for every 0.2 inches of mercury, they were written only 1.27 mm apart. The writing had to be tiny and was barely legible. I found reading and interpolating the altitudes 150 times over many hours to be stressful, which could affect the accuracy with which I could do the other steps in the navigation.
Results
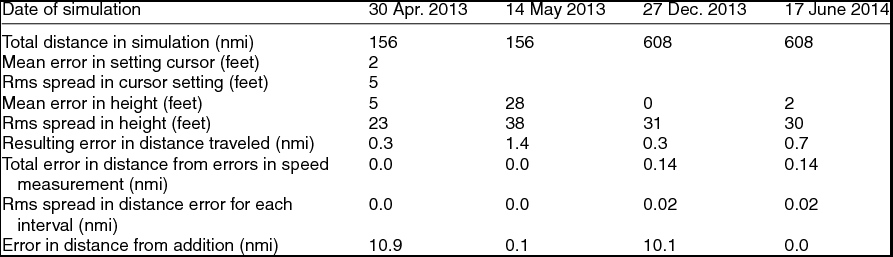
Once each simulation was complete, it was straightforward to compare the altitudes and speeds assumed in generating the spreadsheets with the values I found in the simulations. The results are summarised in Table 1. After the first run, on 30 April 2013, it became apparent that the cursor for the slide rule/drift indicator could be set accurately enough that errors in such settings were small (typically a few feet) compared to uncertainties in the derived altitude from the barograph. Hence the slide rule was omitted in the other simulations.
Results from the four simulated navigation sessions

Overall, I was quite surprised at how accurate my results were. Typical errors in derived altitude were about 30 feet, but for three of the simulations the individual errors were nearly as likely to be positive as negative so these errors largely canceled out, and errors in reading altitude contributed to an error in total distance traveled of less than a nautical mile. For the simulation of 14 May 2013, I wore gloves to better simulate Byrd's experience, and in this case the derived altitudes showed an average bias to a higher altitude. But even this bias corresponds to less than 1% of the distance traveled.
Errors in derived distance from errors in converting stop-watch interval to speed and in converting speed to distance traveled were negligible; this was done easily and accurately. The error in total distance traveled and the root mean square (rms) scatter in distances derived from individual readings were identical for 27 December 2013 and 17 June 2014; this resulted solely from round-off error, since the stop-watch intervals were tabulated to the nearest tenth of a second. While my simulations revealed nothing about how accurately Byrd could measure the time intervals with his stop watch, they do reveal that a typical stop-watch error of 0.025 seconds (equivalent to rounding the time to the nearest 0.1 second) corresponds to an error in derived distance traveled for the simulations reported here of only about 0.14 nmi. Even if Byrd's random errors with the stop watch were a factor of 10 or 20 times larger than this, the resulting error in his estimate of distance traveled would seem negligible.
It is important to emphasise that Byrd, doing navigation in a very difficult real-world situation, very likely had much larger accumulated errors than the small errors in my simulations. For instance, how often did Byrd lose track of which feature on the jumbled ice field he was tracking as it moved between wires of the drift indicator? Also, ‘[u]nless the air was perfectly smooth, the navigator attempting to measure either drift or groundspeed by tracking an object with the driftmeter was hampered by every slight motion of the aircraft’ (Wright Reference Wright1972: 140). Byrd (Reference Byrd1926a) claimed that for his flight the ‘air was smooth and the plane gave a steady platform,’ but there still should be some error introduced by airplane motion. Over a long flight errors due to pitching motion would mostly cancel out, but the large swings in altitude shown on the barograph imply that keeping the plane level during the flight was not a high priority. (Several factors could have contributed to changes in altitude. Sperry (Reference Sperry and Woodhouse1917: 108–109) noted that bringing a plane close to the surface on a long flight is useful to reset the sea-level pressure on the altimeter, but Byrd's plane apparently did not get close enough to sea level to use this technique. Byrd (Reference Byrd1926b: 9–10) reported dozing off while relieving Bennett as pilot, being awakened by the increased speed of the motors ‘to find the plane diving toward the ice.’ Byrd also reported (Byrd Reference Byrd1926b: 28) on the return flight he flew at various altitudes to take advantage of different wind speed and direction at different altitudes.)
Wright (Reference Wright1972: 161) noted, ‘[T]oward the end of a long flight, mistakes are easily made in the simplest computation.’ In my simulations the largest source of error in total distance traveled came from simple mistakes in adding up distances from the individual three-minute segments. After hours of repeating the navigation steps many times, especially trying to read the tiny writing on the calibration strip and then interpolating for the current atmospheric pressure, accurate addition was a casualty. In two cases, errors in addition amounted to more than 10 nmi. All these errors, however, are considerably smaller than the likely systematic errors due to changing atmospheric conditions reported in Newsom (Reference Newsom2013).
Discussion
My navigation was done when I was fairly well rested, at room temperature in a quiet place devoid of pressure, while Byrd had had little sleep in the previous 36 hours, it was cold and very noisy, the plane was vibrating, his survival for the next few hours was far from assured, and he had other distractions (checking the drift caused by cross winds and correcting Bennett's piloting, taking an occasional sextant sight, etc.). Byrd (Reference Byrd1926b: 20) said looking at the bright sunlit snow caused his ‘right eye to get the first symptoms of snow blindness’ and he had to shift to his ‘left eye, and hoped that it too would not give out.’ This had to make reading the calibration strip even more difficult. He also reported (Byrd Reference Byrd1928: 192) frostbite on his face and one hand, which likely made holding the calibration strip accurately on the barograph even harder. How this contributed to errors in dead-reckoning is difficult to determine.
One check I could do was to see what effect vibration from flying in a piston airplane had on using a drift indicator and on reading the barograph recording. I made a sighting device with several cross wires that I could attach to the window of an airplane with suction cups to simulate the drift indicator. I flew in a C-45 Expeditor (a 1930s version of a Beechcraft Model 18), with twin piston engines. Vibration did not seem to make any difference on how well I could note when an object on the ground crossed one of the wires of my drift indicator, although the aperture I used for viewing was fixed to the body of the device and not movable as Byrd's was and this could have caused more vibration for Byrd. The altitudes on the calibration strip did not seem harder to read than they did on the ground. (Since I could not cut a hole in the bottom of the plane, which is needed to use the drift indicator properly, I could not measure a ground speed to check for accuracy.)
If we had a copy of Byrd's navigation log from the flight, we could look for errors similar to what I did for my simulations; that would answer many of the unresolved questions about his dead reckoning. The three-man National Geographic Society (NGS) committee appointed to examine Byrd's navigation reported (NGS 1926a) that they ‘carefully examined Commander Byrd's original records of his observations en route to and from the North Pole. These records are contained on two charts on which Commander Byrd wrote his observations, made his calculations, and plotted his positions.’ Byrd's report to the navy held in the Byrd Polar Research Center at The Ohio State University is apparently a copy of the report examined by the NGS committee, and it makes no mention of such charts, although in his later book (Byrd Reference Byrd1928: 201) he reports supplying ‘my charts and records’ to the navy. His navy report does include his sextant observations and their interpretation. There is no explicit reference to data obtained with the drift indicator. It would be strange to characterise the navigation log for his dead reckoning navigation as ‘charts,’ and a complete navigation log of the flight north, with over 100 observations, probably would not fit on two ‘charts.’ If Byrd's navigation log was not submitted to the NGS committee, it is remarkable that they did not request it. The main question then is, ‘Why did Byrd not send his navigation log to the NGS?’
Including suggestions from others, I was able to come up with five possible answers:
-
1) The records were inadvertently lost.
-
2) Byrd maintained written records during the flight, but once the flight was over he saw no reason to keep them and threw them out. This seems unlikely. They could be strong evidence for his having reached the Pole, plus they would be a detailed souvenir of the most important thing he had done in life up to that point. Knowing the attention his flight was attracting, Byrd must also have realised that the written records could have been sold to raise money to pay for some expenses incurred in the expedition.
-
3) Byrd went over the log after the flight and realized they contained mistakes. Although any such errors might have been relatively small and might not have negated his claim to have reached the Pole (meaning he was close enough he could clearly see the Pole at his farthest north point), it could diminish his image as a careful navigator and make his flight seem prone to blunder. Hence he never made the records public.
-
4) Byrd was aware that mistakes can easily creep in on such a long flight but realised that he would be better off if he never checked the records after the flight. The public accepted that he had reached the Pole and his making the data public would not add to the acclaim he was to receive. Knowing, however, that there might be significant errors, Byrd may have realised there was nothing to be gained by his discovering them; as long as he did not check his numbers later, he could honestly believe he made it to the Pole.
-
5) Byrd did not keep a detailed navigation log during his flight, but rather mentally figured an average speed for each hour.
Byrd's Reference Byrd1928 book reports that he ‘submitted everything’ (charts and records) to the navy. At least one statement in the book (whether wind from the north commenced before or after he began his return flight) is inconsistent with a report he made soon after the flight (Newsom Reference Newsom2013), so his claim in the book to have submitted ‘everything’ may be a misstatement. It would of course help if the charts were available for examination. National Geographic Magazine (NGS 1926b) reports that Byrd ‘transmitted reproductions of his charts . . . to a number of the leading geographical societies in the world for their archives,’ but Bart (Reference Bart2013: 361) notes that the ‘in-flight records – the two charts – have not been located by modern researchers and remain missing to this date.’
However, if Byrd did submit all his navigation records to the navy as he reported and a navigation log was not included, then Byrd's dead reckoning positions were subject to errors in how well he could mentally average the derived speeds for each hour. Byrd reported (Reference Byrd1926a) his latitudes from his dead reckoning once every hour after passing Amsterdam Island, which shows distance traveled in nmi (and hence speeds in knots) as 77, 77.5, 82.5, 78.5, 80.5, 81, and 81.5. If these values came from adding up distances traveled on individual three-minute segments in a navigation log, the value after the decimal point should have been random, but instead every value ends in either .0 or .5. It's hard to see why this would happen unless Byrd was writing down his impression of the average speed for each hour. This would mean an important possible check on his dead reckoning cannot be done, and his distance traveled may be subject to unconscious bias, overestimating how far he had flown.
The only independent check Byrd could make on his dead-reckoning estimate of distance traveled was by making several sextant observations of the sun. If the above interpretation is correct (that Byrd listed distance traveled solely from mentally averaging ground speeds for each hour traveled north), this implies his sextant readings were not used to correct any accumulated errors in distances measured with the drift indicator. The sextant readings recorded in his diary of the flight (reported by Goerler Reference Goerler1998) have been controversial, but these readings appear not to have affected the distance Byrd believed he had traveled north.
To see how accurately I could obtain distance traveled by mentally averaging speeds, I repeated the 150 dead-reckoning simulations described above but without writing anything down except my impression of the average speed at the end of each hour of the simulation, doing something distracting between each speed determination. As the hours went by, I felt more and more as if I was just guessing, trying to remember if there were times in the past hour when the speed was especially fast or slow. When I was finished, however, I was most surprised to see that the total distance derived from my estimated speeds differed by only 1.5 nmi from the actual distance used to generate the simulated data. (The rms scatter in the error for each hour was slightly less than 1 nmi.) This was considerably better than the average of the errors in total distance traveled I made when I wrote down a detailed navigation log for the four simulations described above. If Byrd did indeed estimate distance from a mental averaging of speeds over one-hour intervals, he was spared making errors in addition that plagued my navigation logs.
The errors considered in this paper are small, so the uncertainty in how close Byrd came to the Pole is dominated by other factors (for example tracking features on the ice using the drift indicator with impaired eyesight, possible blunders induced by sleep deprivation, unconscious bias from mentally averaging ground speeds for each hour, and variations in atmospheric conditions during the flight as discussed by Newsom (Reference Newsom2013)).
Acknowledgements
Tom O’Brien and Michael Capriotti provided useful suggestions or feedback, and Rai Goerler was always a valuable resource. Laura Kissel was her usual helpful self in finding assets at the Byrd Polar Research Center at The Ohio State University. Roger Connor's advice on the use of navigation logs was valuable. Belinda Hurley helped locate useful references on aerial navigation in the early part of the twentieth century and David Brewer was most helpful in building the sighting device I attached to the airplane window to simulate timing with a drift indicator. Questions raised by a referee led to useful additions. My wife, Ann Newsom, carefully read and suggested improvements to the manuscript. Their assistance is gratefully acknowledged.