Category learning is a type of basic learning. The act of classifying stimuli and contexts into categories gives individuals information about all the elements that fit into a category (Anderson, Reference Anderson1991). This process allows human beings to learn the characteristics of other elements belonging to the same category by generalization and transference. Thus, the learning process allows us to identify the category a stimulus belongs to and to distinguish one category from another, e.g. animals and humans, maritime and land transport, food and non-food items, etc. (Minda & Ross, Reference Minda and Ross2004). Moreover, when individuals adequately classify they can predict how the elements within the category will act and how can they interact with each element (Hammer, Diesendruck, Weinshall, & Hochstein, Reference Hammer, Diesendruck, Weinshall and Hochstein2009). For example, it is not necessary to have an experience with each and every cat to tell if a certain animal is a cat, or to predict how one cat will act. We just need to know the characteristics of this subspecies of mammal.
Thus, category learning is essential to establish a proper adaptation to the context and therefore to achieve school success (Rabi & Minda, Reference Rabi and Minda2014). Schoolchildren should learn to distinguish between invertebrates and vertebrates, between chemical and physical processes, between plane and solid geometric shapes, etc. Consequently, it is coherent to expect that when comparing children of the same age, those who have learning difficulties in a category learning test may also exhibit difficulties in school learning. It is for this reason that various authors have studied the process of category learning. To summarize, the most studied variables have been the age of children (Hammer et al. 2009; Huang-Pollock, Maddox, & Karalunas, Reference Huang-Pollock, Maddox and Karalunas2011; Minda, Desroches, & Church, Reference Minda, Desroches and Church2008; Rabi & Minda, Reference Rabi and Minda2014) and the execution variables while solving the category learning tasks (Santacreu & Quiroga, Reference Santacreu and Quiroga2016).
The Relation Between Age and Category Learning
Recently, several authors have studied the relation between age and performance in objective category learning tasks (Minda et al., Reference Minda, Desroches and Church2008; Hammer et al., Reference Hammer, Diesendruck, Weinshall and Hochstein2009; Huang-Pollock et al., Reference Huang-Pollock, Maddox and Karalunas2011; Rabi & Minda, Reference Rabi and Minda2014). They compared the results obtained by adults and children of different ages in objective learning tests. The tasks used in the different studies were highly variable. With regard to the type of stimuli, all the tasks use visual stimuli although some tasks present real objects and others present stimuli created ad hoc. With regard to the type of categorization processes needed, some tasks required perceptual categorization and others conceptual categorization. By perceptual categorization, individuals classify stimuli depending on the perceptual similarity of one stimulus to another. For example, classifying objects as a function of their color or size. On the other hand, conceptual categorization is based on what stimuli are, what they do, and their use, etc. In this process, the perceptual information is turned into conceptual form (Sloutsky, Reference Sloutsky2010). By conceptual categorization we create the notion of classes, such as animals, plants, vehicles, and furniture (Mandler, Reference Mandler2000). With respect to the training procedures, there is also great variance across the studies. In the following paragraphs we briefly describe the details of these studies.
Firstly, Minda et al. (Reference Minda, Desroches and Church2008) investigated the performance of children and adults in perceptual category learning tasks. They created sets of stimuli that differed in their size, shape and color. Seventy-seven children aged 3, 5 and 8 years old and twenty-four adults formed the sample. They found that the 3-year-old children were not able to discriminate any kind of categories. By contrast, children aged between 5 and 8 learned the categories when the category classification criteria concerned only one characteristic of the element, such as color. When the classification criteria concerned more than one characteristic, e.g. size, color and shape, only the adults were able to discriminate the categories. The authors interpret these findings within a multiple-system approach to category learning. With regard to age, these results suggested that the category learning process develops between 5 and 8 years old. We could assume that the process continues developing from 8 years old into adulthood, although it is not possible to elucidate the details and stages in this study.
Hammer at al. (2009) suggested that category learning could occur either by recognizing the common characteristics between the elements of a category or by identifying the characteristics that differentiate these elements from other categories. They hypothesized if the way of learning categories could have implications on the learning results, and consequently designed a study that consisted of two phases: Training and assessment. During the training phase, they sequentially displayed pairs of elements that could belong to either the same category or to a different one, based on perceptual characteristics. The first group of participants watched pairs of elements belonging to the same category and were informed that the elements belonged to the same category. The other group watched pairs of elements belonging to different categories and were informed that the elements belonged to different categories. After the training phase, the assessment phase tested whether the participants had learned the categories. The participants had to decide if two random elements belonged to the same category or not. Using this method, they assessed twenty children aged from 6 to 9 and a half, twenty children aged from 10 to 14 years, and forty adults. The results showed that within the group of participants who had seen the pairs of the same category during the training, the three age groups performed at a similar level. However, within the group that had seen the pairs of different categories during the training, the categorization performance of the children aged from 6 to 9 and a half, was lower than the older ones, while the children aged between 10 and 14 performed as well as the adults. The authors concluded that the process of showing pairs of the same category promoted the learning of the category. With regard to the age of the participants we may conclude that categorization performance improved with age and this concurs with the findings of Minda et al. (Reference Minda, Desroches and Church2008). Moreover, in this study the children aged between 10 and 14 performed as well as the adults in every condition, which could mean that the ability to learn categories is completely developed at the age of 10.
With an aim similar to that of Minda et al. (Reference Minda, Desroches and Church2008), Huang-Pollock et al. (Reference Huang-Pollock, Maddox and Karalunas2011) compared children and adults’ performance in several perceptual category learning tasks. In this study, the stimuli were different Gabor patches, a series of black and white bars that differed in their orientation and thickness. As in the previous study, in one condition, the elements differed in a single characteristic. In the other condition, the elements differed in more than one characteristic. The sample consisted of eighteen children from 8 to 12 years old and 43 adults. The results showed that the adults outperformed the children in both learning tasks. Therefore, this study also confirmed the parallelism between age and the development of the ability to learn categories. Moreover, it complements the results of the study of Minda et al. (Reference Minda, Desroches and Church2008) with regard to the results obtained for the children between 8 and 12 years old. However, from our point of view, it would be better to use a similar task to make the results more comparable and to assess a larger number of children in each age group to elucidate further the stages of the process.
Lastly, Rabi and Minda (Reference Rabi and Minda2014) assessed ninety-nine children between 4 and 11 years old and fifty-six adults using a perceptual category learning task. The task was similar to the first condition employed by Huang-Pollock et al. (Reference Huang-Pollock, Maddox and Karalunas2011). They analyzed the differences between the following five groups: 4–5 years old, 6–7 years old, 8–9 years old, 10–11 years old, and adults. They found that children aged between 4 and 5, and 6 and 7 years old, performed significantly worse than the other groups. On the other hand, the group of children aged between 10 and 11 showed a similar performance to the adults. Taking these results into account, we can deduce that categorization performance improves at sometime between 8 and 10 years old, and at the age of 10 this ability seems to be fully developed. These findings are in line with the studies described above, although in this investigation the children under the age of 8 were not able to learn categories, in contrast to the results of Minda et al. (Reference Minda, Desroches and Church2008), where the children between 5 and 8 could learn the categories when the classification criteria consisted of only one characteristic of the elements.
In general terms, the results of these studies show that category learning improves with age. Most of these studies suggest that children between 5 and 10 years old are able to solve perceptual category learning tasks, but do not perform as well as adults. Children at the age of 10 attain a performance similar to the adults in tasks that concerned only one characteristic of the elements, but the adults solve the tasks better than these children when the classification criteria depends on more than one characteristic. Nevertheless, there are some contradictory results regarding children between 5 and 8 years old. Rabi and Minda (Reference Rabi and Minda2014) found that children under the age of 8 struggled with a task that concerned just one characteristic whereas Minda et al. (Reference Minda, Desroches and Church2008) found that children between 5 and 8 years old showed evidence of category learning.
The Relation Between the Execution Patterns During the Task and Category Learning
The differences in the performance in a category learning task could be related not only to age, but also to the way children solve the task. For example, a child who rushes to solve a task could make errors without being aware of them. The execution variables in the resolution of a category learning task that have been studied so far are the response speed, and the organization of the response sequence, in complex tasks.
Santacreu and Quiroga (Reference Santacreu and Quiroga2016) assessed four hundred and fifty schoolchildren aged between 7 and 12 using an objective category learning task: The Category Learning Test (CLT; Quiroga Estévez, Santacreu Mas, Montoro, Martínez-Molina & Chun Shih, 2011). The task displayed figures that belonged to different categories and the participants had to identify and learn which category was associated with the highest prize in order to click on it and achieve points. Learning the category of figures associated with the highest scores would lead to a better performance in the test. The stimuli consisted of schematic figures of real objects such as animals, vegetables, means of transport, etc. The category associated with the highest score consisted of mammalian animals.
Unlike the other category learning tasks, Santacreu and Quiroga’s test (2016), the CLT, is designed and configured to assess the level of learning achieved, as well as the execution patterns that participants display during the task. The CLT records each participant’s click in real time and is therefore able to assess the individual’s execution pattern during the task resolution. In every trial, there are simultaneously 150 elements, with up to 30 belonging to the target category. By contrast to the serial stimuli presentation, the CLT stimuli presentation enables the participant to explore around the screen during the trial length. The simultaneous presentation of all the stimuli facilitates the assessment of the level of organization of the participant’s clicks and the time between them. In addition the CLT enables the participant to execute a variable number of responses during the trial and means that different patterns of response are possible. Furthermore, this set-up gives more ecological validity to the task because of its similarity to real life, where many elements appear together with others and the response options are not dichotomous, but multiple and variable.
Santacreu and Quiroga’s results (2016) showed that some children did not learn the target category; they clicked on the same number of tokens belonging to the target category throughout the trials. On the other hand, some children improved quickly from the first trials and some children showed evidence of progressive learning during the task. The average proportion of clicks on the target figures correlates significantly with the execution variables studied: organization (r = .675) and response speed (interval between responses, r = .533). In summary, the participants who did not learn the classification of the categories in the CLT responded faster, and in a less organized way when trying to solve the task, than the rest of the sample.
The results of Santacreu and Quiroga’s study (2016) could be related to self-regulated learning models. These models highlighted the self-observation as a relevant component whereby the students can improve their performance (Schunk & Zimmerman, Reference Schunk, Zimmerman and Weiner2003). Similarly, van Loon, Destan, Spiess, de Bruin and Roebers (Reference van Loon, Destan, Spiess, de Bruin and Roebers2017) emphasized that the apprentices have to monitor their learning, to self-assess, and to pay attention to feedback, in order to solve their errors. In the study mentioned above, it would appear that some of the participants were unaware that they were acting too quickly, and were too disorganized to learn, and consequently were not able to improve their performance.
The Relation Between Academic Marks and Performance in a Category Learning Task
As previously mentioned, Santacreu and Quiroga (Reference Santacreu and Quiroga2016) showed that children whose performance was too fast, and too disorganized failed to learn the target category. The authors considered that these children might behave in the same way when undertaking school tasks and therefore their school performance might be deficient. This hypothesis is plausible taking into account that in category learning it is crucial to interact adaptively with the context. Therefore, it is essential to academic success (Rabi & Minda, Reference Rabi and Minda2014). If children have problems in learning the categories because they act too quickly and in a disorganized manner, they may also have trouble learning at school.
Therefore, we consider that it is necessary to analyze the influence of execution patterns on learning between children of the same age, and its relation to academic achievement. Furthermore, it would be necessary to study the interaction between age and execution patterns. It may be possible that only children of a specific age, for example, young children, have problems in self-regulating their performance.
Nevertheless, we did not find any publications that have studied the relation between performance in objective learning tests and academic outcome. For this reason, we believe that it is important to study the possible relation between performance in a category learning task, and the participants’ academic results as well as simultaneously, the effect of age and execution patterns.
Limitations of the Previous Studies
Despite some inconsistencies the cited studies suggest that the ability to learn categorization structures improves with age. It is clear that category learning progresses with age, but the stages of the progress still remain unclear. In addition, the studies did not employ the same tasks and this makes it difficult to unify the results. On the other hand, the number of children in each sample was small, so it is impossible to compare children of a specific age.
It is remarkable that all the tasks used in the cited studies, except for the CLT used by Santacreu and Quiroga (Reference Santacreu and Quiroga2016), were direct classification tasks, in which the participant had to determine if an element belonged to one category or another. The CLT is an indirect learning task because its instructions do not ask the participant to classify the elements but to click on tokens to achieve points. However, learning the category of figures associated with the highest scores will lead to a better performance in the test. Minda and Ross (Reference Minda and Ross2004) have argued that in real life situations people might not interact with an element only by classifying it. In spite of that, individuals usually classify objects in order to accomplish some purpose. For example, children have to learn the differences between several mathematical operations such as addition and subtraction in order to correctly apply each procedure, not just to classify the operations. In an indirect learning task, the participant is not asked to classify elements or to learn categories, but learning the categories will improve the performance in the task (Minda & Ross, Reference Minda and Ross2004). This is why an indirect learning task such as the CLT could attain more ecological validity. Taking this into consideration as well as the fact that the previous papers have not studied the development of category learning through an indirect learning task, we consider that it would be useful to assess children of different ages using an indirect learning task.
On the other hand, it should be noted that all the mentioned studies that have analyzed the influence of age, have only used perceptual category learning tasks. None of these studies have used conceptual category learning tasks. We believe that it would be an innovative contribution to the literature to study this issue using a conceptual category learning task. Furthermore, conceptual classification is very frequent in our daily lives: We classify objects depending on what are they useful for, we classify animals by their biological characteristics, people by our relationship with them, etc. The CLT used by Santacreu and Quiroga (Reference Santacreu and Quiroga2016) is a conceptual task because the participants have to classify figures according to type such as mammals, fishes, vegetables, etc. and not by their physical characteristics such as color or size. Therefore, we consider that the study of the influence of age in category learning using a conceptual task would be a relevant contribution to the field of education.
Besides, as mentioned above, to the best of our knowledge none of the research published to date has compared category learning between peers of the same age, or the interaction between age and execution patterns.
The Aims of This Research
If we are able to understand why some children cannot learn in a category learning task, we may be able to predict why these children experience difficulties in their academic life and therefore, we might be able to solve these difficulties. This study is aimed at testing whether the performance differences observed in a category learning task depend on the child’s age, or the way they solve the task i.e. the execution patterns employed or both; and furthermore, if there is an interaction between these two variables. In addition, we aim to check whether the performance in CLT is related to school achievement.
For this goal to succeed, a category learning test that records the execution patterns i.e. response speed and organization, is essential. The records of the sequence of the participant’s responses during the trial will allow us to analyze the execution patterns. In addition, we consider that an indirect and conceptual learning task has more ecological validity. For these reasons, and by virtue of all the advantages that have been mentioned previously, we will use a version of the Category Learning Test (CLT) in this study.
The hypothesis in the study are the following:
1. Our first hypothesis is that the general sample will improve their performance during the trials since Santacreu and Quiroga (Reference Santacreu and Quiroga2016) have demonstrated that the CLT can measure category learning. In addition, we would expect the proportion of children that learn during this task would be similar to that found by these authors i.e. 66 %.
2. Our second hypothesis is that, according to Minda et al. (Reference Minda, Desroches and Church2008), Hammer et al. (Reference Hammer, Diesendruck, Weinshall and Hochstein2009), Huang-Pollock et al. (Reference Huang-Pollock, Maddox and Karalunas2011) and Rabi and Minda (Reference Rabi and Minda2014), older children will outperform younger children, i.e. they will achieve a higher proportion of hits than the younger children. We also aim to study whether the children of a specific age will learn faster than the others, but we cannot hypothesize about this aspect because to the best of our knowledge, this factor has never been studied.
3. Our third hypothesis is that, according to Santacreu and Quiroga (Reference Santacreu and Quiroga2016) three different groups will emerge: One group will fail to learn, the second group will increase the number of hits during the period of the trials, and the third group will learn rapidly from the first trials.
4. Our fourth hypothesis is that, based on the results of Santacreu and Quiroga (Reference Santacreu and Quiroga2016), children who work slowly and in an organized way will show evidence of category learning. Thus, we expect to find a negative correlation between learning index and response speed, and a positive correlation between learning index and organization.
5. Our fifth hypothesis is that the student’s performance in the category learning task will be positively correlated to their school performance, which is in accordance with Santacreu and Quiroga’s (Reference Santacreu and Quiroga2016) conclusions.
Method
Participants
The participants comprised four hundred and sixty-six primary school children aged from 6 to 11, which represent the ages of the children who attend primary education in Spain. Two hundred and thirty of the participants were girls and two hundred and thirty-six were boys. The number of boys and girls per age was equivalent, Chi2 (N = 466) = 4.06; p = .541, and girls and boys did not differ in age in any of the 6 school years studied, F(4, 466) = .933; p = .444). The age breakdown of the sample was: Fifty-eight 6 year olds; one hundred and thirteen 7 year olds; one hundred and twelve 8 year olds, one hundred and three 9 year olds, forty-six 10 year olds and thirty-four 11 year olds. All the children were enrolled in primary education in a charter school in Madrid at the time of the test.
Measurements
All the participants completed a version of the Category Learning Test (CLT, Quiroga Estévez et al., Reference Quiroga Estévez, Santacreu Mas, Montoro, Martínez-Molina and Chun Shih2011). As indicated by Santacreu and Quiroga (Reference Santacreu and Quiroga2016) the CLT is a task in which children must learn to discriminate which of the categories of figures is associated with the highest score.
The task consisted of eight trials that lasted for 14 seconds. This version is shorter than the one used by Santacreu and Quiroga (Reference Santacreu and Quiroga2016) that lasted for 21 seconds. Each trial consisted of a 15 by 15 matrix (225 squares) on which 105 different figures are displayed simultaneously. When the participant clicked on a figure, the screen immediately showed the number of points scored i.e. 9, 3, 1 or 0 points. This matrix contained 30 target tokens featuring four mammalian animals valued 9 points; and 75 non-target tokens featuring other figures, 21 of which were worth 3 points, 20 were worth 1 point, and 34 tokens had 0 value.
Figure 1 shows a CLT item illustrating the screen displaying the scored earned when clicking on the token. The timer is present in every item, on the right side of the screen.
Example of a CLT’s Item where Four Different Tokens Have Been Clicked on

Variables
The CLT registers the click type i.e. which figure is clicked on, and the time the click occurs. From these data the following variables can be obtained: 1. Hits: H, number of 9-point tokens clicked on; 2. Errors by commission: (CE), the number of clicks on 3-point, 1-point or 0-point tokens; 3. Task Organization Index: (TOI), the sequence and order in which the screen is scanned, the participant will achieve one point in this variable each time that clicks on a target figure located in the same row or in the same line that the previous clicked figure, therefore, when following a pattern of lines or rows to solve the task the organization index will be high, and when clicking around the screen without following any patter the score will be low; 4. Learning Index (LI), the ratio of hits to the total number of clicks; and 5. Speed: The number of clicks per second.
To complement this information, we asked the school for the academic marks of each child. In Spain, the country where this study was carried out, children aged from 6 to 12 years old study in primary education, and are organized into six one-year ‘grades’. Every grade they study comprises approximately ten annual subjects e.g. math, science, language, gymnastics, music, art, etc. Each trimester, children obtain a mark ranging from 0 to 10 for each subject. In this study, the school only provided us with the global annual average mark obtained by each child in the grade that they were about to finish, at the moment of the test. Therefore, we were only able to use the average mark for each child.
Procedure
At the start of the study the participants’ legal guardians were informed about the study. They signed an informed consent document allowing their children to participate in the investigation.
The participants completed the task during school time on the last days of the academic year. They were divided into groups of a maximum 25 children in order to have one computer per child in the IT room, and to be properly supervised. Three psychologists checked that everything worked properly. Before starting the task, the instructions were projected onto a big screen until everyone had understood the goal of the task. The instructions indicated that the aim of the task was to identify and click on the figures associated with the best prize to get the highest score.
Once the data were recorded, each child’s score was calculated for each trial. Statistical analysis was performed using SPSS Statistics 24.0 package.
Results
With regard to the first hypothesis, we investigated whether the general sample learned during the task in order to find out if we could measure category learning using this task. Therefore, we calculated the average Learning Index (LI) for the whole sample, for each trial, i.e. the proportion of hits achieved. The LI of the whole sample increased along the trials from an LI = .37 on the first trial to an LI = 0.63 on the final trial. A Repeated Measures ANOVA indicated that there were significant differences between the trials F(7, 469) = 29.979, p < .001, ηp2 = .314, and evidence of learning between the trials can be seen in Figure 2. However, the standard deviation (SD) in every trial was very high (.32 < SD < .34), this indicates that there were considerable inter-individual differences. Having established this fact, we addressed the second part of the hypothesis: To analyze how many children learned in the task. This exploratory analysis was carried out determining how many children reached a learning criterion. The learning criterion established by the authors was a proportion of hits equal to at least double, that which could be achieved by chance alone. The proportion of targets/total of tokens was .285, therefore, children who obtained a proportion of correct clicks of .57 or more on the last trial, were considered to have learned the target category. In our sample, we found that 275 participants (59 %) had an LI ≥ .57 in the 8th trial, and 191 (41 %) did not reach the criterion.
Mean and Standard Deviation of Learning Index by Trial for the Whole Group

We addressed the second hypothesis by analyzing the influence of age on performance in the category learning task. Table 1 shows the means and standard deviations of the LI on the last trial for each age group. The Kruskal-Wallis test showed significant differences among the age groups H(2) = 48.475, p < .001. These results suggested that the older children learned more than the younger ones. We carried out a Mann-Whitney test to analyze the differences between each age group and its contiguous group. The results showed significant differences between two main age groups: Children aged between 6 and 7 years old differed significantly to children aged between 8 and 11 years old (6–8: U = 1,872.5; 6–9: U = 1,580; 6–10: U = 612; 6–11: U = 524.5; 7–8: U = 4510; 7–9: U = 4,008.5; 7–10: U = 1,561; 7–11: U = 1,279; p< .001 in all cases). There were not significant differences within these two groups (6–7 years old and 8–11 years old). Table 1 illustrates how the older children outperformed the younger children in CLT.
Mean and Standard Deviation of Learning Index on the Last Trial by Age Groups

These results showed that the categorization performance in the last trial of young children aged between 6 and 7 years old was significantly lower than that of the older children aged between 8 and 11. We also wanted to investigate if the learning pattern along the trials varied for each age. Therefore, we calculated the LI on each trial for each age. After that, we carried out a Repeated Measures MANOVA analysis to observe the interaction between age and learning index on each trial. The Pillai’s Trace, F(35, 2,290) = .646, p = .946, ηp2 = .01, indicated that the learning pattern along the trials was similar in all the age groups.
However, the standard deviation of the LI in each age group was very high (.28 > SD > .35) which suggests that the children in one of the age groups exhibited quite a different performance. As we suggested in the third hypothesis, and in accordance with these wide inter-individual differences, we carried out three cluster analyses of profiles (SPSS K-Means procedure) to identify if there were two, three or four groups with different modes of learning. The criteria used to choose the best solution were those used by Santacreu and Quiroga (Reference Santacreu and Quiroga2016): (a) ANOVA results: All variables have to contribute in a statistically significant way to the cluster configurations; (b) the number of participants should be balanced between them and (c) the clusters, i.e. the learning profiles in this case, should be theoretically sound. As expected, the cluster analyses, taking into account the LI on every trial, classified the participants in three different groups. The resulting learning curves are shown in Figure 3. The Low Learning Group (LLG) comprised 152 children, 77 girls and 75 boys that appeared not to learn anything along trials. These children started the task with a learning index (LI) of .32 and finished with an LI of .28. The High Learning Group (HLG) comprised 185 children, 91 girls and 94 boys that showed evidence of category learning since the first trial. In the second trial, they reached an LI of .70 that continued to increase slightly until the last trial when their ratio of hits was .90. The Medium Learning Group (MLG) comprised 129 children, 62 girls and 67 boys. Their performance improved slowly and progressively with practice along the trials. They started the task with an LI = .4 and finally ended it with an LI = .65.
Mean of Learning Index on each Trial by Learning Group

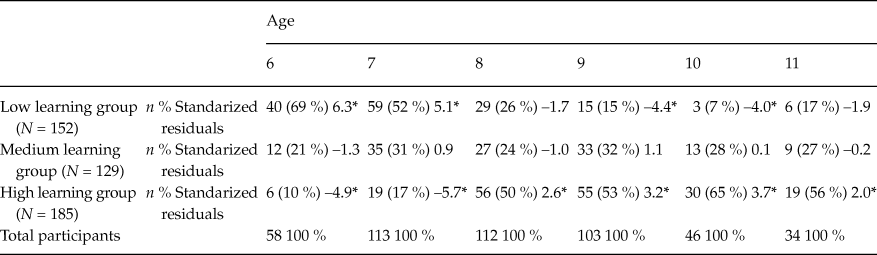
These results showed that there were three different learning profiles and that categorization performance differed between the age groups. These performance levels might have been a function of age; the low learning group being formed by the younger children and the high learning group by the older children. To investigate this further, we carried out an analysis to check if the low, medium and high learning profiles were present in every age group in the same quantity. Table 2 shows that the ratio of children that showed evidence of category learning since the first trials was larger in the groups of older children i.e. 50 %–65 %, than in the younger groups i.e. 10 %–17 %. By contrast, the percentage of children whose performance did not improve with practice was larger in the younger groups i.e. 52 %–69 %, than in the older groups i.e. 7 %–26 %. The Chi-squared test revealed that there were significant differences in age distribution among the groups, χ2(10, N = 466) = 108.44, p < .001). Nevertheless, these results did show that within every age group there were participants that learned quickly and reached a high LI, participants that learned progressively i.e. the MLG group, and others that struggled with the task and were categorized as LLG. Therefore, all the three learning profiles were present in all ages demonstrating that age is not the only variable that influenced categorization performance in the task.
Learning Groups by Age. Frequency, Percentage and Standardized Residuals

Note: *Significant standardized residuals (p < .05).
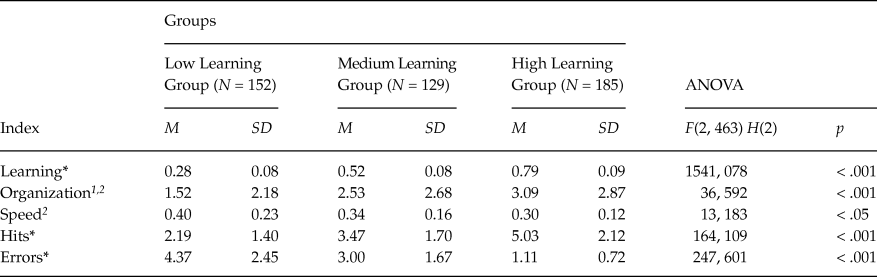
As we had considered in our fourth hypothesis, categorization performance could depend on variables other than age, such as the participant’s execution patterns during the task. In order to analyze the different execution patterns of the three learning groups we calculated the means and standard deviations of: Organization, speed, hits, errors and learning index (see Table 3). As expected, the ANOVA analysis showed that there were significant differences between the three groups in learning index. The Tukey-test showed that these significant differences were present between all the groups. Moreover, four Kruskal-Wallis analyses showed significant differences between the groups in organization, speed, hits and errors. Mann-Whitney tests indicated that these differences were between the three groups except for organization, where there were no significant differences between the MLG and HLG; and for speed, i.e. number of clicks per second, where there only were significant differences between the LLG and the HLG groups. The results indicated that the participants in the LLG clicked on a larger number of tokens than the other groups and their clicks were faster. Nonetheless, most of tokens clicked on were associated with a low score, i.e. errors were made. The LLG clicked on the tokens in a more disorganized way than the other groups. Moreover, the bivariated correlation between the learning index and speed was significant and negative (r = –.217, p < .01) and between the learning index and organization was significant and positive (r = .247, p < .01).
Means and SD of CLT Variables. Data from ANOVA, Kruskal-Wallis Test and Mann-Whitney Test Showing Significant Differences between the Groups

Note: 1 = significant differences among groups of low and medium learning (p < .05). 2 = significant differences among groups of low and high learning (p < .05).
*significant differences among the three groups (p < .05).
We also analyzed the evolution of the variables related to the execution patterns i.e. speed, organization and errors, across the trials. The results of the ANOVA with Repeated Measures analyses showed significant differences for every learning group between the response speed of the different trials, LLG: F(7, 145) = 29.112, p < .001, ηp 2 = .584; MLG: F(7, 122) = 6.309, p < .001, ηp 2 = .266; HLG: F(7, 178) = 15.461, p < .001, ηp 2 = .378. The same was observed for the errors along the trials, LLG: F(7, 145) = 23.665, p < .001, ηp 2 = .533; MLG: F(7, 122) = 4.298, p < .001, ηp 2 = .198; HLG: F(7, 178) = 33.976, p < .001, ηp 2 = .572. Specifically, the LLG that failed to learn the target category, started the task with a Speed Index of .26 clicks per second and an Errors Index of 1.99 errors for trial, and ended with a Speed Index of .69 and an Errors Index of 4.91, i.e. the LLG increased their speed and errors during the task (see Figures 4 and 5). The other two groups behaved in a different way (see in Figures 4 and 5): The HLG’s speed increased only from the fourth trial, when they had already reached a high LI because they had already learned the classification criteria, so their errors did not increase. It should be noted that the group that learned progressively, the MLG, decreased their speed by the second half of the task, and at that moment, they increased their learning index and decreased their error rate. With regard to organization, the results of the ANOVA with Repeated Measures analyses showed significant differences between the trials for every learning group, LLG: F(7, 145) = 4.899, p < .001, ηp 2 = .191; MLG: F(7, 122) = 8.282, p < .001, ηp 2 = .322; HLG: F(7, 178) = 14.074, p < .001, ηp 2 = .356. Figure 6 shows that the HLG increased its organization index the most, from the third trial, and this allowed the group to increase its response speed without making more errors. The MLG behaved in the same way but the effect was not as noticeable. The LLG did not vary its organization very much during the task: Despite an increment in the organization index during the second half of the task, the score never exceeded .4 points, and was considerably lower than the other groups.
Average Response Speed Index for each Trial and Learning Group

Average Error Index for Each Trial and Learning Group

Average Organization Index for Each Trial and Learning Group

With regard to our last hypothesis: To analyze the relation between academic marks and the CLT learning index, we divided the children into five groups based on their academic grade: 1st grade (equivalent to 6–7 years old), 2nd grade (7–8 years old), 3rd grade (8–9 years old), 4th grade (9–10 years old) and 6th grade (10–11 years old). We analyzed bivariate correlations between academic marks and CLT learning index in every academic grade. Contrary to our expectations, the correlations between academic marks and learning index were very low and not significant. Therefore, academic marks were not dependent on the ability to learn categorization structures. Furthermore, the correlations between all the remaining CLT indexes and academic marks were low and non-significant in every grade. We also carried out an ANOVA analysis to check if there was any interaction between the learning groups, their age and the marks. We considered that they might be an influence of the learning group neutralizing the correlations between LI and marks. Contrary to our expectations, no significant effects were found.
Discussion
In this study we aimed to test whether performance differences in a category learning task depended on a child’s age, on the way the task was solved i.e. the execution patterns, or on both variables, and if there was any interaction between these two variables. In addition, we aimed to analyze whether the performance in the Category Learning Task (CLT) was related to school achievement.
Firstly, we analyzed whether the general sample learned during the task in order to determine if the CLT measured category learning. Indeed, the sample showed evidence of category learning across the trials. However, we observed a high variability in the results attained in the CLT and this could indicate that some participants learned the target category but others did not. Therefore, we calculated the number of children who by the last trial had reached a proportion of correct answers that were at least equal to twice that expected by chance. We found that 275 participants (59 %) had a learning index of 0.57 or more in the 8th trial and that 191 participants (41 %) did not reach the criterion. This result shows that only the 59 % of the sample learned the classification criteria, therefore it was relevant to study why some of the children had learned but others not.
Based on the results of Minda et al. (Reference Minda, Desroches and Church2008), Hammer et al. (Reference Hammer, Diesendruck, Weinshall and Hochstein2009), Huang-Pollock et al. (Reference Huang-Pollock, Maddox and Karalunas2011) and Rabi and Minda (Reference Rabi and Minda2014), the performance differences could be related to the participants’ age. According to these results, we expected the older children to outperform the younger children. Therefore, we analyzed the relation between the categorization performance and the participants’ age. A comparison between the different age groups revealed that the learning index was higher for the older children i.e. 8–10 year olds, than for the younger children i.e. the 6–7 year olds. Hence, the participants’ age was related to the ability to learn the criteria that distinguish the categories. In addition, we analyzed whether the learning patterns across the trials differed with age, but results did not reveal any differences. Therefore, the average progression of learning index across the trials was the same for all ages, despite the older children having a higher proportion of correct answers. These results correlate with those of Minda et al. (Reference Minda, Desroches and Church2008), Hammer et al. (Reference Hammer, Diesendruck, Weinshall and Hochstein2009), Huang-Pollock et al. (Reference Huang-Pollock, Maddox and Karalunas2011) and Rabi and Minda (Reference Rabi and Minda2014), who reported that age is a relevant variable to explain learning in a category learning task.
However, the standard deviation of the learning index was still very high in every age group, meaning that some of the children within the age groups had quite different performances. Therefore, we postulated that there might be other variables in addition to age to explain learning in this task.
When studying the progression of the learning index across the trials we observed that there were 152 children in the Low Learning Group (LLG) that struggled with the categorization task, failing to learn the target category until the last trial. But conversely, 185 children in the High Learning Group (HLG) showed evidence of category learning from the first trial, reaching a proportion correct of 0.9 answers in the second half of the trial. This illustrates that learning occurred between the first and fourth trial. The remaining 129 children in the Medium Learning Group (MLG) showed evidence of category learning across the trials, but they did not achieve the performance of the second group. Their performance improved slowly and progressively with practice along the trials. According to the literature, we would have expected that the group that did not learn would correspond with the younger children, and the group that learned quickly would correspond with the children in the older group. The results did show that there were a large number of older children in the HLG, and that there were a large number of younger children in the LLG. However, there were children of all ages in all of the learning groups. Again, we considered that age was not the only factor that could explain the performance differences in the CLT. Therefore, we investigated other variables that could influence learning.
We anticipated that, as Santacreu and Quiroga (Reference Santacreu and Quiroga2016) revealed, the execution variables could influence performance in the task. We predicted that those children who worked slowly and in an organized way, would attain a higher learning index. Therefore, we hypothesized a negative correlation between response speed, which we defined as the number of clicks per second, and learning, and a positive correlation between organization and learning. As expected, the group who failed to learn the target category (LLG) responded faster than the other groups. Furthermore, this group increased its speed across the trials, clicking on more tokens in each trial and increasing the number of errors. By contrast, the group of children that learned progressively across the trials (MLG) decreased their speed from the fourth trial, decreasing their errors and improving their learning index from that moment onwards. The children in the MLG, unlike those in the LLG, seemed to be able to regulate their performance in order to optimize their learning. Lastly, the children in the HLG increased their speed from the fourth trial when they had already learned which tokens were associated with the best prize, and this was demonstrated in the learning index. Consequently, HLG achieved more hits without increasing the number of errors. However, the HLG speed was always slower than the LLG.
With respect to organization, the LLG showed a lower level of organization than the groups that learned the novel categories. This group did not follow any order in the rows and columns when clicking on the tokens and that appears to have interfered with their learning. The HLG showed the most increase in organization index during the trials. Maybe for that reason the group increased its response speed without increasing the number of errors. The children in the MLG acted in a similar way to the HLG but they did not achieve the same level of organization.
Consequently, and as we expected, the correlation between learning index and execution indices was significant and was negative for the speed index and positive for the organization index. However, the correlations that were found in this study were lower than in those of Santacreu and Quiroga (Reference Santacreu and Quiroga2016). These results may be explained by alluding to the abbreviated version of the CLT that was used, in which each trial lasted 14 seconds instead of 21. We believe that the participants may not have had sufficient time to reveal large individual differences in the execution patterns and therefore the correlations of these variables decreased. Notwithstanding, our results are in the same line as those of Santacreu and Quiroga (Reference Santacreu and Quiroga2016).
The results about the execution variables showed that the LLG was not able to regulate adequately its speed and the sequence of its responses to optimize their learning. They responded quickly and made mistakes, i.e. they did not increase their latency to improve their performance.
By contrast, the MLG is a clear example of self-regulated learning. As Schunk and Zimmerman (Reference Schunk, Zimmerman and Weiner2003) or van Loon, Destan, et al. (Reference van Loon, Destan, Spiess, de Bruin and Roebers2017) reported, self-observation is a relevant component whereby the student can improve their performance. Children in the MLG seem to have realized that they were going too fast and so decreased their speed response and, therefore, they could decrease their errors and improve their learning. On the other hand, children in the LLG were not able to do so. van Loon, de Bruin, Leppink, and Roebers (Reference van Loon, de Bruin, Leppink and Roebers2017) and Finn and Metcalfe (Reference Finn and Metcalfe2014) pointed out that this self-monitoring skill improves when children mature because they are more capable of accurately estimating their hits and errors. Nevertheless, on the basis of the results of the present study it would appear that at the age of 11 there were still a large percentage of children who were unable to self-monitor their own learning.
In addition, we expected to find a positive relation between performance in the CLT and the participants’ academic results. However, the results did not reveal any significant relation between learning and academic marks in any of the academic grades. A possible explanation for this unexpected result could be the low level of variability which was observed between children’s academic marks: i.e. the mean was 7.5 points, out of a maximum of 10, and standard deviation was less than one i.e. SD = .89. The low variability in the data may have impeded a high and significant correlation between variables. This lack of variability could be the result of two factors. The first, that basic education is planned on the basis that every student is able to attain the goals of the course, or the second, that perhaps teachers reward effort instead of results. It is possible that academic marks would vary more in higher education and we would observe their relation to category learning in that academic stage. However, this would require further research to be carried out. In addition, we have used the average of the marks in all subjects including gymnastics, music and art. It is possible that category learning is not as related to these kinds of subjects as it may be to others, and this fact could also explain the low correlations obtained. Therefore, in future studies, it would be interesting to investigate the relation between performance in category learning tasks and academic marks in specific subjects such as math, in which learning difficulties frequently arise (Blair & Razza, Reference Blair and Razza2007).
It is relevant to highlight that the similarities between the CLT and the tasks used by Minda et al. (Reference Minda, Desroches and Church2008), Hammer et al. (Reference Hammer, Diesendruck, Weinshall and Hochstein2009), Huang-Pollock et al. (Reference Huang-Pollock, Maddox and Karalunas2011) and Rabi and Minda (Reference Rabi and Minda2014) which have enabled us to study the influence of age in category learning. These similarities include the use of visual stimuli, the need to learn the target categories to pass the task, and the presence of numerous trials. However, there are significant differences between these tasks. In contrast with the traditional category learning tasks, the CLT presents several stimuli in every trial. The criteria for the classification of the figures is not perceptual, but conceptual. Furthermore, the instructions make the task indirect, they do not ask the participant directly to learn the target category. All of these characteristics revealed in this paper the influence on learning of the execution pattern. This is a determinant difference because it provides us with the clue to promote learning in children who struggled with the task.
Firstly, in the present study we have studied learning only in children aged from 6 to 11 years old. In addition, we were not able to assess children of 5th grade of primary education and the number of children of each age is unequal. It would be interesting to have information about the execution patterns of older children and adults in order to determine when in the development category learning is fully matured.
Besides, it is possible that some children, specially the younger ones, might classify the figures according to a perceptual criterion (4-legged animals) instead of on basis of a conceptual criterion (mammals). In future studies it would be necessary to change the target category in order to make it only possible to learn through conceptual criteria.
Regarding the relation between speed, organization and learning, in future studies it would be useful to investigate whether an intervention to promote self-monitoring and consequently slowness and organization, for example, the self-instruction procedure used by Meichenbaum and Goodman (Reference Meichenbaum and Goodman1971), could improve performance in a category learning task.
In addition, as described above, it would be helpful to study the relation between learning in CLT and performance in specific subjects such as math or science.
Finally, it would be desirable to use a non-abbreviated version of the CLT in order to study more precisely the relation between learning and execution patterns.
On the one hand, and as expected from previous studies, our results concur that category learning improves with age, from 6 to 11 years old. However, we observed that differences in category learning were not only due to age but also to the way children solved the task. Those who were capable of acting slowly and in an organized way attained a higher level of learning than the others did. This was demonstrated by the children in the MLG who showed that decreasing their speed and increasing their organization, resulted in a decrease in their errors and an improvement in their learning. Therefore, self-regulation seems to play an important role when facing this category learning task. This finding is highly relevant taking into account that all the studies so far using objective tasks have only analyzed the role of age in category learning, a variable that we cannot change. Conversely, self-regulation is a factor that we could try to promote in order to improve category learning.
In this study, we have investigated which factors might optimize category learning and which ones might hinder it, and this is especially important because these variables could influence school learning. Although we did not find any relation between academic results and performance in the task, it could be due to the use of the average mark over all the subjects including gymnastic, arts, etc., or to the scarcity of variability in the marks in the school stage studied. Therefore, in future studies we would expect to find a relation between performance in a category learning test and academic marks in children in higher education, and in specific subjects such as math or science.