




In the competitive landscape of contemporary higher education, the capacity to cope with evaluative threat is a critical determinant of student success. While assessment is integral to academic progression, for a substantial minority of students it triggers a debilitating psychological response known as test anxiety. Test anxiety affects an estimated 10–40% of students Reference Von Der Embse, Jester, Roy and Post1 and is characterised by persistent negative thoughts regarding potential failure and its consequences. Reference Cassady and Johnson2 As a multidimensional construct, test anxiety encompasses phenomenological, physiological and behavioural responses. Reference Zeidner3 Phenomenologically, it manifests as intense fear, hopelessness and panic-like symptoms. Reference Zeidner3,Reference Hembree4 Physiologically, it is associated with hyperactivated stress responses and autonomic arousal. Reference Roos, Goetz, Voracek, Krannich, Bieg and Jarrell5 Behaviourally, test anxiety can lead to sleep disturbances, procrastination and impaired concentration during evaluation. Reference Von Der Embse, Jester, Roy and Post1,Reference Hembree4
Test anxiety in the undergraduate population
Undergraduate students represent a distinct population characterised by unique developmental and situational stressors that exacerbate anxiety. Developmentally, many are in the phase of ‘emerging adulthood’, Reference Arnett6 a period marked by instability and identity exploration. Situationally, the modern university environment has shifted towards high-stakes testing, where single examination events often act as ‘gatekeepers’ for future career trajectories and social mobility. Reference Högberg and Horn7,Reference Au8 Unlike primary or secondary students, undergraduates often face these pressures while managing financial independence, part-time employment and a loss of traditional family support structures. Recent epidemiological data reflect this strain: test anxiety is pervasive in university settings, affecting approximately 15–35% of the student population. Reference Driscoll9 More recent evidence suggests these figures may be conservative: a 2025 meta-analysis of 67 studies estimated the pooled prevalence of high test anxiety at approximately 20% (with any-level exam anxiety near 48%), Reference Ansari and Iqbal10 and in a large US college sample, most Test Anxiety Inventory (TAI) symptoms were endorsed at least ‘often’ by roughly one-quarter of students. Reference Lovett, Nelson and O’Meara11
The implications of test anxiety extend far beyond transient distress. Theoretically, high levels of anxiety tax working memory resources, creating a ‘cognitive bottleneck’ that impairs executive functions such as attention shifting and inhibitory control during critical evaluations. Reference Eysenck, Derakshan, Santos and Calvo12 Often, the downstream consequences are severe: elevated anxiety is consistently associated with lower grade point average (GPA) and an increased risk of university dropout. Reference Vasiou and Vasilaki13 Furthermore, academic pressure and chronic test anxiety are highly comorbid with depressive symptoms and are significant predictors of suicidal ideation. Reference Putwain, Jansen in de Wal and van Alphen14 Consequently, the accurate and timely identification of test-anxious students is not merely an administrative task but a critical priority for those concerned with student mental health.
The methodological need for brevity and micro-assessment
The most widely used instrument for operationalising test anxiety is the TAI. Reference Spielberger15 Although the 20-item TAI is the gold standard, intensive longitudinal assessments are increasingly used in mental health research. Protocols such as experience sampling methods (ESM) and ecological momentary assessment (EMA), which track fluctuations in students’ symptoms, affect, cognition and behaviour in real time (e.g. multiple times a day during exam weeks), require instruments that are brief. In such high-frequency contexts, even a ten-item questionnaire introduces significant ‘participant burden’, accelerating survey fatigue and missing data. Reference Li, Ponnada, Wang, Dunton and Intille16 This differs from adaptive approaches that reduce burden algorithmically, selecting items to maximise information gain rather than simply shortening a fixed scale; our aim is complementary, providing fixed brief forms that require no item response model or adaptive engine and can be administered and scored by hand in any setting.
Furthermore, contemporary learning environments are characterised by fragmented attention and frequent task switching, with lower tolerance for sustained and repetitive assessment demands than in previous decades. Reference Deng, Zhou and Broadbent17 To sustain respondent attention in long surveys, researchers need ‘Micro’ forms – ultra-short measures (three–five items) that capture the essence of the construct in seconds. While abbreviated measures of test anxiety exist (e.g. the five-item adaptation of the TAI Reference Taylor and Deane18 ), there remains a lack of a validated, gender-invariant micro form specifically adapted for the contemporary undergraduate population. The TAI-5, in particular, has been validated in some undergraduate samples; Reference Cioffi, Galano, Passeggia and Testa19 our contribution is not another single five-item scale but a graded hierarchy (ten, five and three items) re-derived from contemporary undergraduates, whose item composition and gender invariance we examine directly.
The present study
This study aimed to bridge the gap between psychometric depth and methodological agility by validating a hierarchy of TAI Short Forms (ten, five and three items) for undergraduate students. Unlike previous validation studies that often rely on general community samples, this research focused exclusively on a particularly large sample of undergraduates (N = 1803). We specifically aimed to: (a) identify the most psychometrically potent items in the current educational climate; (b) confirm structural validity across varying lengths; (c) demonstrate that reducing the scales even to a ‘micro’ three-item level does not compromise reliability; and (d) establish strict measurement invariance across genders. Thus, we hypothesised that we would be able to create briefer TAI variants that could serve as reliable tools for both systematic screening (using the ten-item TAI Short Form) and ‘agile’, high-frequency research (using the five-item TAI Ultra-Short Form or the three-item TAI Micro Form). Because the abbreviated forms were both derived and evaluated within the same sample, we additionally assessed the stability of these solutions through internal replication so that the psychometric estimates reported below are not artefacts of a single sample draw.
Method
Participants and procedure
Data were collected as part of the recruitment and screening phase for a comprehensive longitudinal project examining self-states and anxiety among Israeli undergraduates. Participants were recruited via targeted digital advertisements on social media platforms (specifically, Facebook and WhatsApp) tailored to first-year university and college students, ensuring a diverse representation of higher education institutions. A total of 2534 individuals accessed the online screening survey and provided written consent to participate in the study. The study was approved by the institutional research ethics committee (Institutional Review Board (IRB) 2019/25).
The Hebrew-language advertisement invited first-year, native-Hebrew-speaking students aged 18 years or older who owned a smartphone to take part in a study on ‘various experiences and situations in daily life’ and directed interested individuals to a landing page hosted on Qualtrics (Qualtrics XM; Qualtrics, LLC, Provo, Utah, USA; https://www.qualtrics.com), where they provided consent and completed the screening measures. Advertisements were disseminated broadly across Facebook and dedicated WhatsApp groups for first-year students, and the screening survey was presented in a form matched to each respondent’s self-identified gender. Eligibility was self-reported at sign-up: respondents who identified as non-students or who were under 18 years of age were excluded. Because enrolment was open and self-selected rather than drawn from a closed roster, the sample is not a random or probability sample of Israeli undergraduates, and the size of the eligible target population cannot be determined; we regard this non-random, self-selected recruitment as a limitation (see Limitations).
Of the 2534 individuals who initiated the survey, 1958 completed it and 1862 met the consent and inclusion criteria. Entries from non-students, individuals under 18 years of age or those with incomplete responses were systematically excluded, leaving 1811 cases with complete TAI data. Duplicate entries were then identified by cross-referencing email addresses, with the most recent entry retained to capture the participant’s current psychological state, yielding 1804 unique respondents. After removing 1 administrative test entry, the final analytic sample consisted of 1803 undergraduates.
This sample size provides exceptional statistical power for psychometric validation. With a participant-to-item ratio of approximately 90:1 for the full 20-item scale, the sample far exceeds standard recommendations for stable factor solutions (e.g. the 20:1 ratio suggested by Costello and Osborne Reference Costello and Osborne20 ). This minimises standard errors and ensures that factor loadings and invariance testing results are robust and not artefacts of sampling error.
Demographically, the sample was predominantly female (72.1%, n = 1300) compared with male (27.5%, n = 496), with 7 participants opted not to report their gender. This gender distribution mirrors enrolment trends in social science and humanities faculties, 21,22 where test anxiety research is frequently conducted.
Measures
Test anxiety was assessed using the Hebrew version of the Spielberger TAI. Reference Spielberger15 This instrument consists of 20 items measuring the affective and cognitive symptoms of test anxiety. Respondents rate the frequency of specific experiences (e.g. ‘I feel confident and relaxed while taking tests’ (reverse coded), ‘I freeze up on important exams’) on a four-point Likert scale ranging from 1 (Almost never) to 4 (Almost always). A higher total score indicates greater levels of test anxiety.
Statistical analysis
Psychometric validation was conducted using R version 4.2.2 for Windows (R Foundation for Statistical Computing, Vienna, Austria; https://www.r-project.org/). Exploratory factor analysis (EFA) and reliability analyses were performed using the R-package psych (version 2.2.9; W. Revelle, Northwestern University, Evanston, Illinois, USA; https://CRAN.R-project.org/package=psych), and confirmatory factor analysis and measurement invariance testing were conducted using the R-package lavaan (version 0.6-15; Y. Rosseel, Ghent University, Ghent, Belgium; https://CRAN.R-project.org/package=lavaan). Reference Rosseel23
The analytic strategy proceeded in several phases. First, EFA with minimum residual extraction was conducted on the full 20-item scale to examine factor structure and identify items with the strongest factor loadings. Based on the EFA results, three shortened versions were created by selecting the items with the highest factor loadings: a ten-item TAI Short Form, a five-item TAI Ultra-Short Form and a three-item TAI Micro Form.
For each version, internal consistency reliability was assessed using Cronbach’s α and McDonald’s omega (ω), alongside the Pearson correlation between the short and full forms to assess information retention. Confirmatory factor analysis was conducted to evaluate model fit using standard fit indices: chi-square (χ2), comparative fit index (CFI), Tucker–Lewis Index (TLI), root mean square error of approximation (RMSEA) and standardised root mean square residual (SRMR). Following conventional guidelines, good model fit was indicated by CFI and TLI values ≥ 0.95, RMSEA ≤ 0.06 and SRMR ≤ 0.08. Reference Hu and Bentler24
To verify that the abbreviated TAI versions function equivalently across genders, we tested for configural (equal structure), metric (equal loadings) and scalar (equal intercepts) invariance. Invariance was considered supported if the change in CFI (ΔCFI) between nested models was less than 0.01. Reference Cheung and Rensvold25 Gender differences were examined using independent samples t-tests, with Cohen’s d calculated as the standardised effect size.
Because the abbreviated forms were derived and evaluated within the same sample, three additional sets of analyses were conducted for the present submission to guard against capitalisation on chance. First, to assess the stability of the data-driven item selection procedure, the EFA-based selection was repeated across 1000 bootstrap resamples, recording how often each item was re-selected into its form. Bootstrap confidence intervals (2000 resamples) were also computed for the reliability coefficients, the cross-form correlations and the gender effect sizes. Second, the forms were cross-validated using a gender-stratified split-half procedure: items were selected by EFA in a calibration half (n = 901), and the resulting models were then fit, unchanged, to the held-out validation half (n = 902). Third, power analyses were conducted for the gender analyses, comprising a sensitivity analysis for the t-tests, a Monte Carlo analysis of the power to detect loading non-invariance and a close-fit (RMSEA-based) power analysis for the confirmatory models.
Results
Development of the TAI short, ultra-short and micro forms
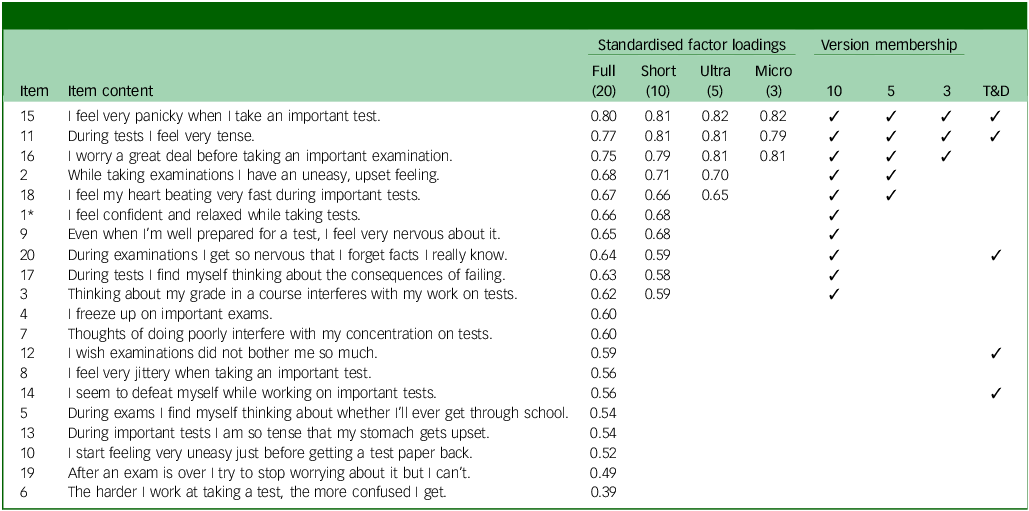
The EFA conducted on the full 20-item scale supported a unidimensional factor structure, consistent with the theoretical framework of the original instrument. All items loaded substantially on a single factor, with loadings ranging from 0.39 to 0.80 (M = 0.61). Table 1 presents the factor loadings for the selected ten items, ordered by loading magnitude.
Standardised factor loadings and version membership for all TAI items

Table 1 Long description
A table showing standardized factor loadings and version membership for test anxiety inventory items. The table has 20 rows and 6 columns. The columns are labeled Item, Item content, Standardised factor loadings (with sub-columns Full (20), Short (10), Ultra (5), Micro (3)), and Version membership (with sub-columns 10, 5, 3, T&D). The rows list items with their content and corresponding factor loadings for different versions. Row 1: Item 15, I feel very panicky when I take an important test., Full 0.80, Short 0.81, Ultra 0.82, Micro 0.82, Version membership 10, 5, 3, T&D. Row 2: Item 11, During tests I feel very tense., Full 0.77, Short 0.81, Ultra 0.81, Micro 0.79, Version membership 10, 5, 3, T&D. Row 3: Item 16, I worry a great deal before taking an important examination., Full 0.75, Short 0.79, Ultra 0.81, Micro 0.81, Version membership 10, 5, 3. Row 4: Item 2, While taking examinations I have an uneasy, upset feeling., Full 0.68, Short 0.71, Ultra 0.70, Version membership 10, 5. Row 5: Item 18, I feel my heart beating very fast during important tests., Full 0.67, Short 0.66, Ultra 0.65, Version membership 10, 5. Row 6: Item 1, I feel confident and relaxed while taking tests., Full 0.66, Short 0.68, Version membership 10. Row 7: Item 9, Even when I’m well prepared for a test, I feel very nervous about it., Full 0.65, Short 0.68, Version membership 10. Row 8: Item 20, During examinations I get so nervous that I forget facts I really know., Full 0.64, Short 0.59, Version membership 10, T&D. Row 9: Item 17, During tests I find myself thinking about the consequences of failing., Full 0.63, Short 0.58, Version membership 10. Row 10: Item 3, Thinking about my grade in a course interferes with my work on tests., Full 0.62, Short 0.59, Version membership 10. Row 11: Item 4, I freeze up on important exams., Full 0.60. Row 12: Item 7, Thoughts of doing poorly interfere with my concentration on tests., Full 0.60. Row 13: Item 12, I wish examinations did not bother me so much., Full 0.59, T&D. Row 14: Item 8, I feel very jittery when taking an important test., Full 0.56. Row 15: Item 14, I seem to defeat myself while working on important tests., Full 0.56, T&D. Row 16: Item 5, During exams I find myself thinking about whether I’ll ever get through school., Full 0.54. Row 17: Item 13, During important tests I am so tense that my stomach gets upset., Full 0.54. Row 18: Item 10, I start feeling very uneasy just before getting a test paper back., Full 0.52. Row 19: Item 19, After an exam is over I try to stop worrying about it but I can’t., Full 0.49. Row 20: Item 6, The harder I work at taking a test, the more confused I get., Full 0.39.
N = 1803. Items are ordered by magnitude of factor loading. Item 1 is reverse-coded. T&D, Taylor and Deane; TAI, Test Anxiety Inventory. Reference Taylor and Deane18
Based on these results, we used a data-driven reduction strategy that ensured the retention of the most psychometrically informative indicators to create three shortened versions. The 10-item TAI Short Form included items with standardised loadings ≥ 0.58 (Items 11, 15, 16, 2, 1, 9, 18, 3, 20 and 17, in that order). The 5-item TAI Ultra-Short Form included items with standardised loadings ≥ 0.65 (Items 15, 11, 16, 2 and 18). The 3-item TAI Micro Form included the 3 highest-loading items, with standardised loadings ≥ 0.79 (Items 15, 11 and 16). These high loadings indicate that the selected items possess strong discriminatory power with respect to the latent construct of test anxiety among undergraduates.
Reliability
To evaluate whether the reduction in scale length compromised measurement precision, the psychometric properties of the full 20-item scale and the shortened versions were compared. Reliability remained strong across shortened versions: the ten-item TAI Short Form (α = 0.90, ω = 0.90), the five-item TAI Ultra-Short Form (α = 0.87, ω = 0.87) and the three-item TAI Micro Form (α = 0.85, ω = 0.85), exceeding standard cut-offs for both clinical and research application. Bootstrap confidence intervals around these coefficients were narrow (e.g. 95% CI (0.84, 0.86) for the TAI Micro Form’s alpha), indicating that the reliability of even the shortest form was stable across resamples.
Confirmatory factor analysis (CFA)
The structural validity of the ten-item and five-item unidimensional models was examined via CFA. For the ten-item TAI Short Form, fit indices indicated a good model fit (χ2 (35) = 367.06, CFI = 0.96, TLI = 0.95, RMSEA = 0.07, SRMR = 0.04). The five-item TAI Ultra-Short Form demonstrated excellent fit (χ2 (5) = 24.87, CFI = 0.995, TLI = 0.99, RMSEA = 0.05, SRMR = 0.01). Note that the three-item Micro Form is just-identified (df = 0), precluding meaningful evaluation of goodness-of-fit indices using CFA. Consequently, the evaluation of this form focused on the standardised factor loadings, all of which were strong: 0.82 (Item 15), 0.81 (Item 16) and 0.79 (Item 11).
Measurement invariance across gender
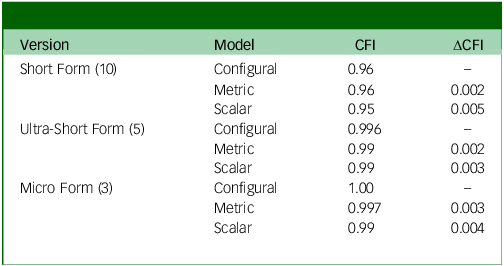
To ensure that the instrument assesses the same construct across genders, measurement invariance was tested between male (n = 496) and female (n = 1300) students. Table 2 presents these results for each scale version.
Measurement invariance tests across gender

Table 2 Long description
A table comparing measurement invariance across different scale versions and models. The table has three rows and four columns. The columns are labeled Version, Model, CFI, and ΔCFI. The rows are grouped by Version: Short Form (10), Ultra-Short Form (5), and Micro Form (3). Each version has three models: Configural, Metric, and Scalar. The CFI values and ΔCFI values are provided for each model. Row 1: Short Form (10), Configural, 0.96, -. Row 2: Short Form (10), Metric, 0.96, 0.002. Row 3: Short Form (10), Scalar, 0.95, 0.005. Row 4: Ultra-Short Form (5), Configural, 0.996, -. Row 5: Ultra-Short Form (5), Metric, 0.99, 0.002. Row 6: Ultra-Short Form (5), Scalar, 0.99, 0.003. Row 7: Micro Form (3), Configural, 1.00, -. Row 8: Micro Form (3), Metric, 0.997, 0.003. Row 9: Micro Form (3), Scalar, 0.99, 0.004.
ΔCFI < 0.010 supports invariance at each level. CFI, comparative fit index; ΔCFI, change in comparative fit index.
Following the conventional stepwise approach, configural invariance was first established before sequentially constraining factor loadings and intercepts. For the ten-item TAI Short Form, configural invariance was high (CFI = 0.96). The addition of equality constraints on factor loadings (metric invariance) resulted in minimal change (ΔCFI = 0.002), and further constraining intercepts (scalar invariance) also showed negligible change (ΔCFI = 0.005). Similar patterns emerged for the five-item TAI Ultra-Short Form (configural CFI = 0.996; metric ΔCFI = 0.002; scalar ΔCFI = 0.003) and the three-item TAI Micro Form (configural CFI = 1.00; metric ΔCFI = 0.003; scalar ΔCFI = 0.004). All ΔCFI values were well below the 0.010 threshold recommended by Cheung and Rensvold, Reference Cheung and Rensvold25 indicating that the increasingly restrictive models did not significantly worsen fit. Thus, scalar invariance was confirmed for all three versions. We note, however, that the change-in-CFI criterion is a conservative test in short scales; its sensitivity to genuine non-invariance under these conditions is examined directly in the power analysis reported below.
Group differences
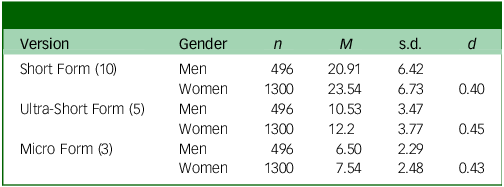
Having established scalar invariance, mean differences between men and women could be examined and, if found, interpreted as reflecting true differences in the latent construct of test anxiety rather than measurement artefacts or differential item functioning. Table 3 presents descriptive statistics by gender for each scale version.
Descriptive statistics by gender

Table 3 Long description
A table comparing descriptive statistics by gender for different scale versions. The table has 3 rows and 6 columns. Column headers are Version, Gender, n, M, SD, and d. Row labels are Short Form (10), Ultra-Short Form (5), and Micro Form (3). Row 1: Short Form (10), Men, 496, 20.91, 6.42, 0.40. Row 2: Short Form (10), Women, 1300, 23.54, 6.73, 0.40. Row 3: Ultra-Short Form (5), Men, 496, 10.53, 3.47, 0.45. Row 4: Ultra-Short Form (5), Women, 1300, 12.2, 3.77, 0.45. Row 5: Micro Form (3), Men, 496, 6.50, 2.29, 0.43. Row 6: Micro Form (3), Women, 1300, 7.54, 2.48, 0.43.
N = 1803. Men n = 496, women n = 1300. All gender differences were significant at p < 0.001 (Welch t-test); d = pooled Cohen’s d, with bootstrap 95% CIs where reported.
Women reported significantly higher test anxiety than men across all versions. For the ten-item TAI Short Form, women (M = 23.54, s.d. = 6.73) scored higher than men (M = 20.91, s.d. = 6.42), t(933.5) = 7.67, p < 0.001, d = 0.40. Similar effect sizes were observed for the five-item TAI Ultra-Short Form (d = 0.45) and the three-item TAI Micro Form (d = 0.43). These effect sizes fall within the small-to-medium range according to conventional benchmarks.
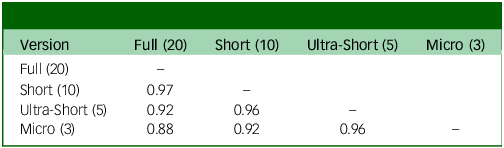
Convergent validity: correlations between versions
Table 4 presents correlations among the scale versions, providing evidence of convergent validity and supporting the use of the shortened forms as proxies for the full scale. The 10-item TAI Short Form correlated 0.97 with the full 20-item scale, indicating that it captures 93.5% of the variance in the original measure. The five-item TAI Ultra-Short Form correlated 0.92 with the full scale (83.9% shared variance), and the three-item TAI Micro Form correlated 0.88 with the full scale (78.1% shared variance). The shortened versions also showed strong intercorrelations, with the TAI Ultra-Short Form and TAI Micro Form correlating 0.96 with each other.
Correlations between scale versions

Table 4 Long description
A table with four rows and four columns comparing correlations between different scale versions. The columns are labeled Full (20), Short (10), Ultra-Short (5), and Micro (20). The row labels are Full (20), Short (10), Ultra-Short (5), and Micro (3). Row 1: Full (20), empty cell, empty cell, empty cell. Row 2: Short (10), 0.97, empty cell, empty cell. Row 3: Ultra-Short (5), 0.92, 0.96, empty cell. Row 4: Micro (3), 0.88, 0.92, 0.96.
All correlations significant at p < 0.001.
Internal replication
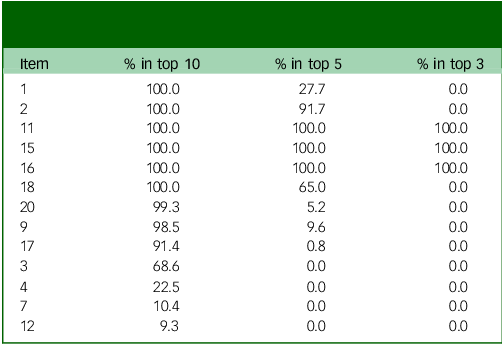
Because item selection was data-driven within the analytic sample, we examined how reliably the same items would be selected across 1000 bootstrap resamples (see Table 5). The 3 TAI Micro Form items (15, 11 and 16) were re-selected into the top 3 in 100% of resamples, and the core items of the longer forms were comparably stable, with Items 15, 11, 16, 1 and 2 entering the top 10 in every resample. Selection was less determinate only at the margins of the longer forms, where similarly loaded items compete for inclusion: Item 18 entered the top 5 in 65.0% of resamples and Item 3 entered the top 10 in 68.6%, identifying these as the swing items at the boundaries of the TAI Ultra-Short Form and TAI Short Form, respectively. Consistent with this pattern, the exact three-item set recurred in 100% of resamples, whereas the exact five-item and ten-item sets recurred in 57.7 and 58.8% of resamples. The lower recurrence reflects interchange among the lowest-ranked, near-tied items rather than instability in the core.
Bootstrap stability of data-driven item selection (1000 resamples)

Table 5 Long description
A table showing the percentage of items in top 10, top 5, and top 3 across resamples. The table has 12 rows and 3 columns. The columns are labeled ‘% in top 10’, ‘% in top 5’, and ‘% in top 3’. The rows are labeled with item numbers. Row 1: Item 1, 100.0, 27.7, 0.0. Row 2: Item 2, 100.0, 91.7, 0.0. Row 3: Item 11, 100.0, 100.0, 100.0. Row 4: Item 15, 100.0, 100.0, 100.0. Row 5: Item 16, 100.0, 100.0, 100.0. Row 6: Item 18, 100.0, 65.0, 0.0. Row 7: Item 20, 99.3, 5.2, 0.0. Row 8: Item 9, 98.5, 9.6, 0.0. Row 9: Item 17, 91.4, 0.8, 0.0. Row 10: Item 3, 68.6, 0.0, 0.0. Row 11: Item 4, 22.5, 0.0, 0.0. Row 12: Item 7, 10.4, 0.0, 0.0. Row 13: Item 12, 9.3, 0.0, 0.0.
Values are the percentage of 1000 bootstrap resamples in which each item was re-selected into its form.
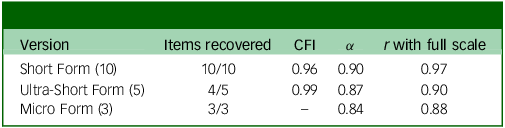
To verify that the forms generalise beyond the cases used to construct them, we conducted a gender-stratified split-half cross-validation (calibration n = 901, validation n = 902; see Table 6). EFA-based item selection in the calibration half recovered the full-sample selection for the TAI Short Form (ten of ten items) and the TAI Micro Form (three of three items), and four of the five TAI Ultra-Short Form items, the single disagreement falling on the swing item identified above. Refitting these models, unchanged, to the held-out validation half preserved their performance: the ten-item TAI Short Form fit at CFI = 0.96 and the five-item TAI Ultra-Short Form at CFI = 0.99. Out-of-sample reliability was likewise maintained (TAI Short Form α = 0.90; TAI Ultra-Short Form α = 0.87; TAI Micro Form α = 0.84), as were the correlations with the full scale (0.97, 0.90 and 0.88, respectively). These results indicate that the forms hold up in an independent subset of the data, although confirmation in a wholly separate sample remains a priority for replication.
Split-half cross-validation

Table 6 Long description
A table comparing the performance of different forms of a scale across various metrics. The table has four rows and four columns. The columns are labeled Version, Items recovered, CFI, α, and r with full scale. The rows are labeled Short Form (10), Ultra-Short Form (5), and Micro Form (3). Row 1: Short Form (10), 10/10, 0.96, 0.90, 0.97. Row 2: Ultra-Short Form (5), 4/5, 0.99, 0.87, 0.90. Row 3: Micro Form (3), 3/3, -, 0.84, 0.88.
Items were selected by EFA in the calibration half and confirmed, unchanged, in the validation half. CFI, comparative fit index; EFA, exploratory factor analysis.
Sensitivity and power analyses
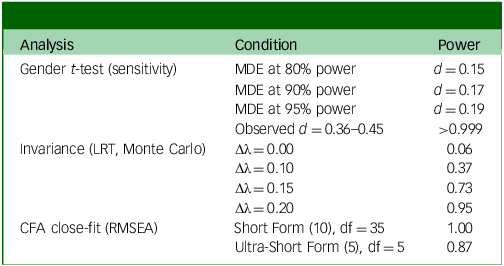
Because limited power can both inflate and obscure group differences, we examined the power of the gender analyses (see Table 7). For the t-tests, with 496 men and 1300 women, the minimum detectable effect (MDE) was d = 0.15 at 80% power, and the observed effects (d = 0.36 to 0.45) were detected with power exceeding 0.999. The observed gender differences therefore do not reflect an underpowered design.
Statistical power for the gender analyses

Table 7 Long description
A table showing statistical power for gender analyses. The table has three columns: Analysis, Condition, and Power. It contains data for gender t-test sensitivity, invariance, and CFA close-fit. For gender t-test sensitivity, the conditions are MDE at 80 percent power with d equals 0.15, MDE at 90 percent power with d equals 0.17, MDE at 95 percent power with d equals 0.19, and observed d equals 0.36 to 0.45 with power greater than 0.999. For invariance, the conditions are delta lambda equals 0.00 with power 0.06, delta lambda equals 0.10 with power 0.37, delta lambda equals 0.15 with power 0.73, and delta lambda equals 0.20 with power 0.95. For CFA close-fit, the conditions are Short Form with 10 degrees of freedom and power 1.00, and Ultra-Short Form with 5 degrees of freedom and power 0.87.
CFA, confirmatory factor analysis; LRT, likelihood-ratio test; MDE, minimum detectable effect; RMSEA, root mean square error of approximation.
Power to detect non-invariance required separate consideration. A Monte Carlo analysis (400 replications per scenario, introducing loading differences on the weakest TAI Ultra-Short Form indicator) showed that the change-in-CFI criterion had essentially no power to detect non-invariance in scales this short, returning near-zero detection even when a loading differed by 0.20. The likelihood ratio test was considerably more sensitive, detecting a loading difference of 0.10 with 37% power, 0.15 with 73% power and 0.20 with 95% power, while maintaining a false-positive rate near the nominal level (6.2% under true invariance). The power argument for the invariance conclusions therefore rests on the likelihood ratio test; the change-in-CFI values are retained in the invariance analysis above because they remain the field-standard reporting criterion. For the confirmatory models, close-fit power to reject poor fit (RMSEA = 0.08 against a null value of 0.05) was 1.00 for the ten-item model and 0.87 for the five-item model.
Discussion
The primary objective of this study was to develop and validate a hierarchy of psychometrically sound TAI Short Forms (TAI Short Form, TAI Ultra-Short Form and TAI Micro Form). The results provide robust evidence that these abbreviated forms are parsimonious, reliable and internally validated and cross-validated alternatives to the full 20-item scale. These tools address the contemporary needs of educational psychology, including repeated semester-level assessments and brief screening.
A distinguishing feature of this validation effort is the statistical power afforded by the large sample size. Our high participant-to-item ratio provides high confidence in the stability of the solution. The structural validity of all versions also yielded fit indices that meet stringent psychometric standards. This demonstrates that brevity need not come at the cost of precision; even the three-item TAI Micro Form maintained excellent internal consistency, closely matching the reliability of the full scale. This supports the utility of the TAI Micro Form for burst designs and brief repeated assessments, such as daily diaries spanning an examination period, although direct examination of the TAI Micro Form within EMA designs remains a needed next step.
Beyond model fit, the robustness analyses introduced to address the same-sample derivation lend further confidence to these conclusions. The bootstrap analysis showed that the core item selection, and the TAI Micro Form in particular, was highly stable across resamples, while the split-half cross-validation confirmed that the forms retained their fit, reliability and convergence with the full scale in a held-out subsample. The power analyses, in turn, indicated that the gender comparisons were very well powered and that the supporting invariance test could have detected meaningful loading differences had they been present. These analyses do not substitute for external validation, but they do address the most immediate threat to a same-sample design, namely that the solutions might reflect sample-specific noise rather than replicable structure.
Construct drift: the shift from worry to acute distress
A noteworthy feature of the current results involves the specific item composition of the new short forms compared with Taylor and Deane’s Reference Taylor and Deane18 commonly used five-item version. Only 3 of Taylor and Deane’s 5 items (Items 11, 15 and 20) appear in our TAI Short Form, and of these, only 2 (Items 11 and 15) also appear in our TAI Ultra-Short Form and TAI Micro Form. This divergence may not be merely technical; instead, it may reflect a shift in how test anxiety presents among today’s students. Specifically, whereas the Taylor and Deane Reference Taylor and Deane18 version retained Spielberger’s original intention of balancing ‘worry’ and ‘emotionality’ items, our data-driven selection identified items reflecting the acute somatic aspects of anxiety – feeling panicky and tense during tests, having an uneasy, upset feeling or one’s heart beating fast – as those most strongly associated with overall test anxiety.
This finding suggests a potential ‘construct drift’, as the world of higher education has changed dramatically over the past 25 years. Today’s students, often referred to as iGen or Generation Z, report significantly higher baseline levels of anxiety and neuroticism. Reference Twenge26 In the current high-stakes academic environment, where examinations are often viewed as ‘gatekeepers’ to social mobility and economic stability, the experience of test anxiety may have evolved from cognitive concern (e.g. worrying about grades) to a more visceral survival threat. Our results indicate that, for the contemporary undergraduate, test anxiety is less about thinking about failure and more about feeling a sense of terror and physical panic. Clinically, this somatic dominance, that is, the finding that the physical experience of anxiety was the most salient and debilitating feature reported by anxious students, suggests that interventions focusing mainly on cognitive restructuring (e.g. challenging negative thoughts) may be insufficient; today’s students may require more bottom-up regulatory strategies (e.g. imagery rescripting Reference Prinz, Bar-Kalifa, Rafaeli, Sened and Lutz27 ) to address acute somatic distress. As this interpretation rests on a cross-sectional item pattern, distinguishing a genuine construct shift from a feature of the present sample will require further comparison with external measures of closely related constructs such as panic, generalised anxiety and stress.
Gender invariance and the ‘gender gap’
An additional contribution of this study was the establishment of strict scalar invariance across genders. Although the literature consistently reports that female students experience higher test anxiety than male students, Reference Von Der Embse, Jester, Roy and Post1,Reference Zeidner3 previous research has often failed to rule out measurement bias as a confounding factor. Our findings confirmed that all versions of the TAI function equivalently for men and women. Consequently, the observed medium effect size can be confidently interpreted as a true disparity in the psychological experience of test anxiety.
Limitations and future directions
The findings should be interpreted in light of several limitations. The present evidence concerns the internal and structural properties of the forms; external and clinical validation against gold-standard criteria and independent replication in new samples remain necessary before the forms can be regarded as fully validated for applied use. First, the sample consisted exclusively of Israeli undergraduates; future research should examine cross-cultural stability. Second, this study focused on internal structure; future efforts should incorporate external criteria, such as physiological markers of stress (e.g. cortisol). Although the abbreviated forms correlate strongly with the full TAI, these within-instrument correlations cannot substitute for convergent validity against external measures of test anxiety, general anxiety or academic outcomes; future studies should address this directly. Finally, given the strong somatic focus of the new short forms, researchers should consider whether these ‘micro’ versions are capturing a generalised panic response triggered by examinations rather than the specific cognitive deficits associated with traditional test anxiety models. EFA and CFA were also conducted on the same sample, which can inflate model fit; cross-validation in an independent sample is a priority for replication. Relatedly, we developed fixed short forms rather than adaptive, model-based item selection (e.g. information-gain methods); because such approaches can retain more information for a given length, benchmarking our fixed forms against them is a valuable direction for future work.
Towards agile assessment of test anxiety
The ten-item, five-item and three-item forms developed in this study represent internally validated, gender-invariant tools and a promising first step towards fully validated brief screening measures that effectively bridge the gap between psychometric rigour and methodological efficiency. Their psychometric continuity with the full scale supports their use in burst and brief screening designs, pending external convergent validation. We hope that these robust brief indices will prove useful in both routine monitoring and clinical interventions requiring repeated assessment of test anxiety while imposing as little burden as possible on already stressed respondents. From a theoretical perspective, the shift in item content towards somatic and acute distress raises questions for both educators and clinicians that warrant further investigation in future research.
Data availability
The data supporting the findings of this study are available on reasonable request from the corresponding author, M.B. The data are not publicly available because they contain information that could compromise the privacy of the research participants.
Author contributions
E. Refoua contributed to conceptualisation, methodology and formal analysis. M.B. contributed to conceptualisation, writing the original draft and reviewing and editing the manuscript. H.F. contributed to reviewing and editing the manuscript. S.W. contributed to data curation. S.R. contributed to data curation. E. Rafaeli contributed to supervision, funding acquisition and reviewing and editing the manuscript. All authors contributed to and approved the final version of the manuscript.
Funding
This work was supported by the Israel Science Foundation (grant number 1501/19 to E. Rafafaeli).
Declaration of interest
None.

 Open access


eLetters
No eLetters have been published for this article.