Principal photography on Gone with the Wind began on 26 January 1939. Though studio executives at MGM were “far frombeing sold on color as an economic proposition,” producer David O. Selznick convinced them to shoot the Civil War epic using Technicolor'spatented three-strip color film process (Behlmer Reference Behlmer2000, p. 185). Selznick's gamble paid off. The movie premiered on 15 December 1939 and would eventually amass box office revenues of $176.7 million based on a production budget of only $4.2 million (Block and Wilson Reference Block and Wilson2010, p. 220). It also earned art director William Menzies an Academy Honorary Award for outstanding achievement in the use of color. Despite the film's success, Hollywood's conversion to color film progressed slowly and would not pass 90 percent until 1969 (Figure 1). Between 1954 and 1957, the proportion of color movies even fell by 27.1 percent after surging by 37.6 percent between 1950 and 1954. By comparison, Hollywood's conversion to sound was smooth and swift. In 1927, few films included sound;by the end of 1929 the major studios ceased production of silent films (Salt Reference Salt1992, p. 179).
Share of Color Movies and Households with TV, 1940–70

We analyze this puzzling pattern of adoption using data on 7,022 feature-length motion pictures produced between 1940 and 1959. We complement these data with detailed financial data on revenues and production costs for 1,138 movies distributed by two of the largest studios, MGM and Warner Bros.
The post-war motion picture industry provides a unique setting for studying technology adoption as the industry witnessed significant changes to market structure brought about by federal antitrust action. These quasi-exogenous changes allow us to identify potential drivers of slow diffusion rates. In 1948, the Supreme Court ruled that the largest studios end the practice of bundling their pictures, which foreclosed entry by smaller studios.Footnote 1 The Court also mandated that the five majors (MGM, Paramount, RKO, 20th Century-Fox, and Warner Bros.) be separated from theirtheater holdings. In 1950, Eastman Kodak introduced Eastman Color, a low-cost substitute for Technicolor's expensive three-strip process, which dramatically reduced the cost of filming in color. The substitute technology was announced shortly after Eastman and Technicolor entered into consent decrees in 1948 and 1950 to settle allegations that the two companies had conspired to monopolize the market for color cinematography.Footnote 2
Consistent with standard models of technological adoption that emphasize differences across potential adopters, we identify two important sources of heterogeneity that impeded Hollywood's rapid conversion to color. First, smaller studios were not able to widely distribute their films, and this limited their ability to recoup the significantly larger fixed costs associated with shooting a color feature. Difference-in-differences estimates indicate that the resolution of the Paramount case in 1948, which ended block-booking and granted smaller studios access to larger theaters, increased the likelihood of the minor producers (Columbia and Universal) shooting in color by 9.0 percent.
Hollywood's conversion to color was also impeded by the popularity of genres that were not enhanced by color. Adventures and musicals were enhanced by color's association with fantasy. However, comedies and dramas, which comprised almost two-thirds of the major studios'output between 1940 and 1959, benefited more from black-and-white's association with realism(Kindem Reference Kindem1979, p. 35). Immediately prior to the introduction of an improved Eastman film stock in 1952, 84.8 percent of adventures, musicals, and westerns produced by the majors were filmed in color. By comparison, only 22.7 percent of comedies, dramas, and mysteries produced by the majors were filmed in color. Between 1952 and 1954, the availability of the cheaper Eastman stock induced the majors to increase the share of comedies, dramas, and mysteries filmed in color to 73.1 percent.
However, financial data from MGM and Warner Bros. indicate that weak returns for this wave of color comedies and dramas precipitated a period of disadoption. Between 1954 and 1955, the premium from filming in color (difference between the average return on color and black-and-white movies) plunged from 22.4 percent to −77.9 percent. Over the next two years, the share of color movies declined by 24.9 percent, and the decline was largest for comedies and dramas. More generally, these data demonstrate that past returns to color and black-and-white films were an important determinant of studio production decisions. Probit estimates indicate that a 10percent rise in the difference between the average return to color and black-and-white movies one year prior to production increased the likelihood of color by 0.5 percent, while a 10 percent rise two years prior top roduction increased the likelihood by 0.9 percent.
Our analysis extends the literature on technological diffusion in two ways. First, we analyze the diffusion of an innovation that is incorporated into downstream products, and changes their composition. Many new technologies share this feature. For example, Global Positioning System (GPS) and touch-screen technologies are incorporated into a variety of downstream products including cellular telephones, tablet computers, and cars, and increase the value of these devices. In standard models of technological diffusion, however, the new technology is a process innovation that does not affect the characteristics of a firm's output. Forexample, the mechanical reaper studied by Paul David (Reference David and Rosovsky1966, Reference David and McCloskey1971) and Alan Olmstead (Reference Olmstead1975, Reference Olmstead1979) did not appreciably alter the nature of a farm's grain even though it affected the quantity of grain harvested.
We also analyze the potential for technological disadoption. In standard models, the adoption of a new technology involves a large capital outlay, and low resale values on equipment can deter firms from disadopting the technology even when realized returns fall below expected returns(Davies Reference Davies1979, pp. 179–80). In our setting, however, the adoption of color for a particular movie project did not involve large capital outlays that extended past the lifetime of the project. Therefore, disadoption was possible if the predicted returns from shooting a movie in color fell below the predicted returns from shooting the same movie in black-and-white.
BACKGROUND, 1940–1970
Technicolor and Eastman Color
During the 1930s and 1940s, the Technicolor Motion Picture Corporation maintained an effective monopoly over high-quality color cinematography.Footnote 3 Their three-color process used special cameras that captured red, green, and blue light on three separate black-and-white negatives. Each of these negatives was then combined on a single three-color release print (Cook Reference Cook1996, p. 257). The three-strip process gained prestige in 1939 with therelease of such films as The Wizard of Oz and Gone with the Wind.
Shooting in Technicolor was expensive for filmmakers because the company controlled every stage of the color process. Rather than sell its cameras, it would rent them as part of a package that included specialized cameramen and lighting, a color supervisor, and laboratory processing and printing (Basten Reference Basten2005, p. 55). In 1935, shooting in Technicolor increased production costs by 30 percent based on average production costs of $300,000 per feature; in 1949 Technicolor increased production costs by 10 percent based on average production costs of $1,000,000(Kindem Reference Kindem1979, p. 34).
On 21 December 1951, the National Film Board of Canada released Royal Journey, a documentary that became one of the first professional films to use Eastman Color, a new, low-cost color film introduced by the Eastman Kodak Company.Footnote 4 The advent of Eastman Color, announced the previous year, ended Technicolor's 20-year monopoly of the market for color cinematography based on its costly three-strip process. The new color film was first announced two years after Eastman Kodak entered into a consent decree with the Department of Justice in 1948 to settle allegations that it had entered into collusive agreements with Technicolor in the 1930s that stifled the development of an effective substitute for the latter's three-strip process.Footnote 5
Eastman Color combined the three strips of color sensitive film required for the production of color images onto a single “monopack” roll. The simplicity of the single roll meant that color movies could be shot on ordinary black-and-white cameras and processed by conventional processing facilities (Neale Reference Neale1985, p. 142). In 1952, Eastman Kodak introduced an improved monopack technology (type 5248) with higher emulsion speed and better grain structure that allowed the technology to be adopted by major Hollywood studios.Footnote 6 In 1954, Technicolor responded by cutting rental charges for its three-strip camerasby 50 percent to $120 per week and $20 per day. It also reduced the priceof color release prints from 6.4 to 4.3 cents per foot (Daily Variety, 3 February 1954, p. 3). Despite these price cuts, Foxfire(1955), filmed in 1954 by Universal, became the last American-made feature to be photographed with a Technicolor three-strip camera (Basten Reference Basten2005, p. 129).
Resolution of United States v. Paramount Pictures
Prior to 1948 the five major studios owned theaters in addition to production facilities and distribution arms. Three minor studios were not fully integrated: Columbia and Universal produced and distributed their own movies, while United Artists only distributed movies. In July 1938, the U.S. Department of Justice filed a lawsuit against these studios calling for the separation of theater holdings, as well as an end to block-booking that “compelled an exhibitor to buy sight unseen a whole line of mediocre and poor films along with the few features in which he is interested” (Katz Reference Katz2008, p. 148).
After ten years of litigation and a number of appeals, on 4 May 1948 the Supreme Court ruled that the five majors and three minors end the use of block-booking contracts in movie distribution and exhibition.Footnote 7 The use of bundling was thought to be anticompetitive as it foreclosed market entry by smaller independent studios and softened competition faced by big studios. The Supreme Court remanded the case to the District Court to reconsider whether the five majors should be separated from their theatrical branches and sell 25 to 50 percent of their theater holdings The majors would eventually sign consent decrees to divorce their theater holdings and settle the case. The first studio to sign a decree was RKO in 1948, followed by Paramount in 1949, Fox and Warner Bros. in 1951, and finally MGM in 1952. The actual spinoff between the parent studios and their theater branches came shortly after: Paramount in 1949, RKO in 1950, Fox and Warner Bros. in 1953, and MGM in 1954 (Gil Reference Gil2014; Block and Wilson Reference Block and Wilson2010, p. 251).
Shooting in Color Was More Expensive
Despite the availability of cheaper Eastman film stock, shooting in color remained expensive. Production costs were higher because of technical difficulties related to lighting. For exteriors, variation in natural light at different hours of the day created problems during editing since shots taken at different times would not “match.” This limited the number of hours in the day for consistent photography (Katz Reference Katz2008, p. 291). For interiors, shooting in color required very high light levels compared to black-and-white film (Lev 2006, p. 109).Footnote 8 During the 1950s and 1960s, Eastman Kodak introduced faster Eastman Color film stocks, which dramatically lowered these lighting costs. The new film stocks “had a sensitivity to light which was nearly equivalent to black-and-white”(Kindem Reference Kindem1979, p. 31). The new Eastman Color in 1959, for example, “photographed more clearly scenes with dim or drab illumination” and required “as little as half the light previously required” (Limbacher Reference Limbacher1968, p. 67; Weekly Variety, 13 May 1959, p. 17).Footnote 9
Distribution costs were also larger because processing color film stock was more than twice as expensive as black-and-white stock. For example, in 1949 the cost of color release prints was seven cents per foot compared to three cents per foot for black-and-white prints. In 1956, the cost differential was still four cents (Weekly Variety, 11 April 1956, p. 4). For a 90-minute 35mm movie, this difference amounted to $324 per release print.Footnote 10 Since the major and minor studios usually had print runs of 300,distribution costs were therefore $97,200 larger per movie on average (Haines Reference Haines2003, p. 33). Compared to an average budget of $1.1 million for movies released in the 1950s, this suggests that additional distribution costs alone raised total costs by 8.8 percent (Block and Wilson Reference Block and Wilson2010, p. 320).
It is important to note that, despite the difference in production and distribution costs, theaters did not charge a premium for tickets to movies in color, and they did not require specialized equipment to play color movies.Footnote 11 Therefore, the impact on cost from filming in color was fully contained by the studio.
Diffusion of Television and Declining Audiences
Though expensive, color offered studios a way to differentiate their product from black-and-white television programming in the late 1940s. Weekly Variety (19 December 1951, p. 7) noted that “color is one of Hollywood's methods of fighting the tele bugaboo…it's part of Hollywood's showmanship to get people out of their living rooms and into theatre seats.” In 1948, less than 1 percent of households had a television set at home; by 1955, the percentage had risen to 65 percent (Figure 1). This rapid increase in the availability of cheaper substitutes for movies in theaters is often cited as a major factor behind the massive post-war decline in theater attendance (Cook Reference Cook1996, p. 460). Increased migration to the suburbs, away from theater locations in downtown neighborhoods, is another factor (Gomery Reference Gomery1992, pp. 83–88). Average weekly theater attendance declined from a peak of 90 million in 1946 to 60 million in 1950. By 1970,average weekly attendance was just 17.7 million.Footnote 12
The technological advantage of color was diminished by the widespread adoption of color television in the late 1960s. Between 1964 and 1970, the percentage of homes with color television rose from 3 percent to 39 percent. In 1965 NBC announced that its fall prime time schedule would be broadcast almost entirely in color; ABC and CBS quickly embraced color to limit NBC's competitive advantage.
Though the switch to color broadcasting eliminated one of Hollywood's key technological advantages, it also created a new market for color features. In 1965, all three networks were broadcasting color movies during primetime, and average license fees were $400,000 per title (Segrave Reference Segrave1999, p. 85). License fees rose to $800,000 per title in the next three years as the percentage of households with color television increased from 6 to 24 percent.Footnote 13 These fees compare to average domestic theatrical rentals of $1,761,818 and $1,861,012 for MGM and Warner Bros.’ releases in the 1960s. Since networks were eager to fill their programming schedules with color and did not want black-and-white movies, the switch to color broadcasting strongly favored the financing of color features (Segrave Reference Segrave1999, p. 86). The new market for color features, which transformed television from a substitute to a complement for color movies, led to the rapid demise of black-and-white film. Between 1965 and 1967, the share of color movies jumped from 59 to 88 percent; by 1970, the share was 94 percent (Figure 1).Footnote 14
THEORETICAL PREDICTIONS
In this section we adapt the threshold adoption models of Paul David (Reference David and Rosovsky1966) and Stephen Davies (Reference Davies1979), which emphasize adopter heterogeneity as a determinant of diffusion, to clarify the drivers of Hollywood's peculiar adoption profile. The threshold model has been employed to analyze the diffusion of capital goods such as the mechanical reaper and the tractor in which the relative benefits of adoption are increasing in a farm's acreage.Footnote 15 Our model centers on two sources of heterogeneity: studio size, and complementarity between color and the type of movie (genre).Footnote 16
Let θ i characterize the degree of complementarity between a movie of type i and color cinematography, where θ i < θ i+1 . Larger values of i represent movies that benefit more from color such as adventures, musicals, and westerns. Smaller values of i represent comedies, dramas, and mysteries, which benefit less from being filmed in color. Assume i is discrete such that, i ∊ {1,…,I} where I is a large integer, and that each studio j produces f(i) movies of type i in any given year. A color movie of type i from studio j will generate revenue equal to, s j θ l A, where sj is the size of j's distribution network, and A is a scalar that reflects changes in the relative demand for color over black-and-white. For simplicity, assume that if a movie is filmed in black-and-white, studio j derives net value of sjv regardless of its potential value if filmed in color.
Studio j will choose to film a movie of type i in color as long as

where p is the extra cost of using color. It is easy to see that studio j will employ color for movies of type i ∊ {k * j , I} where the threshold movie type k * j is defined by:

Therefore, the number of color movies produced by studio will be

Consistent with the literature on technological adoption, there is a positive correlation between firm size and the speed of adoption: 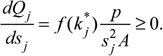 Larger studios have lower threshold movie types, such that for
 and they therefore produce more movies in color. This model also predicts that the number of movies in color rises with reductions in the cost of shooting in color:
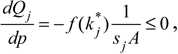 and that this increase may be larger or smaller for larger studios depending on the shape of the
 In particular,
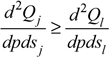 for s
j
≥ sl
if k
*
j
is close to a large mass of movie types that are currently filmed in black-and-white, such that
 Footnote
17
Finally, increases in the relative demand for color will increase the number of movies filmed in color:
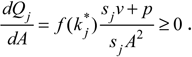
In our empirical analysis that follows, we show that the surge in color production between 1949 and 1954 was a combination of two events that are consistent with our model's predictions. First, the resolution of the Paramount case after 1948 outlawed the practice of block-booking and increased the distribution networks of the minors, which encouraged these studios to produce more color movies). Second, the introduction of an improved Eastman film stock in 1952 lead to a large increase in the share of color movies produced by the majors  as their threshold movie type was comedies and dramas, and these genres comprised more than 60 percent of the average annual slate of the majors (f(kj
) large).
An implicit assumption of our model is that θi and A are known to the studio. If this assumption is relaxed then disadoption can occur if studios overestimate A or θ i , and choose threshold movie types that are too low, i.e., studio j chooses threshold type i < k * j . Studios may overestimate A (or the growth in A) if they fail to anticipate the novelty from color wearing off, and studios may overestimate θ i for new movie types that have yet to be filmed in color. In either case, disadoption will represent a simple adjustment towards a higher threshold movie type after studios learn that their current threshold typeis not profitable to film in color. In the empirical analysis, we provide evidence consistent with this type of learning mechanism. Specifically, we show that studios’ choice of color was affected by the relative performance of color and black-and-white movies, and that the decline in color between 1955 and 1957 was precipitated by weak returns to the color comedies and dramas produced by the majors after the introduction of Eastman's film stock in 1952.
DATA ON AMERICAN FILM PRODUCTION
Feature Films with Information on Production Years, 1940–1959
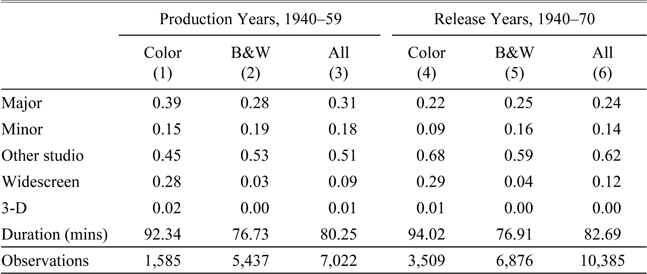
Detailed information on 7,022 feature-length movies produced in the United States between 1940 and 1959 comes from the American Film Institute (AFI) movie catalog, which provides online information on nearly 60,000 American feature-length films produced in America or financed by American production companies from 1893 onwards.Footnote 18 Our analysis focuses on the period 1940–1959 to incorporate information on production years, which allows us to more accurately measure the timing of studio decision-making. While data on production years is available for more than 90 percent of the 7,778 films released between 1940 and 1959, information on production years is only available for 239 of 2,607 movies released between 1960 and 1970 (9.2 percent).Footnote 19 In the sample of 7,022 movies produced between 1940 and 1959, 1,585 titles (22.6 percent) were filmed in color, 2,174 titles (31.0 percent) were produced by the majors, 1,256 (17.9 percent) were produced by the minors, and 3,592 (51.2 percent) were produced by other smaller studios (Table 1).Footnote 20 The most popular genres were drama (37.5 percent), western (20.8 percent), comedy (17.1 percent), romance (5.1 percent), musical (4.9 percent), adventure (4.0 percent), and mystery (2.7 percent).Footnote 21
U.S. Films, 1940–1970

Notes:
An observation is a movie. Major equals 1 if the film's producer is Fox, MGM, Paramount, RKO, or Warner Bros. Minor equals 1 if the film's producer is Columbia or Universal. Other studio equals 1 if the film's producer is not a major or minor. Widescreen equals 1 if the movie was shot with a special widescreen process (e.g., CinemaScope). Duration is the movie's length.
Sources:
AFI, Carr and Hayes (Reference Carr and Hayes1988), Haines (Reference Haines2003), Hayes (1998), IMDb, Limbacher (Reference Limbacher1968), and Sherlock (Reference Sherlock2004).
To compete with television and lure audiences back to the cinema in the post-war period, studios attempted to produce “hit” films with enhanced production values (Sedgwick 2002, p. 678). Historical epics such as The Robe (1953) and Cleopatra (1963) exemplify the characteristics of such movies: color, wider images, and longer running times. To control for correlation between these characteristics, we collected data on the use of a special wide screen format from Robert Carr and R. M. Hayes (Reference Carr and Hayes1988) as well as data on running times from the AFI and Internet Movie Database (IMDb).Footnote 22 Of the 1,933 movies produced between 1953 and 1959, 613 (31.7 percent) used a special widescreen system; 441 (71.9 percent) of these movies were in color.Footnote 23 Color movies have an average running time of 94.0 minutes compared to an average running time of 76.9 minutes for black-and-white movies (Table 1). Data on 40 3-D movies released between 1953 and 1966 come from Richard Haines (Reference Haines2003) and James Limbacher (Reference Limbacher1968).
Financial Information for MGM and Warner Bros. Releases, 1940–1959
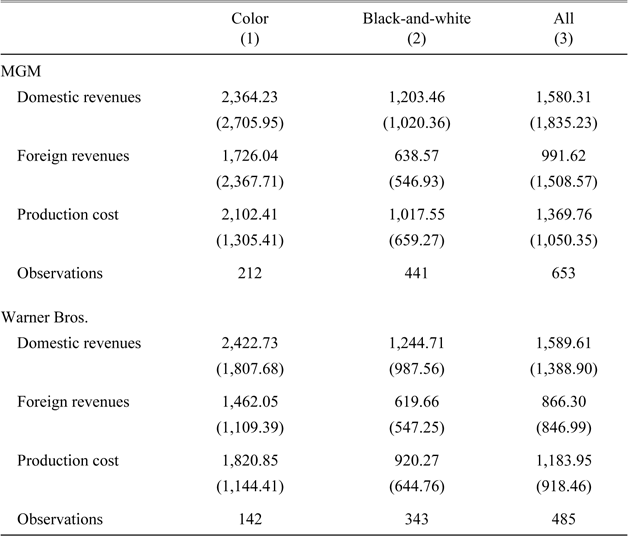
We also obtained data on production costs, domestic revenues, and foreign revenues (expressed in nominal $US) for 1,138 movies released by MGM and Warner Bros. between 1940 and 1959. Data for 653 MGM releases were obtained from the ledger of an administrative vice-president at MGM, Edgar J. Mannix.Footnote 24 Data for 485 Warner Bros. releases were obtained from the ledger of the executive secretary of Jack Warner, William Schaefer.Footnote 25 It is unclear what accounting processes were used in the construction of these ledgers. However, the figures in each ledger appear to be compiled consistently and correspond very closely to figures from other sources, including production and legal files (Glancy 1992, p. 128; Glancy 1995, p. 55).Footnote 26 The Eddie Mannix Ledger also includes information on profits (domestic and foreign revenues less production and distribution costs) for movies released by MGM. These data are not available for movies released by Warner Bros.Footnote 27
Domestic revenues and production costs are remarkably similar across the two studios. Between 1940 and 1959, average domestic revenue was $1.6 million for both studios, and average production costs were $1.4 million for MGM and $1.2 million for Warner Bros. (Table 2). These data also indicate that color movies were significantly more expensive than black-and-white movies. Average production costs for color movies were 2.1 million for MGM and $1.8 million for Warner Bros.; average production costs for black-and-white movies were $1.0 million for MGM and $0.9 million for Warner Bros.
MGM and Warner Bros. Releases, 1940–1959

Notes:
An observation is a movie distributed by MGM or Warner Bros. All figures are net of revenues for re-releases. All figures are in nominal $US. Standard deviations are in parentheses.
Sources:
The Eddie Mannix Ledger and The William Schaefer Ledger.
DETERMINANTS OF COLOR ADOPTION
Studio Size and Genre
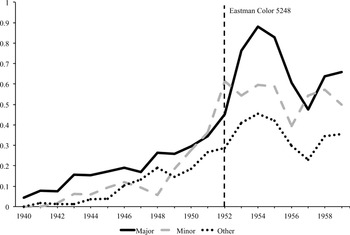
Data on the share of color production by studio size indicate that the surge in color production between 1950 and 1954 is composed of two parts: a surge in color production by the minor studios after the resolution of the Paramount case in 1948, and a surge in color production by the major studios after the introduction of Eastman's improved film stock (type 5248) in 1952 (Figure 2).Footnote 28 Between 1945 and 1948, Columbia and Universal produced a combined output of 24 color features. By comparison, between 1949 and 1952, after the Paramount decision banned the practice of block-booking and granted them access to larger theaters, the two studios produced 83 color features. The share of color movies produced by the majors also increased from 45.1 percent in 1952 to 76.2 percent in 1953 after Eastman's film stock lowered the price of shooting in color (Figure 2).Footnote 29
Share of Color Movies by Studio Type, 1940–59

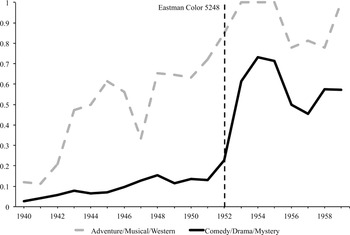
Consistent with the predictions of our model, data on genre indicate that the surge in color features produced by the majors centered on popular genres that were predominantly filmed in black-and-white prior to the introduction of Eastman's improved film stock. Between 1952 and 1954, the share of comedies, dramas, and mysteries filmed in color increased from 22.7 percent to 73.1 percent (Figure 3). These genres comprised 63.0 percent of the average annual slate of the major studios between 1940 and 1959. By comparison, the share of adventures, musicals, and westerns filmed in color experienced a modest increase from 84.8 percent in 1952 to 100.0 percent in 1954 (Figure 3). These genres comprised 21.2 percent of majors’ average annual slate between 1940 and 1959.
Share of Color Movies Produced by Majors, 1940–59

Baseline estimates predict the choice of color, controlling for other movie characteristics such as the use of a widescreen process and running time:

where the dependent variable color i equals 1 if movie i is filmed in color. The dummy variable majori equals 1 if the film's producer is Fox, MGM, Paramount, RKO, or Warner Bros. The dummy variable minori equals 1 if the film's producer is Columbia or Universal. Smaller studios are the excluded group. The variable number of other movies i counts the number of other movies produced by movies i's studio in the same year. gi are genre fixed-effects and yi are year fixed-effects. Standard errors are clustered on movie i's producer to account for correlation in the choice of color within a studio.
The coefficients on majori * post 1948i and minori * post 1948i measure the impact of the resolution of the Paramount decision on the likelihood that the majors and minors film movie i in color, while the coefficients on majori * post 1952i and minori * post 1952i measure the impact of the introduction of Eastman's improved film stock. Since the process of the later divestiture was not instantaneous, and transpired between 1949 and 1954, the coefficients on the post 1948i interactions may underestimate the impact of the Paramount decision. Similarly, the coefficients on the post 1952i interactions may overestimate the impact of Eastman's improved stock if Fox, Warner Bros., and MGM's theater divestitures between 1953 and 1954 induced the majors and minors produce more color features.
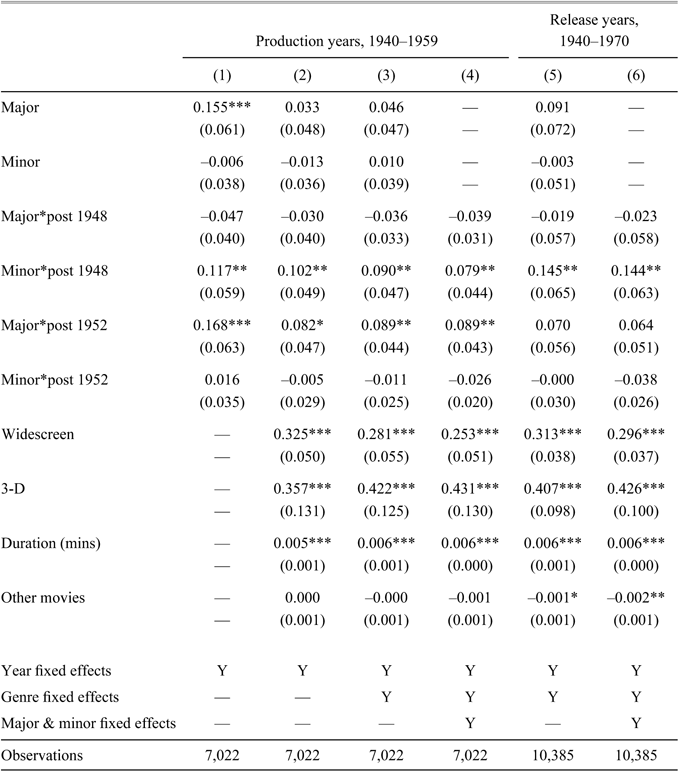
Probit estimates confirm that studio size is an important determinant of color adoption. The majors are15.5 percent more likely to shoot in colorthan independent studios (significant at 1 percent, Table 3, column 1). Including durationi in the regressions attenuates the coefficient on majori since the majors produced significantly longer movies than other studios. Between 1940 and 1959, the average length of movies produced by the majors was 90.9 minutes. By comparison, the average length of movies produced by the minors and other smaller studios was 74.1 and 76.0 minutes.
Controlling for movie characteristics, the resolution of the Paramount case increases the likelihood that minors shoot in color by 9.0 percent (significant at 5 percent, Table 3, column 3). Estimates also indicate that the introduction of Eastman's improved film stock in 1952 increases the likelihood of the majors shooting in color by 8.9 percent (significant at 5 percent, Table 3,column 3).
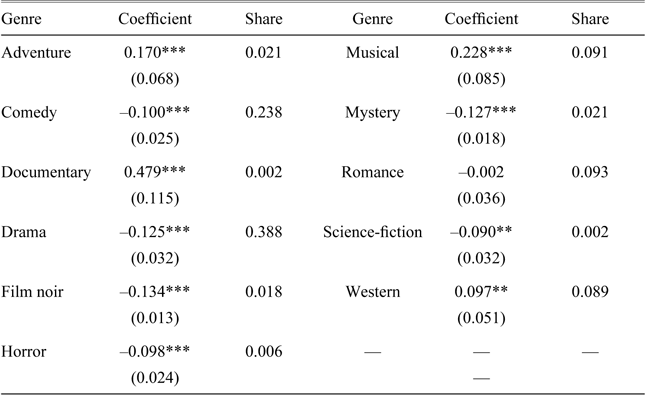
Regression coefficients also confirm that genre is an important factor in the diffusion of color. While adventures, musicals, and westerns are significantly more likely to be filmed in color, comedies, dramas, and mysteries are significantly more likely to be filmed in black-and-white (significant at 5 percent, Table 4). As the share of the majors’ output was dominated by comedies and dramas, the decision to film these genres in color after the introduction of Eastman's improved film stock in 1952 therefore resulted in a large increase in the share of color movies produced by the majors.
Probit – Dependent Variable is Color

* = Significant at the 10 percent level.
** = Significant at the 5 percent level.
*** = Significant at the 1 percent level.
Notes:
An observation is a movie. Marginal effects reported. The dependent variable equals 1 if the movie is shot in color. Timing is based on production years. Major equals 1 if the film's producer is Fox, MGM, Paramount, RKO, or Warner Bros. Minor equals 1 if the film's producer is Columbia or Universal. Smaller studios are the excluded group. Post 1948 equals 1 after the resolution of the Paramount case in 1948. Post 1952 equals 1 after the introduction of Eastman Color 5248, which was suitable for studio work. Widescreen equals 1 if the movie is shot with a special widescreen process (e.g. CinemaScope). Columns (4) and (6) include fixed effects for the seven major and minor studios. Robust standard errors clustered on producer.
Source:
AFI, Carr and Hayes (Reference Carr and Hayes1988), IMDb, Haines (Reference Haines2003), Hayes (1998), Limbacher (Reference Limbacher1968), and Sherlock (Reference Sherlock2004).
Coefficients on Genre Dummies and Shares of Majors' Output, 1940–1952

* = Significant at the 10 percent level.
** = Significant at the 5 percent level.
*** = Significant at the 1 percent level.
Notes:
Coefficients on genre dummies from regression equation (4) (Table 3, column 3). The excluded category is “other.”
Sources:
AFI, Carr and Hayes (1988), IMDb, Haines (Reference Haines2003), Hayes (1998), Limbacher (Reference Limbacher1968), and Sherlock (Reference Sherlock2004).
Probit estimates also indicate that the use of color is positively correlated with the use of a special widescreen process, 3-D, and running length. Films shot in a widescreen process are 28.1 percent more likely to be filmed in color (significant at 1 percent, Table 3,Column 3). Films shot in 3-D are 42.2 percent more likely to be filmed in color, while every 10 minutes in running time is associated with a 6.0 percent increase in the likelihood of color (significant at 1 percent, Table 3, Column 3).
Our results are also robust to using release years instead of production years. The minor studios are 14.5 percent more likely to use color after the resolution of the Paramount case (significant at 5 percent, Table 3, Column 5). The majors are also 7.0 percent more likely to use color after the introduction of Eastman's improved film stock in 1952 (not significant, Table 3, Column 5).
Financial Performance and Disadoption
To investigate the role of learning in the diffusion of color and test whether disadoption between 1955 and 1957 was brought about by the weak performance of the color comedies and dramas produced between 1953 and 1954,we use financial data for MGM and Warner Bros. to calculate a simple nominal rate ofreturn on production costs for movie i:

Since profit figures are not reported for Warner Bros., we cannot incorporate costs related to marketing, film prints, and distribution into our measure of rate of return. Nevertheless, our measure allows us to combine data from both studios and, importantly, compare the relative success of color and black-and-white films over time.Footnote 30
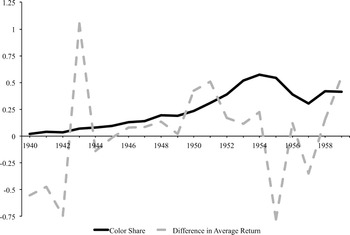
Summary data on color production indicate that changes in the share of color movies tracked the relative success of color and black-and-white movies with a lag of one or two years. Between 1950 and 1951, the difference in the average annual rate of return on color and black-and-white movies was 46.7 percent. Over the next three years, the share of movies filmed in color rose from 30.9 percent to 57.2 percent (Figure 4). Between 1954 and 1955, the difference in average returns plummeted by 100.3 percent from 22.4 percent to −77.9 percent. In the following two years, the share of movies filmed in color decreased from 54.2 percent to 30.5 percent (Figure 4).Footnote 31
Contemporary accounts noted the importance of the smaller returns to coloras a driver of the decline in color after 1955:
Return to b&w has been prompted by a general desire for economy plus the realization that color does not always provide the extra value that can be translated to additional dollars at the boxoffice. Some of the recent b&w pictures have been the best grossers…the film companies, however, are taking a more realistic approach, figuring that the extra cost for color is a gamble in today's uncertain market (Weekly Variety, 25 July 1956, p. 125).
Most importantly, the reversion back to black-and-white reflected a realization that certain genres were better suited to black-and-white. The dramatic rise in the share of comedies and dramas filmed in color by the majors between 1952 and 1954 and subsequent decline between 1955 and 1957 followed the returns to these genres.Footnote 32 Between 1950 and 1951, the average return on 52 black-and-white dramas was 8.9 percent compared with an average return on 4 color dramas of 37.1 percent. In 1955, the average return on 6 black-and-white dramas was 71.8 percent compared with an average return on 12 color dramas of only 9.6 percent. In 1956, Elia Kazan, director of A Streetcar Named Desire and On the Waterfront, commented that color had artistic drawbacks and that he had “yet to find a drama filmed in color where the tinting didn't soften the impact of the story”(Daily Variety, 5 December 1956, p. 8). Kazan's first color film, East of Eden in 1955, was followed up in 1956 and 1957 by two black-and-white features, Baby Doll and A Face in the Crowd. In 1958, Kazan signaled a change of attitude when he commented that his next picture would be shot in color if it suited the film's setting (Weekly Variety, 5 March 1958, p. 19). Consistent with a general rise in color during the 1960s, between 1960 and 1969, three of his four movies were shot in color.
Share of Color Movies and Difference in Returns, 1940–59

To test the impact of prior returns on the decision to film in color, we replace annual fixed effects in Equation 4 with data on the difference in lagged average returns between color and black-and-white movies, as well as data on theater attendance and television adoption:
![\[
\begin{array}
pr(color) [-1]
log weekly attendance [- 1] + d [-1][-2]+ + + y +,i i colori i i i e iff retu rn i i] yi i 1 2 exposur i inde ndext x e nde ndex 3 4 lo lo g weekl a y attendanc ttendanc 1] [1] 5 6 diff retu retu rn rn [2 2]]
\end{array}
\](https://static.cambridge.org/binary/version/id/urn:cambridge.org:id:binary:20160927090728666-0634:S0022050714000837:S0022050714000837_eqn6.gif?pub-status=live)
where the variable exposure indexi measures the speed (performance) of Eastman Color in the year movie i was produced, and and are one-year lagged values of TV saturation and weekly theater attendance. The coefficients on lagged values of estimate the impact of differences in average returns between color and black-and-white movies on the likelihood of shooting movie i in color. We include two lags to match the observed pattern in the data (Figure 4).Footnote 33 Xi includes studio and movie characteristics. Standard errors are clustered on the producer.Footnote 34
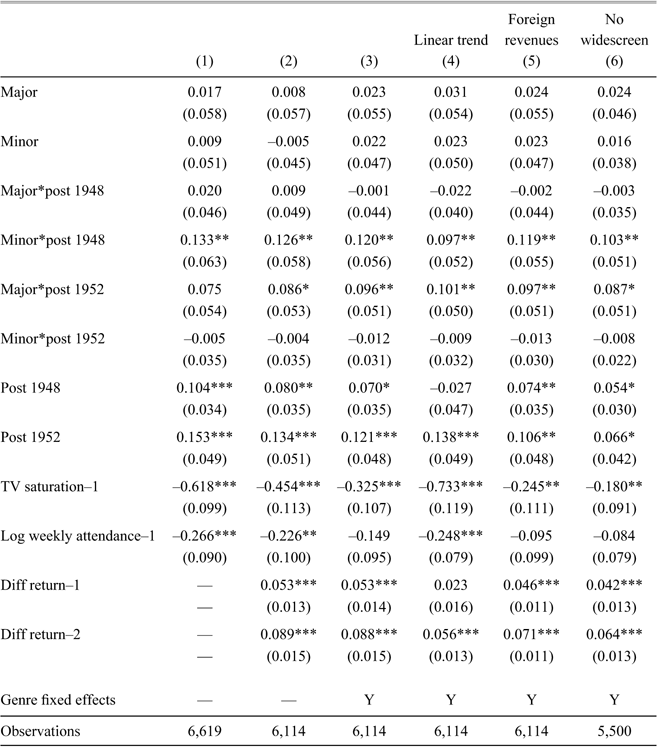
Probit estimates confirm that prior returns affect the decision to shoot in color. A 10 percent rise in the difference between the average return to color and black-and-white movies one year prior to production increases the likelihood of color by 0.5 percent (significant at 1 percent, Table 5, Column 3), while the same rise two years prior to production increases the likelihood by 0.9 percent (significant at 1 percent, Table 5, Column 3). Therefore, coefficient estimates predict a 5.3 and 8.8 percent decline in the share of color production after one and two years in response to the100.3 percent decline in the difference in returns between 1954 and 1955, all else equal. These figures compare to an actual decline of 23.7 percent between 1955 and 1957 (Figure 4).
Midwest Banks Near Transportation Networks at Date of Entry

* = Significant at the 10 percent level.
** = Significant at the 5 percent level.
*** = Significant at the 1 percent level.
Notes:
An observation is a movie. Marginal effects reported. The dependent variable equals 1 if the movie is shot in color. Timing is based on production years. Major equals 1 if the film's producer is Fox, MGM, Paramount, RKO, or Warner Bros. Minor equals 1 if the film's producer is Columbia or Universal. Smaller studios are the excluded group. Post 1948 equals 1 after the resolution of the Paramount case, and Post 1952 equals 1 after the introduction of Eastman Color 5248, which was suitable for studio work. Diff return-t is the difference between the average return on color and black-and-white MGM and Warner Bros. movies t year(s) earlier. All regressions include controls for the speed of Eastman Color film, use of a widescreen process, use of 3-D, running time, and the number of other movies produced by each studio. Robust standard errors clustered on producer.
Sources:
AFI, Brown (Reference Brown1995), Carr and Hayes (1988), The Eddie Mannix Ledger, IMDb, Haines (Reference Haines2003), Hayes (1998), Limbacher (Reference Limbacher1968), Sherlock (Reference Sherlock2004), Television Factbook, and The William Schaefer Ledger.
Consistent with studios using color to lure audiences back to the theater inthe post-war period, the share of color movies is inversely related to changes in theater attendance. A 10 percent decline in average weekly attendance is associated with a 1.5 percent increase in the use of color but the coefficient is not statistically significant (Table 5, Column 3). The diffusion of black-and-white television is negatively correlated with the likelihoodof color is the main specification, suggesting that the impact of increased television adoption operates through the decline in theater attendance, which induced studios to produce more color movies.
Results are robust to including a linear time trend to control for other factors that are independent of the returns to shooting in color (Table 5, Column 4), and including foreign revenues in the rate of return measure (Table 5, Column 5).Footnote 35 A final robustness check drops widescreen movies from the sample. Estimates indicate that a 10 percent rise in the difference in average returns to non-widescreen movies one and two years prior to production increases the likelihood of color without widescreen by 0.4 and 0.6 percent (significant at 1percent, Table 5,Column 6).
In addition to lowering the cost of producing color movies, the introduction of Eastman's improved film strip in 1952 allowed studios to release movies in widescreen formats, which stretched the size of the screen image, and further differentiated their product from black-and-white television. Fox introduced the mostpopular widescreen process in the 1950s, CinemaScope, the following year. The studio licensed out thetechnology at a royalty of $25,000 per film and, as a condition of thelicense, required CinemaScope productions be filmed in color (Weekly Variety, 23 May 1956, p. 7). This stipulation was considered necessary to convince theater owners to install CinemaScope projectors and screens (Lev 2003, p. 116). However, beginning in 1956, Fox allowed CinemaScope productions to be filmed in black-and-white (Weekly Variety, 5 March 1958, p. 19).Footnote 36 At this time morethan 33,000 theaters had been retrofitted with CinemaScope projectors, andthe poor returns from color productions in 1955 made the widescreen format less attractive to studios (Lev 2013, p. 172).
CONCLUSION AND DISCUSSION
The importance of firm size, genre, and past returns in affecting the diffusion of color in Hollywood suggest several reasons for thecomparatively fast adoption of sound. Both sound and color raised production costs. The conversion to sound, in particular, required film producers to spend $24 million to convert their studios(Neale Reference Neale1985, p. 79). However, the industry was less concentrated andintegrated before the introduction of sound. Indeed, the adoption of soundis credited with creating the studio system that was ultimately dismantled by the Supreme Court in 1948. Fox and Warner Bros., which were smaller than Paramount, MGM, and RKO, aggressively pursued the sound technology as a wayto compete with the more established studios, and channeled their profits from pioneering sound into acquiring theater chains (Gomery Reference Gomery1992, pp. 62–64).
There is also no evidence that the addition of sound diminished the impactof any genres. The introduction of sound even created one of Hollywood's most popular genres: the musical. Finally, profits on early talkies weremore impressive than profits on early color films, and these early returns convinced studios to make the necessary capital expenditures for sound. During the 1928/29 and 1929/30 seasons, average profit on 54 MGM movieswith sound was over $200,000, compared with average profits of $126,000 on 43 silent films. Furthermore, the distribution of profits was favorablyskewed for films with sound. Only one silent film earned profits in excessof $500,000 compared with 6 films that included sound. The maximum profit on a sound film was $1.6 million and the largest loss was $216,000. Incomparison, the maximum profit on a silent film was $562,000 and thelargest loss was $878,000.Footnote 37
An important assumption of threshold adoption models is that the new technology is superior to the old technology. Delays are therefore driven by a combination of adopter heterogeneity and cost, not by changes in consumer preferences. In addition to the economic factors explored in this paper, shifts in consumer tastes likely played a role in establishing the perceived superiority of color, particularly for genres that emphasized reality over spectacle. For example, Gorham Kindem (1979, pp. 35–36) notes “television's conversion to color broadcasting and color news film in 1965–1966 gave color added realism in comparison to black-and-white.”
Nevertheless, a growing appreciation of color did not necessarily extend to older movies. In the 1980s, media mogul Ted Turner attempted to colorize films that were originally filmed in black-and-white. In 1985, Miracle on 34th Street became the first colorized film to be widely shown on TV (Brown Reference Brown1995, p. 367). However, Turner soon abandoned the practice of colorizing old titles due to its high cost, about $200,000 per title, and in response to outrage from several prominent directors including George Lucas and Martin Scorsese, who objected to what they considered “cultural vandalism” (Turner and Burke Reference Turner2008, p. 254; Prince Reference Prince2000, p. 130).