


“Both climate change and the transition to a carbon neutral economy pose substantial challenges for the economy and the financial system, with the potential to affect growth and inflation in the short term, but also over much longer horizons.”
— Christine Lagarde (Reference Lagarde2021), President of the European Central Bank (ECB)
1. Introduction
Tackling climate change has become a central policy priority in many advanced economies. Carbon pricing – by internalizing the external cost of emissions – has emerged as a key tool to encourage decarbonization (see, for example, Nordhaus, Reference Nordhaus2018). Yet concerns remain, particularly among policymakers, about whether carbon pricing contributes to inflation, akin to traditional supply shocks (Pisani-Ferry, Reference Pisani-Ferry2021), or instead induces deflationary tendencies by dampening demand, similar to a permanent tax increase (Bartocci et al. Reference Bartocci, Notarpietro and Pisani2022; Ferrari and Nispi Landi, Reference Ferrari and Landi2024). Recent empirical evidence shows that carbon taxes can lead to significant inflationary effects, particularly in high-emission and low-innovation regions (Bettarelli et al. Reference Bettarelli, Furceri, Pisano and Pizzuto2025). Household inflation expectations play a pivotal role in this debate, as they influence consumption decisions and wage bargaining behaviors (Bernanke, Reference Bernanke2007; D’Acunto et al. Reference D’Acunto, Malmendier, Weber, D’Acunto, Malmendier and Weber2023). Therefore, understanding how households adjust their inflation expectations in response to carbon pricing is crucial. Despite its policy relevance, empirical evidence on household inflation expectations in the context of climate policies remains scarce.
Existing research has examined the economic impacts of carbon pricing more broadly, revealing significant geographic heterogeneity. For example, Berthold et al. (Reference Berthold, Cesa-Bianchi and Di Pace2024) show that countries with higher carbon emissions face sharper declines in economic activity, while Mangiante (Reference Mangiante2024) finds poorer regions are more vulnerable to carbon price increases. Känzig and Konradt (Reference Känzig and Konradt2024) compare the economic costs of European carbon taxes and carbon pricing from the European Union Emissions Trading System (ETS), one of the world’s largest cap-and-trade schemes for emission allowances. They point out that regional variation in the economic costs of carbon pricing is influenced by the allocation of free allowances and the structure of electricity markets. This paper builds on these findings by examining geographic variation in the response of inflation expectations. Other work linking inflation expectations to carbon pricing has focused on firms and financial markets. Hensel et al. (Reference Hensel, Mangiante and Moretti2024) and Mangiante (Reference Mangiante2026) examine the inflation expectations of French and Italian firms, respectively, and find that an unexpected increase in carbon prices raises them. In related subsequent work, Bauer et al. (Reference Bauer, Känzig and Rudebusch2026) use high-frequency event studies around European carbon-market regulatory news to show that carbon price surprises significantly raise market-based inflation expectations at horizons of up to ten years, even as forward nominal interest rates barely respond.
In this paper, I investigate how household inflation expectations respond to unexpected increases in carbon prices within the Euro Area, where all member states participate in the ETS. Carbon prices fluctuate with economic activity, which also affects inflation expectations, raising concerns about endogeneity. To address this, I use the exogenous shock series from Känzig (Reference Känzig2026), identified using a high-frequency approach. An increase in carbon prices raises the energy costs for regulated firms, which are then passed on to households. The dynamic effects are estimated using a VAR model with standard Bayesian methods, employing an internal instruments framework as described in Plagborg-Møller and Wolf (Reference Plagborg-Møller and Wolf2021).
This paper is the first to provide cross-country evidence on how household inflation expectations respond to carbon pricing, using nationally representative microdata from across the Euro Area. It yields important insights along four dimensions. First, at the area-wide level, a carbon policy shock – normalized to increase Euro Area energy inflation by one percentage point – raises household inflation expectations in the Euro Area on average by up to 0.1 percentage points at its peak. This increase is both persistent and significant. Similarly, the shock causes a significant increase in household disagreement, highlighting that carbon policy shocks influence households differently in their inflation expectations response.
Second, there is substantial heterogeneity in the response of inflation expectations across Euro Area member countries. In terms of magnitude, households in countries such as France, Belgium, and Finland exhibit markedly weaker responses – around 0.05 percentage points below the Euro Area average – while others, most notably Slovenia, respond by up to 0.15 percentage points more. Regarding the timing of peak responses, two features stand out. Across all countries, inflation expectations adjust more gradually than headline inflation: while headline inflation peaks for most countries within the first two months, expectations typically reach their peak only afterward – consistent with models of information rigidities (Coibion and Gorodnichenko, Reference Coibion and Gorodnichenko2012) and the gradual pass-through of carbon pricing into salient energy prices. At the same time, the size of this timing gap varies meaningfully across countries: measured as the difference in months between the respective peaks, it ranges from near-simultaneous adjustment in some economies to a delay of up to six months in others.
Third, comparing the response of inflation expectations to those following an oil supply news shock reveals a striking similarity in timing and shape across countries, which suggests that it is the perceived inflationary impact of energy price changes, rather than the specific source of the shock, that drives expectation formation. There is, however, a difference in the level of the responses that is consistent with oil supply shocks being more inflationary: at the Euro Area level, the cumulative headline inflation response is about twice as large after an oil supply news shock, a ratio mirrored in the peak responses of inflation expectations.
Fourth, the pattern of cross-country heterogeneity in the expectations response is consistent with an important role of the energy price channel. Countries with a higher overall energy weight in the consumption basket exhibit stronger increases in inflation expectations, and the same holds for countries where consumer confidence declines more sharply after the shock – consistent with the stagflationary belief correlation documented in Kamdar and Ray (Reference Kamdar and Ray2024). Using a panel local projections approach, I decompose the response into a direct shock effect and an indirect price effect, finding that the price channel is the dominant driver of the response of inflation expectations, household disagreement, and consumer confidence.
This paper contributes to the literature on the interaction between inflation expectations and macroeconomic shocks by examining how households adjust their expectations in response to unexpected changes in carbon pricing, using nationally representative microdata on quantitative inflation expectations from the Euro Area. Most existing studies center on the US, examining the interaction between monetary policy announcements and inflation expectations (Carvalho and Nechio, Reference Carvalho and Nechio2014; Coibion et al. Reference Coibion, Gorodnichenko and Weber2022; Breitenlechner et al. Reference Breitenlechner, Geiger and Scharler2024), or the impact of oil price shocks (Coibion and Gorodnichenko, Reference Coibion and Gorodnichenko2015; Wong, Reference Wong2015; Aastveit et al. Reference Aastveit, Bjørnland and Cross2023).
A recent strand of research has investigated the response of inflation expectations to macroeconomic shocks in the Euro Area. For instance, Patzelt and Reis (Reference Patzelt and Reis2024) analyze the impact of rising energy prices on average inflation expectations using the ECB’s Consumer Expectations Survey, finding a negligible effect in the first four months, followed by a significant increase of 0.17 to 0.6 percentage points after twelve months. In contrast, Wehrhöfer (Reference Wehrhöfer2026) employs a difference-in-differences approach to show that German households raise their inflation expectations when personally affected by rising energy prices. Geiger et al. (Reference Geiger, Gründler and Scharler2023) investigate the response of qualitative inflation expectations to identified monetary policy shocks across eleven Euro Area countries. They conclude that households react homogeneously, and in line with models of monetary policy transmission. Similarly, Baumeister (Reference Baumeister2023) studies the impact of an oil supply shock on qualitative inflation expectations, noting both a persistent effect as well as significant heterogeneity across countries. This paper builds on these contributions by examining how household inflation expectations respond to unexpected increases in carbon prices, and by emphasizing important differences across countries within the Euro Area.
The paper is structured as follows. Section 2 introduces the Euro Area survey microdata and the carbon policy shock. Section 3 outlines the econometric framework. Section 4 presents the main results for the Euro Area and highlights country-specific responses, which exhibit notable heterogeneity. I also compare household responses to carbon policy shocks with those to oil supply news shocks. Section 5 examines the sources of this heterogeneity, showing that countries with a larger energy share in household consumption and a more pronounced consumer sentiment response exhibit systematically stronger expectations responses. Section 6 concludes. Supplementary results and a comprehensive set of robustness checks are collected in the online appendix.
2. Data
The empirical strategy builds on two core elements. Section 2.1 describes the survey data on household inflation expectations in the Euro Area, and how they enter into the analysis. Section 2.2 summarizes how Känzig (Reference Känzig2026) constructs the carbon policy shock series by isolating exogenous time series variation, which I use in my analysis.
2.1 Expectations survey data
The survey data are from the Joint Harmonised EU Programme Business and Consumer Survey (BCS) of the European Commission (EC). The data consists of a set of fully anonymized individual answers of the monthly consumer survey from January 2004 to December 2019. The survey is conducted by national institutes but shares a common timetable and a harmonized questionnaire across countries (European Commission, 2023). Most national institutes use a repeated cross-sectional sample. I restrict the analysis to the Euro Area and ten member countries due to data limitations for the other member states. Nonetheless, the sample includes countries that reflect the economic and geographical diversity of the monetary union.Footnote 1
The questionnaire begins with a set of questions regarding the socioeconomic status, including age, gender, income, and education of the respondent. On average, 19,000 individuals participate each month in the Euro Area. For larger countries like Germany or Italy, there are on average about 1,700-1,900 respondents per month. For smaller countries, the monthly sample typically exceeds 1,000 individuals. The relevant survey question concerns respondents’ inflation expectations. In a first step, participants answer a qualitative question about whether they expect inflation to increase, decrease, or stay about the same over the next 12 months. Those who expect inflation to change are then asked the following question:
By how many per cent do you expect consumer prices to go up/ down in the next 12 months? (Please provide a single figure estimate).
Consumer prices will increase by ……,… % / decrease by ……,… %.
If a respondent indicates in the qualitative question that they expect inflation to stay the same, the survey administrator imputes a quantitative inflation expectation of zero for that respondent. To mitigate biases in household inflation expectation surveys – particularly those arising from extreme outliers – Arioli et al. (Reference Arioli, Bates, Dieden, Duca, Friz, Gayer, Kenny, Meyler and Pavlova2017) recommend applying asymmetric trimming to the most extreme responses. Therefore, I exclude responses exceeding 40% in absolute value, which removes approximately 28% of the right tail, while keeping the left tail unchanged. Further trimming is possible, but Arioli et al. (Reference Arioli, Bates, Dieden, Duca, Friz, Gayer, Kenny, Meyler and Pavlova2017) note that beyond 30% trimming, improvements are minimal.Footnote 2
Despite these biases, Arioli et al. (Reference Arioli, Bates, Dieden, Duca, Friz, Gayer, Kenny, Meyler and Pavlova2017) highlight key strengths of the survey data, including a strong consistency between qualitative and quantitative expectations and a high correlation between expected and realized inflation. The survey question is deliberately vague, allowing respondents to apply their own interpretation of the relevant consumption basket.
Previous findings suggest that demographic characteristics play an important role in the formation of inflation expectations. It has been shown that gender, income, marital status, education, and even cognitive abilities have a causal impact on inflation expectations (D’Acunto et al. Reference D’Acunto, Malmendier, Ospina and Weber2021, Reference D’Acunto, Malmendier, Weber, D’Acunto, Malmendier and Weber2023). To ensure that the results are not driven by socioeconomic characteristics such as age, gender, or income (D’Acunto et al. Reference D’Acunto, Charalambakis, Georgarakos, Kenny, Meyer and Weber2024) and to focus on cross-country heterogeneity within the Euro Area, I follow Fofana et al. (Reference Fofana, Patzelt and Reis2024) and residualize the inflation expectations. This is done by running the following regression separately for the Euro Area and each country:
 \begin{equation} \pi _{i,t}^{exp} = \beta _0 + \beta _1 age_{i,t} + \beta _2 educ_{i,t} + \beta _3 income_{i,t} + \beta _4 gender_{i,t} + \delta _{t} + \varepsilon _{i,t} \end{equation}
where
 $\pi _{i,t}^{exp}$
represent the 12-month ahead inflation expectations of survey respondents (
 $i$
) for every month (
 $t$
) from January 2004 to December 2019.
The measure of household inflation expectations is the time-fixed effect,
 $\delta _{t}$
, which is a residualized mean of inflation expectations, for every country and the Euro Area.Footnote
3
Furthermore, the standard deviation of the error term
 $\varepsilon _{i,t}$
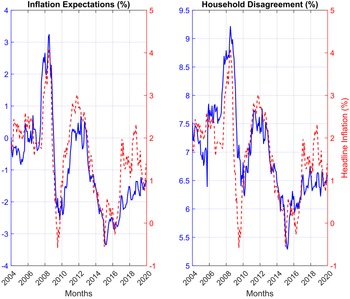
measures the disagreement among households (Fofana et al. Reference Fofana, Patzelt and Reis2024). Incorporating a measure of disagreement takes into account that not all households have the same formation process for inflation expectations, and allows to analyze whether and how pronounced households disagree in response to a carbon policy shock. Previous research suggests that disagreement is time-varying and co-moves with key macroeconomic variables (Mankiw et al. Reference Mankiw, Reis and Wolfers2003). Following Mankiw et al. (Reference Mankiw, Reis and Wolfers2003), I define disagreement as the standard deviation of one-year-ahead inflation expectations across respondents within each country and the Euro Area. This differs from uncertainty, which reflects intrapersonal variation in expectations over time. Figure 1 shows the measure for inflation expectations and household disagreement for the Euro Area.
Household inflation expectations and disagreement.
Notes: The left panel shows the time series of residualized household inflation expectations, and the right panel shows the measure of household disagreement for the Euro Area (left axis for both panels). As a reference, the headline inflation rate is included (red dotted line, right axis) in both graphs.

Figure 1. Long description
Two line graphs are presented side by side. Panel A on the left shows the time series of residualized household inflation expectations in percent on the left y-axis, ranging from -4 to 4 percent. The x-axis represents months from 2004 to 2020. A blue solid line represents the inflation expectations data. Panel B on the right shows the measure of household disagreement in percent on the left y-axis, ranging from 5 to 9.5 percent. The x-axis also represents months from 2004 to 2020. A blue solid line represents the household disagreement data. Both panels include a red dotted line representing the headline inflation rate on the right y-axis, ranging from -1 to 5 percent. The graphs illustrate the trends and fluctuations in household inflation expectations and disagreement over time, with the headline inflation rate provided as a reference.
As a reference, the annualized growth rate of the Harmonized Index of Consumer Prices (HICP) is plotted as well.Footnote 4 On average, inflation expectations surged in 2008, a period marked by high energy and food prices. This was followed by a sharp decrease of inflation expectations during the Great Recession in 2009. After 2012, during the Euro crisis and the zero lower bound period, inflation expectations gradually declined, reaching a trough in 2015. In line with the findings in Mankiw et al. (Reference Mankiw, Reis and Wolfers2003), inflation expectations and household disagreement co-move with the headline inflation rate.
2.2 The carbon policy shock
To study how carbon pricing impacts inflation expectations, I use the carbon policy shock series constructed by Känzig (Reference Känzig2026). Känzig (Reference Känzig2026) leverages the regulatory framework of the European Union Emission Trading System (EU ETS), the largest carbon market in the world, where European firms purchase certificates that allow them to emit greenhouse gases. He exploits unexpected regulatory changes that determine the supply of emission allowances by the EC. If these events cause changes in carbon future prices within a sufficiently tight window, then this change in carbon futures can be attributed to the unexpected regulatory announcement and is exogenous. The series is then refined by regressing it on a set of macroeconomic, financial, oil market, and climatic variables. This takes into account potential predictability of the surprise series.Footnote 5 This high-frequency refined surprise series is then employed as an instrument in a VAR model. Using an external instruments approach, he identifies the structural shocks. This allows Känzig (Reference Känzig2026) to extract the shock series from the VAR model, which I use for the empirical analysis.
3. Econometric model
I estimate the following reduced-form vector autoregressive (VAR) model to investigate the dynamic effects of carbon pricing on inflation expectations:
 \begin{equation} \mathbf{y_t} = \mathbf{c} + \mathbf{B_1} \mathbf{y_{t-1}} + \ldots + \mathbf{B_p} \mathbf{y_{t-p}} + \mathbf{u_t} \end{equation}
where
 $\mathbf{y_t}$
is a
 $n \times 1$
vector of
 $n$
observed variables at time
 $t$
,
 $\mathbf{c}$
is a
 $n \times 1$
vector of constants, and
 $\mathbf{B_p}$
are
 $n \times n$
coefficient matrices for lag
 $p$
. The
 $n \times 1$
vector of reduced-form shocks,
 $\mathbf{u_t}$
, is assumed to consist of mutually uncorrelated, homoskedastic disturbances with zero mean and constant variance. I set the lag length to
 $p = 18$
, equal to the maximum forecast horizon
 $H= 18$
, following the recommendation of Baumeister (Reference Baumeister2025) that the lag length should be at least as large as the forecast horizon to avoid extrapolation bias.
The specification for the Euro Area is a medium-scale model that includes seven variables: the extracted carbon policy shock series from Känzig (Reference Känzig2026), the annualized growth rate of the energy component of the HICP (energy inflation), the annualized growth rate of the overall HICP (headline inflation), the nominal Brent crude oil price in log-levels, and the Consumer Confidence Index (CCI) in log-levels, along with measures of inflation expectations and household disagreement. The carbon policy shock series serves as a source of common exogenous variation across all countries. Including energy inflation is crucial, as it allows normalizing the shock to a one percentage point increase in energy prices and represents the primary channel through which carbon pricing transmits to households. Oil prices are incorporated for two reasons: first, because carbon pricing directly affects firms involved in oil production and refining (Känzig, Reference Känzig2026); and second, due to the well-documented role of oil prices in shaping inflation expectations (Coibion and Gorodnichenko, Reference Coibion and Gorodnichenko2015). The CCI captures households’ forward-looking assessments of economic conditions. It is constructed from the European Commission’s survey data, averaging the balance scores from four qualitative questions on financial and economic perceptions and expectations, as well as intentions for major purchases.Footnote 6 I verify the robustness of the results to an alternative specification that includes additional macroeconomic and financial variables, expanding the baseline set of variables.Footnote 7 Overall, this specification captures the main transmission channels of unexpected carbon price increases and the relevant macroeconomic variables for the expectation formation of households.
Estimation is conducted in a Bayesian framework using a Normal-Inverse Wishart prior. Specifically, it is assumed that the prior for the reduced-form coefficients,
 $\mathbf{b} = vec(\mathbf{{B}_p})$
, follows a normal distribution,
 $p(\mathbf{b}) \sim \mathcal{N}(\mathbf{{b}_0}, \mathbf{{V}_0})$
. The prior for the reduced-form covariance matrix,
 $\mathbf{\Sigma } = E(\mathbf{{u}_t} \mathbf{{u}_t^\prime })$
, is assumed to follow an Inverse-Wishart distribution,
 $p(\mathbf{\Sigma }) \sim \mathcal{IW}(\mathbf{v_0},\bar {\mathbf{S}})$
.Footnote
8
Additionally, I introduce shrinkage with a Minnesota prior on the prior covariance matrix
 $\mathbf{{V}_0}$
, reflecting the belief that each variable follows a random walk process (Litterman, Reference Litterman1986). The hyperparameters are selected following the data-driven approach proposed by Giannone et al. (Reference Giannone, Lenza and Primiceri2015).Footnote
9
Estimation is conducted using 5,000 Gibbs sampling draws, discarding the initial 1,000 draws as burn-in.
To recover the structural shocks from the reduced-form residuals
 $\mathbf{{u}}_t$
, I adopt the internal instruments framework developed by Plagborg-Møller and Wolf (Reference Plagborg-Møller and Wolf2021). This approach enables the identification of structural shocks using observed instruments that may be measured with error, provided two key conditions are satisfied: (i) Relevance, i.e., the instrument is contemporaneously correlated with the structural shock of interest, and (ii) Exogeneity, i.e., the instrument is uncorrelated with all other structural shocks in the system (Stock and Watson, Reference Stock and Watson2018). When these conditions hold, a recursive identification strategy can be implemented by placing the instrument first in the ordering. I follow this strategy using the carbon policy shock series, which likely satisfies both relevance and exogeneity (Känzig, Reference Känzig2026), as an instrument for the true structural carbon policy shock. Under this strategy, I place the instrument first in the VAR system and apply a recursive decomposition. This ordering is justified by the exogeneity assumption, which implies that the carbon policy shock is not contemporaneously influenced by other variables in the system. Importantly, only the first column of the matrix of contemporaneous impacts is used for inference, corresponding to contemporaneous responses to an innovation in the carbon policy shock series. The ordering of the remaining variables is irrelevant for identification.
To investigate cross-country heterogeneity in the transmission of carbon policy shocks, I estimate the VAR model separately for each country, using the same carbon policy shock series as the instrument. This follows the approach of Baumeister (Reference Baumeister2023) by applying a common external shock across country-specific internal instruments models. To ensure comparability across countries, I normalize the shock impact such that it implies a one percentage point increase in Euro Area energy inflation. This setup allows me to trace out each country’s response to the same underlying shock while accounting for country-specific differences in shock transmission and macroeconomic structure.
Each country-specific VAR includes the common variables – namely, the carbon policy shock as instrument, Euro Area energy inflation, and oil prices – as well as country-level measures of energy inflation, headline inflation, consumer confidence, inflation expectations, and household disagreement. This framework explicitly permits heterogeneity in transmission while employing the same instrument and the same shock impact normalization. Therefore, any observed heterogeneity in responses is attributed to differences in the shock propagation. This strategy is particularly well suited to a monetary union like the Euro Area, where a common external shock may generate divergent outcomes across member states. Therefore, estimating separate VARs provides a transparent framework for uncovering these differential dynamics.
4. Empirical results
This section presents the dynamic effects of a carbon policy shock on household inflation expectations and disagreement, first providing results for the Euro Area, where the persistence and significance of the shock impact is demonstrated. Second, country-specific responses and cross-country heterogeneity are quantified and discussed. Finally, I compare the expectation responses to those following an oil supply news shock (Känzig, Reference Känzig2021), finding that the two are similar in shape and timing, with level differences proportional to the respective headline inflation responses.
4.1 Area-wide results
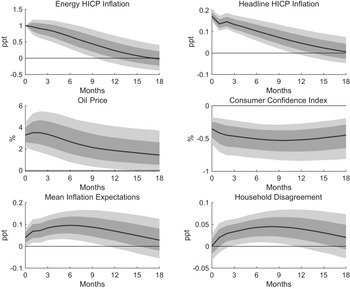
As a baseline, I present the impulse responses for the Euro Area in Figure 2, showing the dynamic effects of a carbon policy shock over a 18-month horizon. Following a carbon policy shock that raises energy inflation by one percentage point, the headline inflation rate increases for approximately a year, accompanied by a significant and pronounced decrease in consumer confidence, the forward-looking measure for economic activity. This is in line with the persistent impact on economic activity documented by Känzig (Reference Känzig2026) who finds that real GDP and especially consumption fall persistently while industrial production decreases. The prolonged impact on economic activity beyond the maximum horizon shown masks regional heterogeneity, as explored by other contributions (Berthold et al. Reference Berthold, Cesa-Bianchi and Di Pace2024; Mangiante, Reference Mangiante2024; Känzig and Konradt, Reference Känzig and Konradt2024).
Dynamic effects of a carbon policy shock.
Notes: The shock impact is normalized to lead to a one percentage point increase in energy inflation. The figure shows the median responses (black lines) together with the 68% (dark gray) and 90% (light gray) error bands.

Inflation expectations display a significant increase in response to the carbon policy shock: households, on average, revise their expectations upward. This relationship is particularly noteworthy given that the sample period was characterized by low and stable inflation rates, and households were not directly targeted by the carbon pricing itself. Instead, they appear to react indirectly, through the energy cost channel - that is, via observed increases in consumer energy prices. Once the effect on headline and energy inflation fades out (after about 9 months), so does the effect on inflation expectations. In line with standard models of information rigidities (Coibion and Gorodnichenko, Reference Coibion and Gorodnichenko2012), the response is hump-shaped, reflecting that household expectations adjust only gradually relative to the immediate increase in headline inflation. While the response of inflation peaks on impact, inflation expectations reach their maximum response only after six months. This pattern is consistent with previous findings for the Euro Area using qualitative survey data of household inflation expectations. For example, Geiger et al. (Reference Geiger, Gründler and Scharler2023) document a peak after six months in response to a monetary policy shock, while Baumeister (Reference Baumeister2023) finds a peak after eleven months in response to an oil supply shock. Quantitatively, average inflation expectations increase by up to 0.1 percentage points following a carbon policy shock that raises headline inflation by approximately 0.2 percentage points on impact, underscoring the sensitivity of household inflation expectations to carbon pricing.
Disagreement among households rises gradually after the shock and peaks after around eight months at approximately 0.05 percentage points. This delayed and persistent increase suggests that not all households adjust their expectations simultaneously, consistent with the idea of slow information diffusion. This finding aligns with earlier evidence that inflation disagreement tends to increase during periods of rising prices (Mankiw et al. Reference Mankiw, Reis and Wolfers2003). One possible explanation is that households update their expectations infrequently or based on heterogeneous information sets – a mechanism captured by sticky or noisy information models (Mankiw and Reis, Reference Mankiw and Reis2002).
The main takeaway is that the rise in household inflation expectations is both significant and persistent. Importantly, this average increase is accompanied by a significant rise in disagreement across households, highlighting heterogeneity in how the inflationary shock is perceived and mapped into expectations.
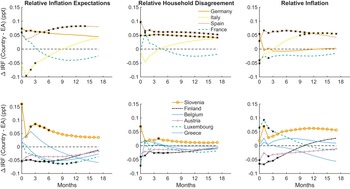
Dynamic effects of a carbon policy shock by country, relative to the Euro area.
Notes: The figure displays impulse responses of inflation expectations, household disagreement, and inflation to a normalized carbon policy shock, shown by country relative to the median response for the Euro Area. For each horizon, I compute the difference between a country’s response and the Euro Area response, such that the Euro Area is normalized to zero. Horizons where the difference is statistically significant at the 68% confidence level are marked with an
 $\times$
.

Figure 3. Long description
The image contains six line graphs showing the dynamic effects of a carbon policy shock by country relative to the Euro area. Each graph represents different metrics: Relative Inflation Expectations, Relative Household Disagreement, and Relative Inflation. The graphs are divided into two rows, each containing three graphs. The x-axis for all graphs represents time in months, ranging from 0 to 18. The y-axis represents the difference in impulse responses (Δ IRF) between individual countries and the Euro Area (EA) in percentage points (ppt). Each graph includes multiple lines representing different countries, with legends indicating which line corresponds to which country. The graphs show how the responses to a carbon policy shock vary by country over time. Statistically significant differences at the 68% confidence level are marked with an asterisk (*).
4.2 Cross-country heterogeneity
While the aggregate results offer a useful overview of how households adjust their inflation expectations in response to a carbon policy shock, they may mask important cross-country differences. Understanding this heterogeneity in the expectation formation process is crucial for policymakers, especially as central banks aim to keep inflation expectations anchored following energy-driven inflationary shocks. I begin by analyzing differences in the magnitude of the responses across countries, comparing how both inflation expectations and disagreement vary. I then examine the timing of these responses by comparing the month at which headline inflation and inflation expectations each reach their peak. Beyond the common pattern of a delayed expectations response relative to the immediate price increase, the number of months separating the two peaks varies meaningfully across countries.
The left panel of Figure 3 displays the median impulse responses of inflation expectations for individual Euro Area member states, obtained from separately estimated VAR models using the carbon policy shock as the instrument. The shock is normalized to generate a one percentage point increase in Euro Area energy inflation. Each country’s response is expressed relative to the median Euro Area response by subtracting it from the country IRF. To facilitate comparison, countries are divided into two panels: the four largest economies and a second group of the six smaller economies. Horizons at which the median response differs significantly from the Euro Area are indicated with crosses, based on 68% error bands.Footnote 10
Two main findings stand out. First, there is some heterogeneity across countries: deviations from the Euro Area response generally lie within a band of 0.1 percentage points. While this range is relatively narrow, it is noteworthy given that the inflationary impulse of the normalized shock is only about 0.2 percentage points on impact, and the sample period is characterized by relatively low and stable inflation rates. Second, the relative response of average inflation expectations (left panel in Figure 3) tends to closely track the relative response of actual inflation (right panel in Figure 3) – countries experiencing a stronger inflationary impact from the carbon policy shock also tend to exhibit a larger increase in expectations. The pattern holds particularly well for the larger economies. A notable exception is Germany, where inflation expectations and disagreement both exceed the Euro Area response by approximately 0.05 percentage points throughout the horizon, despite an inflation response that is virtually identical to the aggregate. Further exceptions include some smaller economies such as Luxembourg, where the relative inflation response is more pronounced, but not tracked by the expectations response. Statistically significant negative deviations from the Euro Area expectations response are observed for Germany, Spain, Slovenia, Luxembourg, and Finland. The most pronounced positive deviation is found for Slovenia, where inflation expectations increase on impact by 0.15 percentage points more than on average in the Euro Area.
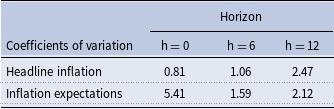
To quantify and compare heterogeneity across countries, I use the coefficient of variation (CoV), a standard measure of relative dispersion. Following Corsetti et al. (Reference Corsetti, Duarte and Mann2022), the coefficient of variation is defined as the ratio of the standard deviation to the mean and captures the extent of heterogeneity relative to the average response. Specifically, I compute the standard deviation of the median impulse responses across countries relative to the Euro Area median response at each horizon, as in Geiger et al. (Reference Geiger, Gründler and Scharler2023).Footnote 11 For consistency, I normalize the Euro Area response to unity in absolute value. Table 1 reports the resulting coefficients of variation for selected horizons.
Coefficients of variation for inflation and inflation expectations for selected horizons

Table 1. Long description
A table with two rows and four columns. The columns are labeled ‘Coefficients of variation’ and ‘Horizon’ with sub-columns ‘h = 0’, ‘h = 6’, and ‘h = 12’. The row labels are ‘Headline inflation’ and ‘Inflation expectations’. Row 1: Headline inflation, 0.81, 1.06, 2.47. Row 2: Inflation expectations, 5.41, 1.59, 2.12. The table shows the coefficients of variation for headline inflation and inflation expectations at different horizons.
The coefficients indicate greater heterogeneity in the response of inflation expectations compared to inflation itself. This aligns with Geiger et al. (Reference Geiger, Gründler and Scharler2023), who find that expectations exhibit more variation following a monetary policy shock than the consumer price index. The on-impact variation for the median responses is 5.41 for inflation expectations, while it is only 0.81 for inflation.Footnote 12 The CoV for inflation expectations declines notably after the initial on-impact heterogeneity, whereas the coefficient for headline inflation remains relatively stable and even increases. After approximately one year, the CoV indicates that the degree of heterogeneity converges across expectations and actual inflation.
Countries may differ not only in the average response of inflation expectations but also in the degree of household disagreement in response to a carbon policy shock. The middle panel of Figure 3 displays the impulse responses of household disagreement to a normalized carbon policy shock. Across all countries, relative disagreement evolves in a pattern similar to that of relative inflation expectations. Countries with a smaller increase in inflation expectations relative to the Euro Area also tend to exhibit a less pronounced rise in disagreement. The cumulative impacts on the mean and the standard deviation of expectations are highly correlated, with a coefficient of approximately 0.87 (p-value = 0.001).Footnote 13 For instance, both Slovenia and Spain show large increases in inflation expectations, accompanied by similarly large increases in household disagreement. These results indicate that carbon policy shocks lead to increases not only in the level of inflation expectations but also in the dispersion of beliefs. The strong cross-country correlation between these two responses suggests that larger shifts in average expectations are associated with greater heterogeneity in how households perceive and process the shock.
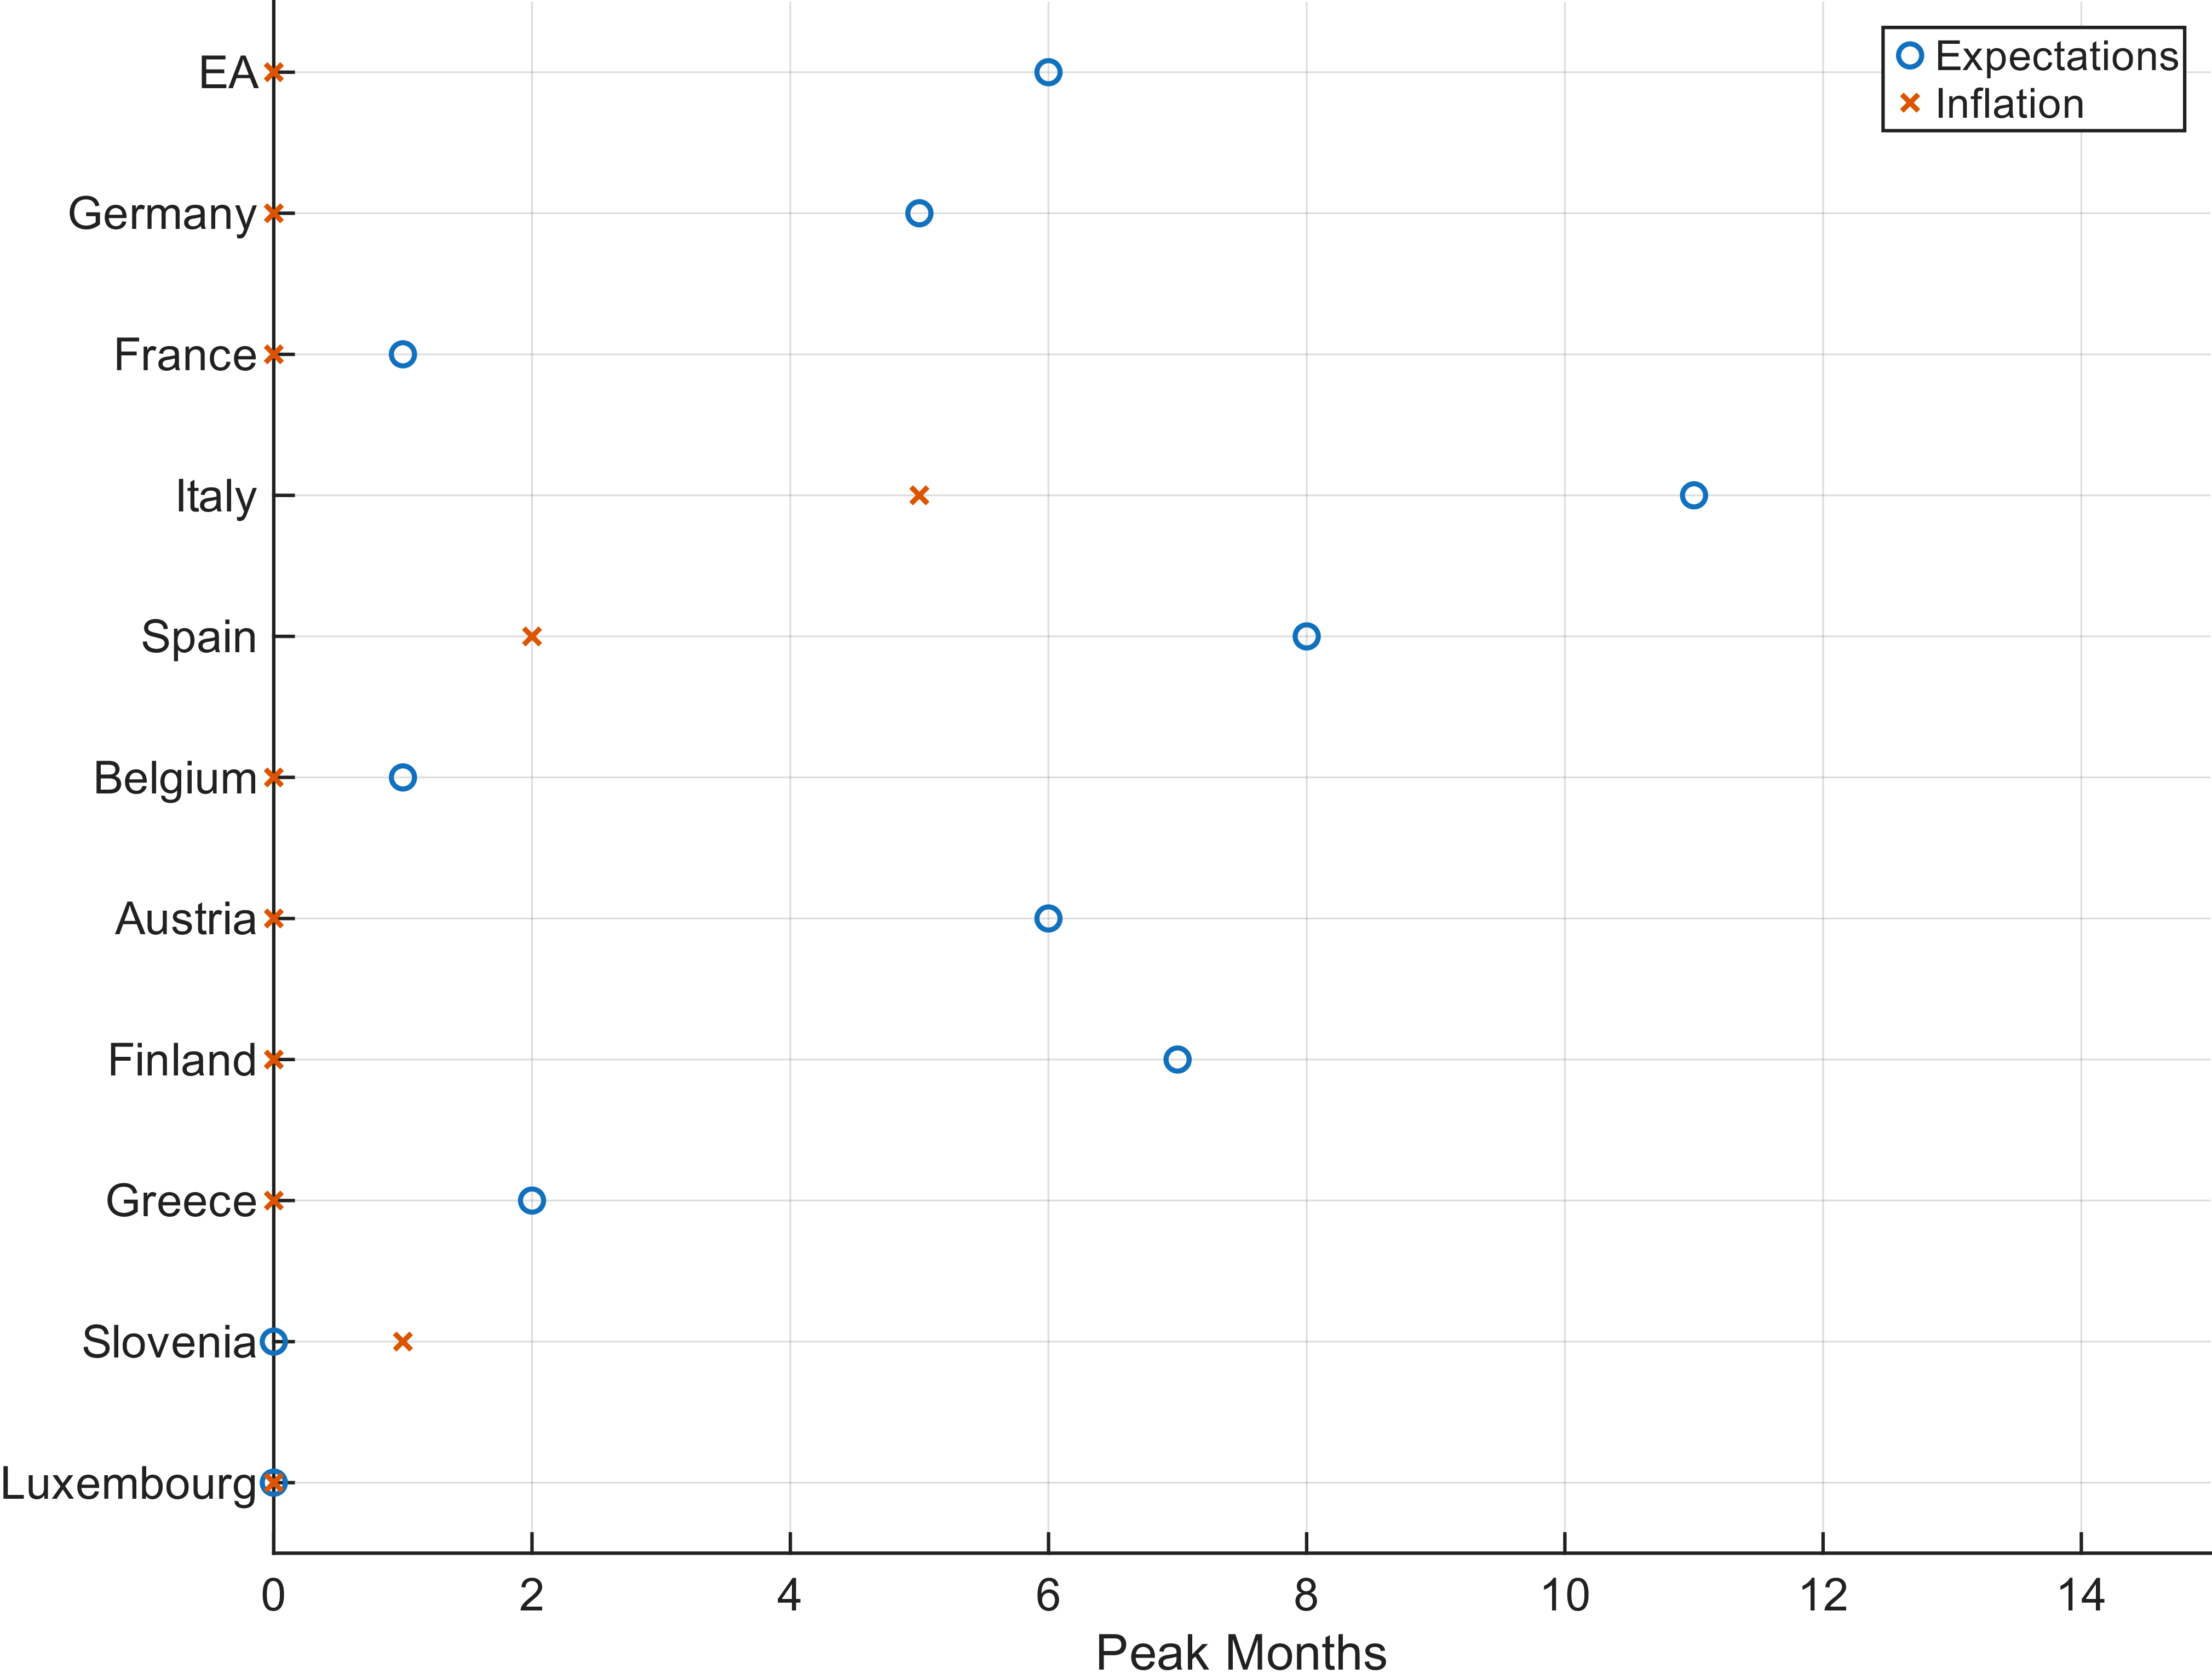
Another dimension of cross-country heterogeneity emerges when examining the timing of the peak response values for inflation expectations and the inflation rate, as shown in Figure 4.
The timing of peak inflation is relatively consistent across countries, with most reaching their maximum inflation response on impact or shortly after – except for Italy, where the peak occurs after around five months. In contrast, the peak response in inflation expectations is generally later and exhibits greater cross-country variation. At the Euro Area level, expectations peak after six months – a pattern closely mirrored only by Germany, Austria, and Finland. In most countries, inflation expectations reach their peak after the inflation rate itself, a pattern that aligns well with models of information frictions, such as the sticky information framework (Mankiw and Reis, Reference Mankiw and Reis2002; Coibion and Gorodnichenko, Reference Coibion and Gorodnichenko2012). This delay suggests that households do not adjust their expectations immediately in response to the policy shock but do so gradually as (energy) price increases materialize and become more salient in day-to-day life.
Peak months of inflation expectations and inflation.
Notes: The figure compares the months of the peak responses for both inflation expectations and the headline inflation following a carbon policy shock. Each point represents the month in which the peak response is observed, highlighting the differences in timing across countries.

The heterogeneity in response timing has implications for monetary policy. Since policy effectiveness often hinges on inflation expectations remaining well-anchored (Baumeister, Reference Baumeister2023), understanding when households revise their expectations following cost-push shocks is relevant for central banks assessing whether and how to respond. Across most countries, the peak expectation response lags the peak inflation response by five to seven months. Luxembourg, Belgium, and France are notable exceptions, with a lag of less than one month, while Slovenia is the only country where the expectation response peaks before headline inflation does.
4.3 Comparison with an oil supply news shock
To assess whether the cross-country pattern documented above reflects a specific expectations response induced by carbon policy shocks or a more general response to energy price shocks, I benchmark the results against the response to an oil supply news shock (Känzig, Reference Känzig2021).Footnote 14 Oil price shocks are a well-documented driver of household inflation expectations (Coibion and Gorodnichenko, Reference Coibion and Gorodnichenko2015; Wong, Reference Wong2015; Aastveit et al. Reference Aastveit, Bjørnland and Cross2023; Baumeister, Reference Baumeister2023). Comparing the two responses is informative about the role of the energy price channel: if households react to the inflationary implications of a shock rather than its specific origin, the responses should look similar. I find that this is indeed the case — the two shocks generate expectations responses that are similar in shape and timing, with level differences proportional to the respective price effects.
Comparison of the effects with an oil supply news shock.
Notes: This figure presents the median response of inflation expectations alongside the 90 % error bands for each country. The carbon policy shock is depicted in red (dashed line), while the oil supply news shock is shown in blue (solid line). Both shocks are normalized to imply a one percentage point increase in the Euro Area energy inflation rate.

I analyze the effects of the oil supply news shock from Känzig (Reference Känzig2021) using the same empirical framework as before, replacing only the instrument in the internal instruments SVAR.Footnote 15 The shock is again normalized to generate a one percentage point increase in Euro Area energy inflation on impact, ensuring comparability across shocks. Figure 5 compares the dynamic responses of inflation expectations to both shocks across countries.
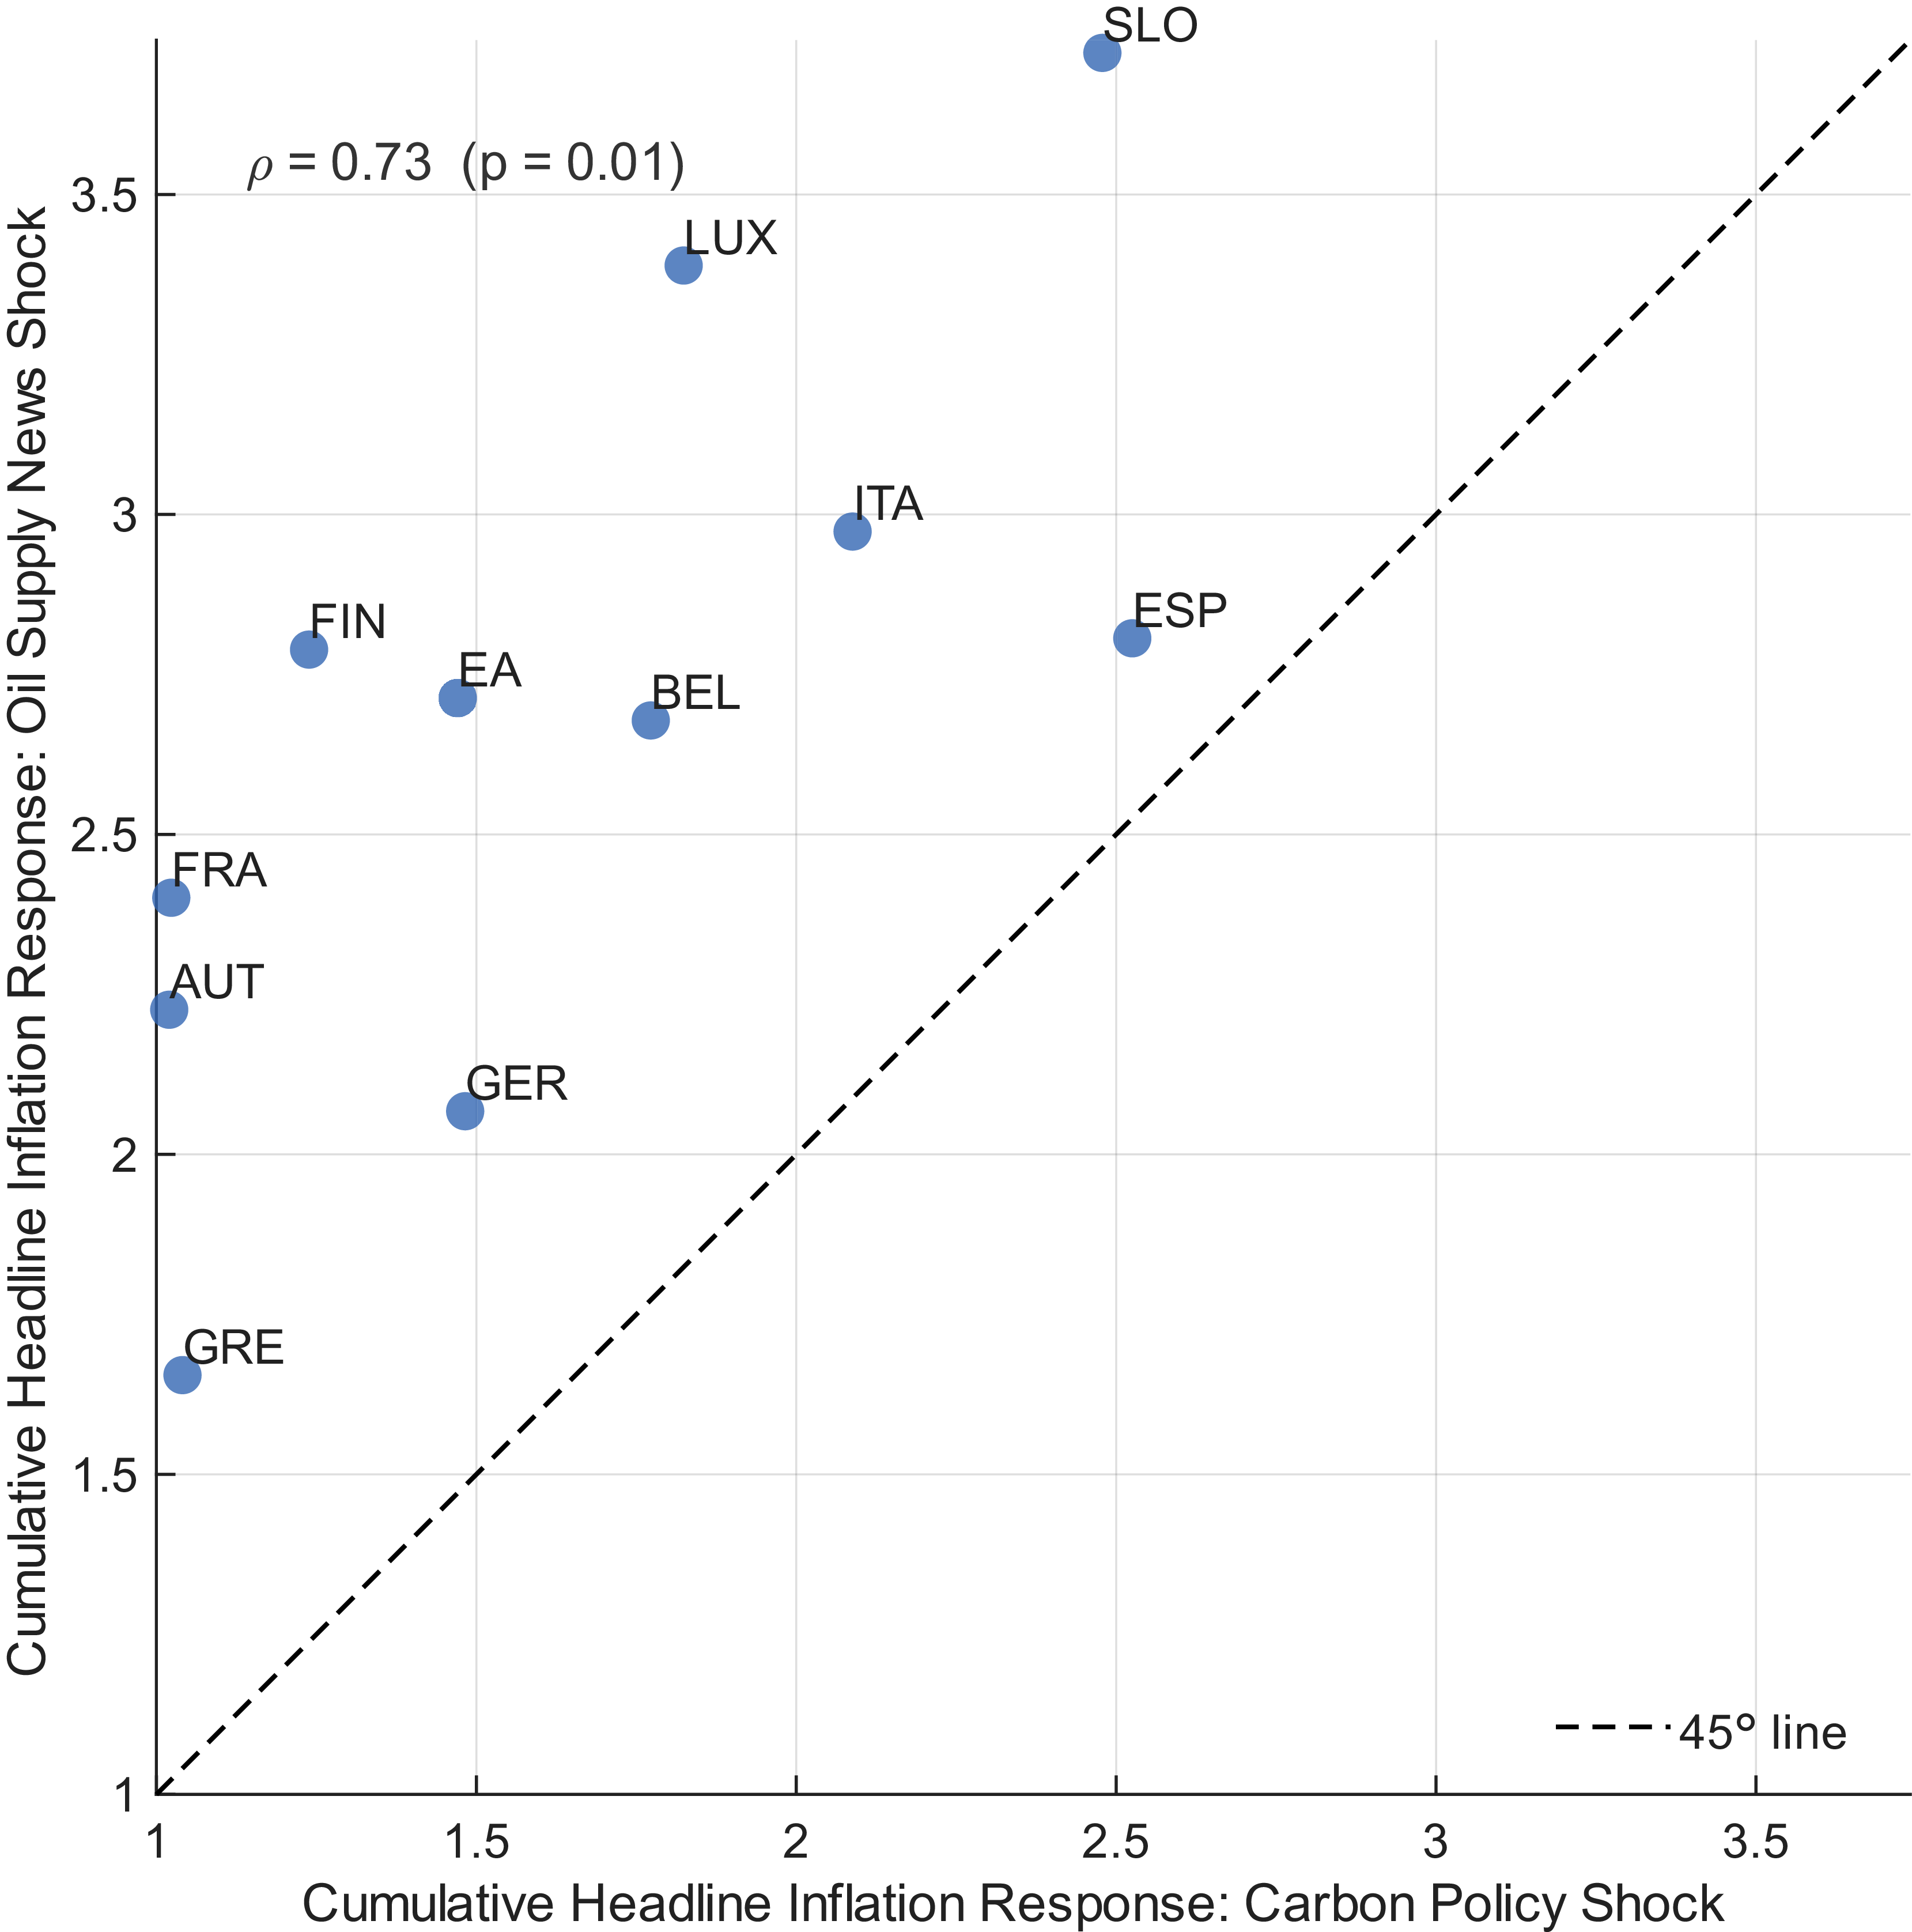
Cumulative response of headline inflation to both shocks.
Notes: Cumulative median headline inflation response over 18 months to a carbon policy shock (x-axis) and an oil supply news shock (y-axis), both normalized to a one percentage point increase in Euro Area energy inflation on impact. Points above the 45-degree line indicate a stronger cumulative response to the oil supply news shock.

The shape and timing of the responses are similar across both shocks. For Spain, Austria, and Finland, the peak response occurs in the same month; and for most of the other countries they are typically close to each other. Overall, for six out of ten countries the peak months differ by no more than two months.Footnote 16 Further, the cross-country peak responses to the two shocks are highly correlated, with a correlation coefficient of about 0.84 – countries that respond more strongly to the carbon policy shock tend to do so also following an oil supply news shock.Footnote 17
The level of the responses, however, differs. The peak impact on inflation expectations following an oil supply news shock is approximately 1.5 to two times larger than following a carbon policy shock – for the Euro Area, the peak response is approximately 0.2 percentage points, roughly twice the peak response after a carbon policy shock. This differential is consistent with the stronger headline inflation pass-through documented in Figure 6, plotting the cumulative headline inflation response to both shocks against each other.
All countries lie above the 45-degree line, illustrating that the oil supply news shock generates a larger cumulative headline inflation response across all countries in the sample. For the Euro Area, the cumulative headline inflation response to the oil supply news shock is approximately 2.75 percentage points – roughly twice the 1.5 percentage points following a carbon policy shock, a ratio that closely mirrors the relative difference in inflation expectations responses. The level difference in expectations is therefore proportional to the difference in realized price effects, suggesting that the (energy) price channel might be the dominant driver.
Beyond the inflation response, the oil price dynamics also differ strikingly: the oil supply news shock raises oil prices by around 10% on impact, compared with only about 3% following the carbon policy shock. Since household inflation expectations are sensitive to salient gasoline prices (Coibion and Gorodnichenko, Reference Coibion and Gorodnichenko2015; Wong, Reference Wong2015; Coibion and Gorodnichenko, Reference Coibion and Gorodnichenko2025), the smaller oil price response following a carbon policy shock translates into a weaker and less visible price signal for households – consistent with a more muted expectations response.Footnote 18
Taken together, the similarity in expectations responses across the two shocks suggests that households respond to the implied price effects of an energy shock rather than to its specific origin. This points naturally to the energy price channel as a potential mechanism underlying the cross-country heterogeneity documented above.
5. Understanding the heterogeneity
What explains the response of household inflation expectations – and why does it differ across countries? In the first subsection, I establish two cross-country patterns: countries with a larger energy share display stronger expectation responses on average, and stronger expectation responses are correlated with sharper deterioration in consumer sentiment, consistent with the stagflationary belief correlation documented by Kamdar and Ray (Reference Kamdar and Ray2024). In the second subsection, I show that conditioning on future energy inflation dynamics (Mangiante, Reference Mangiante2026) eliminates the responses of inflation expectations and consumer confidence – suggesting that the energy price channel is the common driver underlying both patterns, and that households respond to the carbon policy shock primarily through its inflationary implications rather than its specific origin.
5.1 Cross-country evidence
Even though I control for socioeconomic characteristics that influence the formation of inflation expectations, a substantial degree of heterogeneity remains across countries. In the left graph of Panel A in Figure 7, I plot the peak inflation expectations response against the average energy weight in the country HICP basket, finding a significant positive correlation with a coefficient of approximately 0.6. Given that the HICP is constructed as a weighted index of consumer goods and services, a higher energy weight implies greater direct exposure to energy price fluctuations, which might be leading to a stronger reaction in inflation expectations. For instance, Germany, Spain, and Slovenia – each with an energy share of around 11% or higher – display notably larger peak responses than Austria, Italy, Finland, or Greece, where energy accounts for only about 8% of the consumption basket. This is consistent with evidence that household inflation expectations respond more or less proportional to the energy expenditure shares in their basket (Binder, Reference Binder2018).
To investigate this further, I estimate relative impulse responses, splitting the country group in the half with the larger energy weight (Slovenia, Germany, Spain, Luxembourg, and Belgium) and the remaining countries, using the following panel local projection model (Jordà, Reference Jordà2005):
 \begin{equation} \pi _{c,t+h}^{exp} = \alpha _{c,h} + \beta _h s_t + \gamma _h (s_t \times g_c)+ \sum _{p=1}^{6} \delta _{p,h}' \mathbf{X}_{c,t-p} + \varepsilon _{c,t+h}, \end{equation}
where
 $s_t$
is the carbon policy shock,
 $\alpha _{c,h}$
are country fixed effects, and
 $g_c$
is an indicator equal to one for the five countries with the largest energy share. The control vector
 $\mathbf{X}$
includes up to six lags of the dependent variable,
 $\pi _{c,t+h}^{exp}$
, headline inflation, energy inflation, oil prices, and consumer confidence. I select the lag length of the local projection model following the insights of Ludwig (Reference Ludwig2024) that the forecast of a local projection of order
 $p$
estimated through horizon
 $h$
corresponds to a sequence of one-step ahead forecasts from VAR models of increasing order up to
 $p + h - 1$
. Therefore with
 $p = 6$
and
 $H = 12$
, this implies a VAR order of up to 17, well aligned with the 18-lag BVAR estimated for the baseline results. The differential impulse response is captured by the sequence of coefficients
 $\gamma _h$
, with inference based on a wild cluster bootstrap with Webb weights, two-way clustered at the country and time level (Roodman et al. Reference Roodman, Nielsen, MacKinnon and Webb2019).
The left graph of Panel B in Figure 7 shows the differential impulse responses, which are for almost all horizons positive and reach up to 0.1 percentage points at horizons four to eight, statistically significant at the 68% level. This constitutes suggestive evidence that differences in the energy consumption share are a key channel through which carbon policy shocks differentially affect inflation expectations – consistent with the well-established finding that households rely on frequently observed prices, and energy prices in particular, when forming their inflation expectations (D’Acunto et al. Reference D’Acunto, Malmendier, Weber, D’Acunto, Malmendier and Weber2023; Coibion and Gorodnichenko, Reference Coibion and Gorodnichenko2025).
Explaining cross-country heterogeneity in inflation expectations.
Notes: Panel A shows the cross-country correlation between (left) the average energy weight in the HICP basket (2004–2019) and the peak response of inflation expectations, and (right) the peak response of consumer confidence and the peak response of inflation expectations. Panel B displays the differential impulse responses from a panel local projection (equation 3), estimated for the high-exposure group versus the remaining countries. Responses are normalized to a one percentage point increase in EA energy inflation on impact. The confidence intervals are computed using a wild cluster bootstrap with Webb weights, two-way clustered at the country and time level, and are shown at the 68 % and 90 % confidence level (Roodman et al. Reference Roodman, Nielsen, MacKinnon and Webb2019).

Consumer confidence
Another striking pattern in the results is the strong negative correlation between the peak consumer confidence response and the peak inflation expectations response across countries, visible in the right graph of Panel A in Figure 7: countries where consumer confidence deteriorates more sharply following the carbon policy shock also display stronger upward revisions in inflation expectations. The correlation coefficient is
 $-0.66$
.Footnote
19
This pattern is consistent with findings in the literature. Kamdar and Ray (Reference Kamdar and Ray2024) document a stagflationary belief correlation – an empirical pattern where consumers who expect higher unemployment also expect higher inflation. They propose a model of rational inattention in which individuals, facing costly information acquisition, allocate attention toward more relevant shocks. Because supply-driven recessions are especially costly for households that rely on labor income, consumers rationally devote more attention to supply shocks than to demand shocks; as a result, inflation is perceived as countercyclical. This mechanism helps explain why pessimistic consumers expect higher inflation while optimistic ones do not, suggesting a systematic link between consumer confidence and inflation expectations.
I compute again relative impulse responses using the panel local projection model (3), setting
 $g_c = 1$
for the four countries with the strongest consumer sentiment decline – Spain, Slovenia, France, and Luxembourg.Footnote
20
The right graph of Panel B in Figure 7 shows the differential impulse response, which is around 0.1 percentage points and is statistically significant at the 68% level for the the months three to eight.
The co-movement of inflation expectations and sentiment complements recent work on the geographic effects of carbon pricing on economic activity. Mangiante (Reference Mangiante2024) finds that poorer regions – more prevalent in countries such as Spain and Slovenia – are disproportionately affected by carbon policy shocks, experiencing larger contractions in output. Since consumer sentiment is a forward-looking indicator of economic conditions, the stronger rise in inflation expectations observed in these countries may also reflect the influence of worsening economic prospects on expectations.
5.2 A price channel decomposition
To quantify how much of the aggregate response is driven by the direct energy price channel, I follow Holm et al. (Reference Holm, Paul and Tischbirek2021) and Mangiante (Reference Mangiante2026), and augment the panel local projection model with leads of energy inflation, thereby decomposing the direct shock effect from the portion that works through the energy price path. Specifically, I estimate:
 \begin{equation} \pi _{c,t+h}^{exp} = \alpha _{c,h} + \beta _h s_t+ \sum _{p=1}^{6} \delta _{p,h}' \mathbf{X}_{c,t-p}+ \sum _{m=0}^{h} \phi _{m,h} v_{c,t+m} + \varepsilon _{c,t+h}, \end{equation}
where
 $v_{c,t+m}$
represents the leads of energy inflation.Footnote
21
The number of horizons, control variables, and lags is the same as in equation (3). I estimate the sequence of coefficients
 $\beta _h$
both without and with the energy inflation leads, and interpret the difference as the contribution of the direct price channel. Figure 8 presents the impulse responses of inflation expectations (top-left panel), household disagreement (top-right panel), and consumer confidence (bottom-left panel) under each specification.
Price-channel decomposition of household responses.
Notes: The figure shows impulse responses from the panel local projection model (4), estimated without energy inflation leads (Baseline IRF, blue solid) and conditional on energy inflation leads (Direct Effects, red dashed). The top-left panel shows the response of inflation expectations, the top-right panel the response of household disagreement, and the bottom-left panel the response of consumer confidence. Responses are normalized to a one percentage point increase in EA energy inflation on impact. Confidence intervals are computed using a wild cluster bootstrap with Webb weights, two-way clustered at the country and time level, and are shown at the 68 % and 90 % confidence level (Roodman et al. Reference Roodman, Nielsen, MacKinnon and Webb2019).

Figure 8. Long description
The image contains three line graphs showing the responses of different economic indicators to a one percentage point increase in energy inflation. Panel A: The top-left graph shows the response of inflation expectations over 12 months. The y-axis represents the change in inflation expectations in percentage points (ppt), and the x-axis represents time in months. The blue solid line represents the baseline impulse response function (IRF), while the red dashed line represents the direct effects. The shaded areas around the lines indicate confidence intervals at the 68 percent and 90 percent levels. Panel B: The top-right graph shows the response of household disagreement over 12 months. The y-axis represents the change in household disagreement in percentage points (ppt), and the x-axis represents time in months. The blue solid line represents the baseline IRF, while the red dashed line represents the direct effects. The shaded areas around the lines indicate confidence intervals at the 68 percent and 90 percent levels. Panel C: The bottom-left graph shows the response of consumer confidence over 12 months. The y-axis represents the change in consumer confidence in percent (%), and the x-axis represents time in months. The blue solid line represents the baseline IRF, while the red dashed line represents the direct effects. The shaded areas around the lines indicate confidence intervals at the 68 percent and 90 percent levels.
Strikingly, once energy price dynamics are controlled for, the impulse responses for inflation expectations, household disagreement, and consumer confidence are close to zero and statistically insignificant throughout the horizon. This indicates that the carbon policy shock affects household expectations and sentiment almost exclusively through its pass-through into energy prices, rather than through any additional direct policy channel. The finding is consistent with Mangiante (Reference Mangiante2026), who documents that the energy price pass-through is also the dominant channel for the expectations response of Italian firms to carbon policy shocks.
6. Conclusion
Policymakers have increasingly voiced concerns about the inflationary effects of climate policies, sparking a public debate around so-called “green inflation.” In light of the macroeconomic importance of inflation expectations, this paper examines how households in the Euro Area revise their inflation expectations in response to carbon policy shocks, using exogenous time series variation in carbon prices from Känzig (Reference Känzig2026).
The analysis yields four main findings. First, carbon policy shocks lead to a sizable and persistent increase in inflation expectations, alongside a rise in household disagreement. This suggests that households are attentive to energy-related price changes, likely reacting indirectly through the energy cost channel. Second, there is considerable cross-country heterogeneity in both the magnitude and timing of expectation responses. Third, these differences are similar in shape and timing as those following an oil supply news shock, with differences in the magnitude that are proportional to differences in the price responses. Fourth, expectations respond more strongly in countries where energy makes up a larger share of household spending, and in countries where consumer sentiment declines more sharply after a carbon policy shock, consistent with stagflationary beliefs. In order to assess the role of indirect price effects, I use a panel local projections framework and decompose the direct shock effect and the price effect, finding that the latter clearly dominates.
These results carry meaningful implications for policymakers. Central banks should monitor how households adjust their expectations in response to climate-related policies, as these are sensitive to carbon pricing – particularly when energy prices are highly salient and consumer sentiment weakens. The documented cross-country heterogeneity in expectation formation highlight the importance of understanding national differences when assessing the transmission of climate policy.
Supplementary material
The supplementary material for this article can be found at https://doi.org/10.1017/S1365100526101308.
Acknowledgements
I am grateful for the comments and suggestions from the Associate Editor, two anonymous referees, Rüdiger Bachmann, Christiane Baumeister, Mitchell Boice, Martin Geiger, Ethan Lieber, Jane Ryngaert, Athiana Tettaravou, and participants of the 7th Behavioral Macroeconomics Workshop in Bamberg, Germany. I would also like to thank Diego Känzig for providing the carbon policy shock series as well as the unit A.3 of the DG ECFIN of the EC for sharing the microdata. This research did not receive any specific grant from funding agencies in the public, commercial, or not-for-profit sectors.


 ×



 Open access

