INTRODUCTION
Pathological Eating Behavior – Immediate Versus Long-Term Reward
Anorexia Nervosa (AN) and Bulimia Nervosa (BN) are characterized by the tendency to make decisions that have positive short-term consequences, but that may result in long-term negative outcomes (Brand, Franke-Sievert, Jacoby, Markowitsch, & Tuschen-Caffier, Reference Brand, Franke-Sievert, Jacoby, Markowitsch and Tuschen-Caffier2007). In AN, individuals severely restrict their caloric intake to obtain an immediate reward (the relief of anxiety elicited by food phobia) while ignoring the progressive and inevitable decline in their physical health (Cavedini et al., Reference Cavedini, Bassi, Ubbiali, Casolari, Giordani and Zorzi2004). Similarly, in BN, there is a tendency to engage in self-damaging behaviors (binge eating/purging) that provide immediate benefit (relief of tension), at the cost of negative medical consequences (Boeka & Lokkenz, Reference Boeka and Lokkenz2006). This diminished ability to assess future consequences has also been hypothesized as characteristic of overweight and obese individuals (Davis, Levitan, Mugllia, Bewell, & Kennedy, Reference Davis, Levitan, Muglia, Bewell and Kennedy2004). These individuals choose to overeat (often palatable energy-dense foods) despite the long-term negative health consequences. Common to AN, BN, and obesity is an inability to appropriately regulate eating behavior.
The Iowa Gambling Task (IGT) and Eating Pathology
The IGT (Bechara, Damasio, Damasio, & Anderson, Reference Bechara, Damasio, Damasio and Anderson1994) was developed for functional assessment in ventromedial prefrontal cortex (VmPFC) patients, who show impaired decision making. Card deck selection assesses the ability to forgo immediate gain for a longer-term successful outcome. It simulates decision making strategy by factoring uncertainty, reward, and punishment (Bechara et al., Reference Bechara, Damasio, Damasio and Anderson1994). The IGT is underpinned by the Somatic Marker Hypothesis (SMH) (Damasio, Reference Damasio1994), a theory that views decision making as a dual combination of “high reason,” carrying out a logical cost-benefit analysis of a given action, and “somatic marker” biasing signals, indicating how rewarding or punishing an action is likely to be. Successful IGT performance has been correlated with the development of “somatic marker” signals (as indexed by anticipatory skin conductance responses [SCRs]) in healthy control participants, and with the absence of such signals in VmPFC patients (Bechara, Tranel, Damasio, & Damasio, Reference Bechara, Tranel, Damasio and Damasio1996). The IGT has been validated with a wide range of clinical groups (see Dunn, Dalgleish, & Lawrence, Reference Dunn, Dalgleish and Lawrence2006).
Despites calls for direct comparisons of the decision making profile in disordered eating groups (Brand et al., Reference Brand, Franke-Sievert, Jacoby, Markowitsch and Tuschen-Caffier2007), research has assessed each group separately using the IGT. Significant impairment on the IGT was revealed in the acute stage of AN, independent of illness severity or Body Mass Index (BMI) (Cavedini et al., Reference Cavedini, Bassi, Ubbiali, Casolari, Giordani and Zorzi2004). Female AN patients who had a better IGT decision making profile at baseline showed a significantly greater improvement in nutritional status after a cognitive–behavioral treatment program (Cavedini et al., Reference Cavedini, Zorzi, Bassi, Gorini, Baraldi and Ubbiali2006). Consistent with the SMH (Damasio, Reference Damasio1994), impairment in decision making ability in females with AN was associated with significantly attenuated somatic marker signals (indexed by SCRs), compared with both healthy controls and females with long-term recovery from AN (healthy BMI and minimum 1 year’s menstruation) (Tchanturia, Liao, Uher, Lawrence, Treasure, & Campbell, Reference Tchanturia, Liao, Uher, Lawrence, Treasure and Campbell2007). Significant impairment was found in undergraduate women with BN, wherein IGT performance negatively correlated with bulimic symptomatology (Boeka & Lokkenz, Reference Boeka and Lokkenz2006). A recent study found that female BN patients performed poorly on the IGT (Liao et al., Reference Liao, Uher, Lawrence, Treasure, Schmidt and Campbell2009), but with no impairment in SCR (in contrast to results with AN; Tchanturia et al., Reference Tchanturia, Liao, Uher, Lawrence, Treasure and Campbell2007). In a comparison of AN females (who were either underweight or recovered to normal weight) and BN females, research found no significant differences on the IGT between these eating disorder groups and controls (Bosanac et al., Reference Bosanac, Kurlender, Stojanovska, Hallam, Norman and McGrath2007). However, the eating disorder groups tended to score lower, and failure to reach significance may be attributable to low statistical power. Finally, both healthy women with a high BMI (BMI>25) (Davis et al., Reference Davis, Levitan, Muglia, Bewell and Kennedy2004), and individuals with severe obesity (BMI>34) (Pignatti, Bertella, Albani, Mauro, Molinari, & Semenza, Reference Pignatti, Bertella, Albani, Mauro, Molinari and Semenza2006) performed disadvantageously on the IGT. A comparison of obese women with and without Binge Eating Disorder (BED) found that both groups had lower mean IGT scores than a normal weight group, but were not significantly different from each other. When education was included in the analyses, those with a higher education performed better and the group differences were not significant (Davis, Patte, Curtis, & Reid, Reference Davis, Patte, Curtis and Reid2010).
Aims
Separate examinations of AN, BN, and obesity have revealed significant decision making impairments in terms of IGT performance. This study furthers this research by directly comparing the decision making profiles of AN, BN, and obese females on the IGT, and evaluating their performance in relation to a healthy comparison group.
METHOD
Participants and Procedure
AN and BN participants
Twenty-two female participants who met the DSM-IV-TR (American Psychiatric Association [APA], 2000) criteria for AN and 17 female participants who met the BN criteria were recruited from a rehabilitation program in an Italian hospital specialized in the treatment of obesity and eating disorders. The AN group ranged in age from 18 to 46 years, and the BN group from 19 to 38 years. All patients underwent diagnostic interviews conducted by a trained psychiatrist and a psychologist. Participants were not tested during an acute stage of illness.
Obese participants
Eighteen female obese individuals were recruited from an Irish hospital specialized in obesity management. Participants ranged in age from 30 to 73 years.
Exclusion criteria common to all three clinical groups were underage (<18 years), and failure to complete the compulsory education period (minimum 8 years of formal education). Additional exclusion criteria for the AN and BN groups were disease duration of <1 year, a comorbid personality disorder or other pervasive psychopathology, and oppositional behaviors during the experimental session (two participants removed). For the obese group, other exclusion criteria included a diagnosis of psychopathology, BED, or a documented history of binge eating by the hospital’s clinical psychologist.
Comparison participants
The comparison group comprised 20 normal-weight females matched on age and education to the AN and BN groups, and education only to the obese group, with no history of psychiatric or neurological illness, and no current clinical diagnosis. The group ranged in age from 18 to 40 years.
Both studies received ethical approval from the relevant hospital ethics committees, and all participants gave written informed consent.
Measures
Anthropometric measurements
BMI (weight in kilograms/height in meters2) was measured to the nearest 0.1 Kg and 0.01 m.
Decision making
In a computerized version of the IGT (Bechara et al., Reference Bechara, Damasio, Damasio and Anderson1994), participants are given a loan of $2000 play money and are told to make choices that maximize their gains, with minimal instructions regarding the rules of the task. Over 100 trials, they choose between four decks of cards (A, B, C, D) some of which yield high immediate gain ($100) but larger future losses (“disadvantageous decks”: A and B) and others that yield lower immediate gain ($50) but smaller future losses (“advantageous decks”: C and D). Every 10 cards from decks A and B gain $1000, but deck A incurs five unpredictable punishments ranging from $150 to $350 bringing the total loss to $1250, while deck B incurs one large punishment of $1250. Every 10 cards from deck C or D amounts to a gain of $500, but the punishments incurred are also smaller ranging from $25 to $75 in deck C with a total loss of $250, and a single loss of $250 in deck D. Decks A and B are disadvantageous because they cost the most in the long run, while decks C and D are advantageous because they result in an overall gain.
Data Analysis
IGT performance between groups (comparison group, AN, BN, obese) was examined by a global outcome score (net score) and a net score for each consecutive block of 20 cards. Net scores are derived from the total number of cards chosen from the advantageous decks (C & D) minus the number of cards chosen from the disadvantageous decks (A & B). Lower scores represent poorer performance, and negative scores indicate a relative preference for choices from the disadvantageous decks. A total net score of <10 was established by Bechara, Dolan, Denburg, Hindes, Anderson, and Nathan (Reference Bechara, Dolan, Denburg, Hindes, Anderson and Nathan2001) as the threshold for impaired performance on the IGT, given the maximum net score achieved by VmPFC patients was <10. Analysis of IGT performance by blocks of 20 cards (blocks 1–5) provides an index of learning and strategy used by participants across the trials.
A mixed factorial analysis of covariance (ANCOVA) between the comparison, AN, BN, and obese groups compared differences on IGT global net scores, while a 4 (group) × 5 (block) repeated measures ANCOVA was carried out to examine group differences in block net scores. Post hoc analysis was conducted using the Sidak adjustment for multiple comparisons.
RESULTS
Sample Characteristics
The demographic profile of female participants is summarized in Table 1. There were significant differences between the groups in BMI (F(3,74) = 63.76; p < .001), with the obese and BN groups significantly higher than the AN or comparison group, and in age (F(3,74) = 36.48; p < .001) due to the older age of the obese group. Age was therefore entered as a covariate in all analyses. Ten obese participants (55%) had received bariatric surgery; as there were no significant differences between these participants and the nonbariatric surgery group on global net or block net scores, results are presented for the entire obese group.
Clinical Demographic Profile of Participants

BMI = Body Mass Index;
a,b,cDifferent superscript indicates significant differences between means.
Global Net Scores
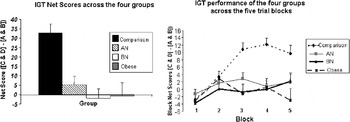
The mean net scores for each group are presented in Figure 1 (left panel). Controlling for age, there was a significant difference on IGT global net score (F(3,73) = 11.06; p < .001). Post hoc analysis revealed the comparison group was significantly different to the AN (p < .001), BN (p < .001), and obese groups (p = .004); however, the three clinical groups were not significantly different from each other.
(Left Panel) Mean net scores ([C&D – A&B]) for each group. (Right Panel) Mean net scores ([C&D – A&B]) for blocks 1 – 5 for each group. Positive scores reflect advantageous performance while negative scores reflect disadvantageous performance. Errors bars are standard errors.

Block Net Scores
The mean block net scores for each group are presented in Figure 1 (right panel). Controlling for age, there was a significant main effect for Group (F(3,73) = 12.06; p < .001), but not for Block (F(3.49,254.97) = 0.26; p = .88), and a significant Group × Block interaction (F(10.48,254.97) = 3.23; p < .001). Post hoc analysis revealed no significant group differences at blocks 1 and 2. However, the comparison group was significantly different to the AN, BN and obese groups at blocks 3 (p < .01) and 4 (p < .01), and from the AN (p < .05) and obese (p < .05) groups only at block 5. The three clinical groups were not significantly different from each other in any block.
IGT Impairment
Sixty-one percent of AN, 77% of BN, and 72% of obese participants met the threshold (IGT<10) for impairment on the task (Bechara et al., Reference Bechara, Dolan, Denburg, Hindes, Anderson and Nathan2001). By contrast, only 15% of the comparison group fell within this range.
DISCUSSION
All three clinical groups were significantly impaired on the IGT relative to the comparison group. The majority of participants within the clinical groups reached the threshold for impairment on the IGT (although the clinical utility of this cutoff remains to be established). However, the clinical groups were not significantly different from each other, providing evidence of a possible shared inability to modulate reward and punishment in a long-term perspective among females with disordered eating. The IGT is a complex task that taps many aspects of decision making; several possible explanations for this shared decision making profile are discussed.
As the clinical groups did not perform within the negative range on the IGT (as in VmPFC patients), this indicates that they were somewhat sensitive to punishment; consequently their performance deficit may lie in faulty reward processing. The relatively flat learning curves of the three clinical groups (Figure 1) suggest that they could neither maximize an immediate reward (by choosing the disadvantageous decks) or a delayed reward (by choosing the advantageous decks). This may indicate learned helplessness (Hiroto & Seligman, Reference Hiroto and Seligman1975). An expectancy that the task is uncontrollable, with responding unrelated to reinforcement, may account for the flat performance of the clinical groups and may mimic their attempts to ameliorate pathological eating behaviors. For the obese group who showed a decline in performance over the last 20 trials (unlike the AN and BN groups who showed modest improvements from blocks 4 to 5), the task may mirror a likely long-standing pattern of failed weight loss attempts.
Unlike the comparison group who began to select more cards from the advantageous decks and less from the disadvantageous decks by the second block, the three clinical groups failed to learn across the task. As normal performance on the IGT appears to require reversal learning, in that the fixed card order induces an initial preference for the ultimately riskier decks (due to higher initial gains on these decks), this may provide an alternative explanation for the shared deficits in the female eating disordered groups. Imitating the choices on the IGT, individuals with pathological eating behavior have to learn to reverse behaviors that may once have been highly rewarding (e.g., dieting in AN, binging in BN, and overeating palatable foods in obesity) but ultimately bring higher costs in terms of deleterious physical and psychological outcomes. Therefore, reversal learning deficits present a viable explanation for the shared decision making profile and inability to learn in the three clinical groups on the IGT. In a shuffle variant of the IGT wherein the card order was changed, eliminating the need for reversal learning, Fellows and Farah (Reference Fellows and Farah2005) found the performance of VmPFC patients improved to control levels. Future testing of the three clinical groups on this variant measure would inform this reversal learning hypothesis.
Impaired IGT performance among the three female pathological eating groups highlights the importance of adaptive decision making for successful self-regulation of eating behavior. However, following previous work with substance dependent individuals (Bechara & Damasio, Reference Bechara and Damasio2002) use of both the original and variant IGT (in which the schedules of reward and punishment are reversed so that punishment is immediate and reward is delayed) in AN, BN, and obesity would allow differentiation of the nature of this deficit; specifically, whether it is attributable to hypersensitivity to reward, insensitivity to punishment, or a general “myopia” for future consequences (positive and negative) with behavior guided by immediate prospects.
Limitations and Future Research
The obese group was significantly older than the AN, BN, and comparison group; however, this was controlled for statistically and research suggests that the capacity for adaptive self-regulation is a relatively stable disposition throughout the lifespan (Davis et al., Reference Davis, Patte, Curtis and Reid2010). Future research should take into account factors that were not controlled for here, such as illness duration, IQ, psychopathology, impulsivity, and medication use, which may impact upon IGT performance. Furthermore, the results are generalizable to females only and sample sizes were small, consequently replication with a larger group including males is desirable. Future research should also investigate whether interventions could improve IGT decision making capacity (in terms of the ability to modulate reward and punishment in a long-term perspective) and to assess subsequent impact on psychological and physical outcomes.
CONCLUSION
Females with AN, BN, and obesity were significantly impaired on the IGT with reference to a comparison group on both overall task performance and learning across the task. The three clinical groups did not differ significantly from each other, indicating that IGT performance may represent a common neuropsychological correlate of the patients’ deficient eating behavior.
ACKNOWLEDGMENTS
The information in this manuscript, and the manuscript itself, has never been published electronically or in print. This research was supported by the Irish Research Council for the Humanities and Social Sciences (IRCHSS).