1. INTRODUCTION
For safety-critical applications of global navigation satellite systems (GNSSs), such as aircraft and missile navigation systems, it is important to be able to detect and exclude faults that could adversely affect accuracy and integrity so that the navigation system can operate continuously without any degradation in performance. For high-accuracy systems, the fault detection and exclusion (FDE) function needs to be able to detect and exclude smaller and multiple biases. Because it is difficult to detect small errors and simultaneous multiple faults using the conventional snapshot receiver autonomous integrity-monitoring (RAIM) algorithms, various filtering methods have been studied to reduce the measurement noise level or to integrate a GNSS with other sensors, so that the navigation system can estimate its position more accurately and reliably. Because filters reduce the noise level of measurements using previous information, they can provide a better integrity-monitoring performance than snapshot algorithms. Moreover, a filtering method can calculate measurement residuals individually, so that it can detect simultaneous multiple faults and exclude faulty measurements more easily than conventional RAIM algorithm. However, because most filters, such as Kalman filters, presume that the measurement error and disturbance follow a Gaussian distribution, their performance can degrade if this assumption is wrong. Because the GNSS measurement error does not follow a Gaussian distribution perfectly, the Kalman filter approach has to use an inaccurate error model that may cause performance degradation.
To address this problem, we propose a new integrity-monitoring algorithm using Gaussian sum filters. It is known that Gaussian sum filters and particle filters have an almost identical GNSS integrity-monitoring performance (Yun et al., Reference Yun, Kim and Kee2006). However, particle filters need high computational power and are therefore difficult to implement in real time systems. A Gaussian sum filter is proposed as an alternative to the particle filter method. Gaussian sum filters have been researched over the last few decades as an alternative for solving nonlinear/non-Gaussian problems (Daniel and Sorenson, Reference Alspach and Sorenson1972; Fruhwirth, Reference Fruhwirth1997). The proposed algorithm estimates the distribution of measurement residuals individually from the posterior density and detects exceedingly large residuals to satisfy a false alarm rate. This algorithm can detect faults based on accurate estimation of the individual posterior distribution and can detect and exclude faults almost simultaneously so that the system can exclude a faulty measurement easily. With a non-Gaussian measurement error, a Gaussian sum filter can estimate the distribution of the state more accurately than a Kalman filter and therefore has better integrity-monitoring performance. In addition, if the system is nonlinear, the performance will also be better. Gaussian sum filters for nonlinear systems have undergone much research (Hanebeck et al., Reference Hanebeck, Briechle and Rauh2003), but the advantage of these filters with a non-Gaussian error distribution has not been investigated. Therefore, our work focused on the effect of a non-Gaussian error distribution of the DGNSS measurement on the integrity-monitoring performance, which was assessed by simulation. The proposed algorithm was implemented in a WADGPS system with three conventional integrity-monitoring algorithms and its performance was evaluated by comparison with other algorithms. We implemented four integrity-monitoring algorithms in this work: the snapshot χ2 method (SSX2), the Kalman filter χ2 method (KFX2), the Kalman filter individual residual (KFIR) method, and the Gaussian sum filter individual residual (GSFIR) method. Our proposed algorithm for the integrity monitor function based on the Gaussian sum filter is described in sections 4 and 5 and the other methods will be treated briefly.
2. DGNSS PSEUDORANGE ERROR MODEL
This section and the next describe the true error model and the sigma overbounding method, which are based on the work of Shively and Braff (Reference Shively and Braff2000).
In most GNSS applications, including the Space-Based Augmentation System (SBAS) and the Ground-Based Augmentation System (GBAS), the pseudorange measurement error is assumed to follow a Gaussian distribution. However, this is not true. In general, the core part of the error distribution can be characterized well using a Gaussian distribution, but the tail part of the distribution is heavier than that of a Gaussian distribution. The heavier tail is due to ground-reflected multipaths or to systematic receiver/antenna errors (Sayim et al., Reference Sayim, Pervan, Pullen and Enge2002). This type of distribution can be represented by a Gaussian core-Laplacian tail (GCLT) probability density function (PDF). In this paper, we take the GCLT model as the receiver's true error distribution to simulate a heavy-tailed model:
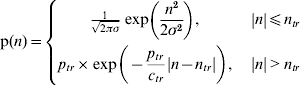
where n tr=2·58σ is the transition point from the Gaussian to the Laplacian distribution. The other constants are defined as follows:

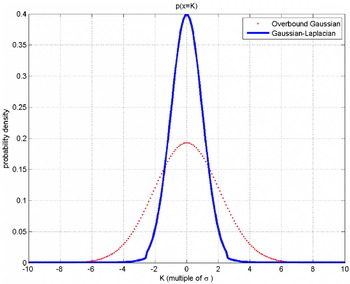
PUF and TUF provide confidence in consideration of the volume of data. The narrower curve shown in Figure 1 represents the PDF.
The Gaussian–Laplacian model and the Gaussian overbound model.

3. SIGMA OVERBOUNDING
Because the measurement error does not follow a Gaussian distribution, sigma overbounding methods are used to simplify implementation and to prevent integrity risks (Shively and Braff, Reference Shively and Braff2000; Rife et al., Reference Rife, Pullen and Pervan2004). Overbounding is a procedure used to find the inflation factors, which are the ratio of the overbounded and the observed sigmas.

The inflation factor is determined using equation (4):

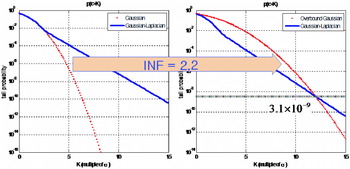
where ptrue (x) is the observed true PDF, which was taken to represent the GCLT distribution in our work. The denominator value of 5·95 is a multiplier used for SBAS users to calculate a defined fault-free protection level (RTCA, 2001). This method provides users with an overbound broadcast sigma that they can use to estimate the fault-free protection levels to bound position errors with the required probability. Figure 2 shows a pictorial representation of this method, which shows that the one-sided tail probabilities of the Gaussian and the GCLT distributions have the same observed standard deviation. Figure 1 shows the PDF values of the true error model (GCLT) and the overbounded Gaussian (OG) model. The OG model had a broader distribution, so that the tail was conservative enough to bound the heavy-tailed GCLT model. This method can satisfy integrity performance, however its residual distribution is so conservative that it calculates a protection level (PL) that is too large. The system compares the value of the PL to a predefined alert limit (AL) for an expected operation, for example, precision approach, non-precision approach and enroute, to decide whether or not the navigation system will use the solution. If PL is larger than AL, the system will not use the solution for reasons of safety, therefore the availability of the system can be degraded. To address this problem we propose a new integrity-monitoring algorithm using the Gaussian sum filter.
Set inflation factor.

4. GAUSSIAN SUM FILTER
We can approximately express an arbitrary PDF with a weighted sum of Gaussian distributions, which is called a Gaussian mixture model (GMM). When we assume that the measurement error follows the model, we can use several parallel Kalman filters that deal with each Gaussian component to estimate the distribution of states more accurately. This method is called a Gaussian sum filter (Fruhwirth, Reference Fruhwirth1997).
First, let us assume that a j-th measurement error distribution can be expressed by a sum of N comp Gaussian distributions:

where 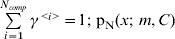 : Gaussian probability density of x, m is mean, C is variance;
 : i-th component of Gaussian mixture model.
If we assume that all N M measurements are independent, a distribution of the measurement vector is obtained by the following equation:

and it can be expressed by a sum of multivariate normal distributions:

where N mode is the number of mode,  .
With this measurement error distribution, we implement the Kalman filters for every Gaussian component. First, after time propagation using equation (8), the GSF has the prior distribution as equation (9):


where:
 : predicted state vector at time k
- : measurement updated state vector at time k
- : measurement set up to time k
Fk: state transition model which is applied to the previous state xk−1.
P: estimation error covariance matrix
Q: process noise covariance matrix
 : predicted state vector at time k
 : measurement updated state vector at time k
 : measurement set up to time k

From equation (7), the measurement distribution at the current epoch is:

where H is the observation matrix, R is the observation noise covariance matrix.
GSF updates the weights of the Gaussian components, the states and the covariance matrix by using equations (11–13):

where 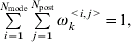 ,


Now we have the estimation of the current states as follows.

5. INTEGRITY-MONITORING ALGORITHMS
GNSS-based navigation systems must have an integrity-monitoring system that contains two main functions: 1) detection and exclusion of satellite faults and 2) estimation of the uncertainty of the position solutions. First, the system calculates decision variables and compares these to thresholds that have been set to satisfy the integrity requirements for the desired operation. If any decision variable exceeds the threshold, the system concludes that the corresponding measurement has a fault, and excludes the detected fault. Second, because the system cannot know the true position estimation errors, it estimates the uncertainty of the solution, which is known as the protection level.
5.1. Fault Detection and Exclusion
The proposed algorithm is a residual method that uses the posterior density of a state, which is estimated from the filters and the measurement error distribution. A residual is defined as the difference between an expected and an actual measurement, which will be described in detail in the following subsections. Residual methods using the snapshot algorithm (SSX2) and the Kalman filter (KFX2) calculate the decision variables using the squared sum of the residuals, which is known as the weighted squared sum of the error (WSSE) that follows a χ2 distribution whose degrees of freedom are determined by the number of measurements, as in equation (19).

This type of algorithm can be found in literature (Parkinson and Axelrad, Reference Parkinson and Axelrad1988; McGraw et al., Reference McGraw, Murphy, Brenner, Pullen and Van Dierendonck2000).
The filtering approaches can examine the individual residuals, but not the combined one, because they have a previously estimated position. In the KFIR, the algorithm compares a measurement residual to the multiple of the residual standard deviation. Because our proposed method, GSFIR, assumes a non-Gaussian error, it does not use the residual standard deviation. Instead, it estimates the residual distribution, and then decides whether the residual is located in a normal region or not. These individual residual algorithms have to estimate the residual distribution and determine the individual detection threshold for each residual.
The expected measurement was calculated from the propagation of the previous epoch's state vector as:

The expected measurement is a projection of the propagated state from the position domain to the measurement domain. Under normal conditions, the expected and the actual measurement distributions lie close to each other but when there is a measurement fault they are separated by a distance. In our work the distance between the two measurements is referred to as the residual.

The Gaussian sum filter has the residual components:

the associated weights:

and the covariances:

Therefore, the residual distribution from the Gaussian sum filter is expressed as follows:

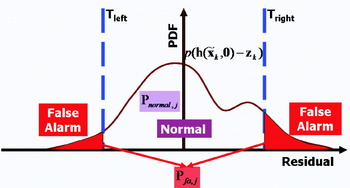
A sample of a residual distribution under nominal conditions is shown in Figure 3. The expectation is near zero, and the large residuals have low probabilities. When the residual is in the region between the two thresholds, known as the normal region, the system declares that there is no fault in the measurement. Otherwise, it determines the measurement as having a fault, and excludes it for continuous operation.
PDF of a residual and thresholds.

In real implementation, the expectation of the PDF is located at the calculated residual and not at zero. Therefore, we calculate a one-sided tail probability below or above zero as a decision variable using equation (22) and compare it with the individual false alarm rate that will be defined in the next subsection for each measurement.
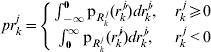
Because the KFIR method assumes a Gaussian error, the PDFs are all Gaussian and the residual distribution can be expressed simply by a standard deviation, so that the thresholds are determined as the multiples of the standard deviations. The threshold is set to satisfy a specified false alarm rate when a χ2 method based on the Gaussian distribution, SSX2 or KFX2, is employed.
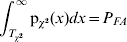
However, the individual residual test requires a threshold for each measurement and therefore an individual false alarm rate, p fa, needs to be determined first. We used the multivariate normal distribution and the residual covariance matrix estimated from the Kalman filter, and assuming that the individual false alarm rates for all residuals are the same, we have the following equation:

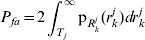
where  . Because K is the only unknown in this equation, we can calculate it by iteration. With the determined K, the individual false alarm rate is calculated as follows:

Because in Section 2 we assumed that the measurement error followed a symmetrical distribution, the proposed algorithms declare a fault present if a one-sided tail probability of a residual  exceeded the value of P fa/2.
5.2. Protection Level
SBAS users must calculate both fault-free and faulted protection levels (XPL 0 and XPL 1, respectively). The faulted protection levels indicate the position error protection assuming that a fault measurement exists. SBAS assumes that a fault is induced from the reference receiver errors. However, we assumed that the fault includes all possible errors contained in the measurements that are used for position estimation. The formulas used to calculate the protection levels based on a snapshot method assuming a Gaussian error were derived as follows. (The Kalman filter and the proposed filtering methods can obtain the protection levels using a similar procedure, which will be discussed later).
In GNSSs, the measurement equation can be expressed using the linear function:

The state vector is estimated using the weighted least squares method and the estimation error can be obtained from equation (27):

where 
When a fault T occurs in measurement j, the protection levels are calculated using the following equations:


where  and k md=3.29
The standard deviation multipliers, k ffmd,h, k ffmd,ν, and k md, are defined in WAAS MOPS (RTCA, 2001). The value of the fault T is equal to the threshold for each FDE algorithm because it is the maximum fault that the system cannot detect. The filtering methods can estimate the protection levels with the above procedure, however, the values of XPL n and XPL bj are determined differently for each algorithm. The Kalman filter method can obtain the standard deviations, σh and σv, from the estimated covariance matrix and T j is calculated from the residual standard deviation and the individual false alarm rate. The Gaussian sum filter methods can estimate them from the estimated posterior density and the residual density, respectively as follows:

6. SIMULATION
In this section, the proposed algorithm is verified by performing a real time test. For the real time test, the proposed algorithm was implemented in the user system of Korean WADGPS Test Bed (KWTB) (Kim et al., Reference Kim, Yun, Park, Jeon, Sohn and Kee2006).
6.1. Simulation Setup
A Trimble 4000ssi receiver with a quartz crystal oscillator (Trimble, 1996) was used for the user system. The state variable was as follows:

The propagation matrix is defined as in equation (33).

Δt is the sampling time (1 s).
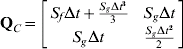
In the process noise covariance matrix Q, the elements associated with user position are set to be a very small value, close to 0, because the user does not move in this test.

The elements associated with clock error are represented as in equation (35) (Brown and Hwang, Reference Brown and Hwang1997).
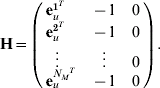
Because the element describing the clock drift was added in the state vector, the measurement matrix H was also edited as follows:
6.2. Analysis of Pseudorange Error and Error Modelling
In order to find the pseudorange error distribution of the WAD correction data, we saved the pseudorange error after applying the WAD correction. The error level is set to be 3·09σ, because 3·09σ includes 99·9% of the random variable in Gaussian distribution. According to SBAS requirement, all of these correction errors must be smaller than this error level.
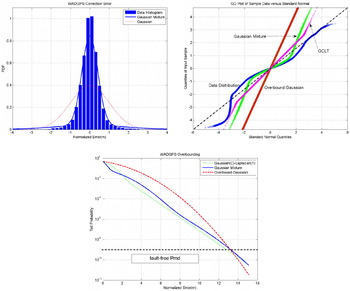
The histogram in Figure 4 (Top left) shows the probability density of the correction error collected in 3 wide-area reference stations (WRS). As expected, the correction error distribution is similar to the Gaussian distribution, but it has a heavier tail. The presented Gaussian distribution has a standard deviation that has been calculated from correction data that is UDRE and GIVE.
KWTB correction error. Top left – Probability density function; Top right – QQ-plot; Bottom – Sigma overbound.

In order to perform integrity monitoring with the filtering algorithm, an error model needs to be set up. Figure 4 (Top right) is a Quantile–Quantile (QQ) plot of the collected correction error distribution. This figure shows that the distribution becomes more Gaussian-like as it gets closer to a straight line, and a larger slope means a larger standard deviation. The collected data distribution is Gaussian-like between −2 and 2. However, outside of that interval it is different from Gaussian distribution. Thus the error model has to be expressed as a Gaussian mixture model. It is hard to determine the precise tail distribution because of the limited number of data. Therefore, the tail distribution of the error model is set to follow the tail distribution of the GCLT model, so that the error model follows data distribution in the core, and the GCLT model in the tail. In Figure 4 (Top right), the Gaussian mixture model follows the collected data in the interval of −1·7~1·7, and the GCLT model outside the interval, and bounds collected data in whole interval.
The simulation sets PUF=0·52 and TUF=1 in equation (2) to follow the convoluted three-receiver error model. The standard deviation of overbounded Gaussian distribution was calculated as in equations (3) and (4). The calculated inflation factor was 2·2, and the chosen coefficients of the Gaussian mixture model are in equation (38). As this model is applied, Figure 4 (Bottom) shows the GCLT model, the Gaussian mixture model and the overbounded Gaussian model using the inflation factor.

6.3. Real-time Test
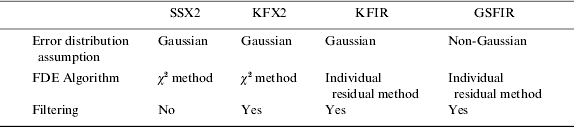
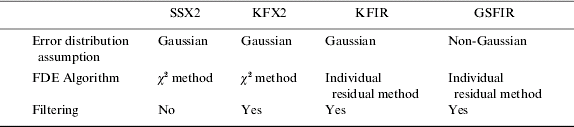
A simulation was performed to assess our proposed integrity monitoring algorithms based on the Gaussian sum filter. To investigate the advantage of the non-Gaussian assumption, three conventional methods using the Gaussian assumption were also implemented in parallel. These methods are shown in Table 1.
Four methods implemented in simulation.
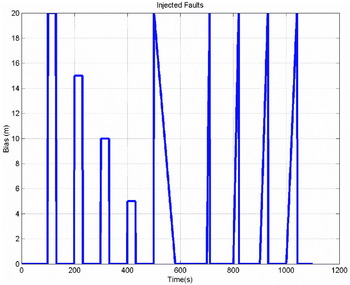
To evaluate the integrity-monitoring performance we injected bias into the pseudorange, as in Figure 5. The first four biases were injected as step shape in order to evaluate the integrity performance to a sudden system fault. After that, decreasing bias was injected to find what bias size each algorithm could detect. Four increasing biases with different slopes were injected, so that we could find out how it copes with diverging error. This fault scenario takes about 1000 s to complete.
Fault scenario.

6.4. Measurement Domain Results
In this section we assess the suitability of each method for each bias type. The decision variable is calculated and compared with the threshold to determine whether there is a fault or not. If it is declared that a fault exists, the number of fault measurements needs to be verified. If the method finds that there are two or more fault measurements, it has failed to detect and exclude the fault, because we injected bias into only one measurement. Lastly, position error and protection level are verified, so that we can estimate the user performance.
Fault scenario 1 – step bias
SSX2 and KFX2 succeed in detecting the first two biases, at 20 and 15 m, but cannot detect a bias of 5 and 10 m at all. In the case of the 15 m bias, SSX2 could detect the fault but a false alarm occurred because it determined that two measurements were faulty. KFIR detected and excluded the 20 and 15 m biases successfully, but detected the 10 m bias only in 2 epochs. GSFIR detected and excluded 20, 15, and 10 m biases well. No method could detect the 5 m bias.
Fault scenario 2 – decreasing bias
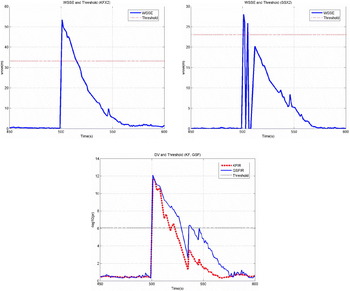
As shown in Figure 6, SSX2 detected faults in the first few epochs, and KFX2 detected faults until 15 s. After excluding a faulty measurement, if the number of measurements that remained normal is less than four, the position cannot be calculated and if less than five, the decision variable cannot be calculated. The number of visible satellites during this test is six or seven and we injected bias into one measurement, therefore the parts for which the decision variable equals to zero are those in which a normal measurement is declared as faulty. KFIR succeeded in detecting fault until 17 s, failed to detect in one epoch and detected again until 22 s. GSFIR detected until 26 s, failed to detect in a few epochs and detected again until 38 s. Through this result the minimum detectable bias of each method can be calculated, as shown in Table 2. As expected GSFIR detected the smallest bias.
Decision variables and threshold: Top left – KFX2; Top right – SSX2; Bottom – KFIR and GSFIR.

Minimum detectable bias for each method.

Fault scenario 3 – increasing bias
Each method begins to detect the ramp failure at the time indicated in Table 3. Also, in this fault scenario GSFIR can detect the smallest bias and can detect fault most quickly.
The time required to detect ramp failure.

6.5. Position Domain Results
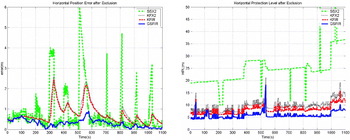
Figure 7 shows the horizontal position error and protection level after exclusion. The GSFIR method can detect and exclude the highest number of faults therefore it has the smallest error level. The GSFIR method provides the smallest protection level, as expected. Table 4 shows the numerical values of this result. The horizontal and vertical protection levels of GSFIR are, respectively, 30% and 35% smaller than those of KFIR.
Horizontal position error and protection level after exclusion.

Position error and protection level after exclusion.

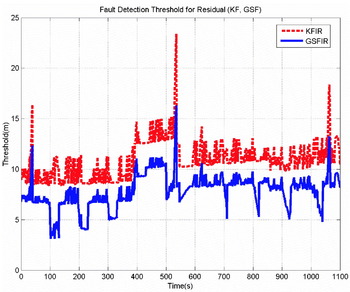
Figure 8 shows the fault detection threshold for the residuals of KFIR and GSFIR that affect directly the performance of fault detection and the decision of protection level. As shown in Table 5, the threshold of the GSFIR method is about 3 m smaller than that of KFIR. Therefore, GSFIR can cope with a smaller bias and also can provide a smaller protection level.
Fault detection threshold for residual.

Average of fault detection threshold for residual.

Under the assumption that the system is used in aircraft navigation, the availability was calculated as applied in APV-II (Approaches with vertical guidance II) and the CAT-I (Category I) precision approach. As seen in Table 6, for APV-II, all filtering methods have a very high availability; in this case there is little difference between KFIR and GSFIR. However, when applied to the stricter requirements of CAT-I, GSFIR was superior to other methods. The availability of KFIR is 50% higher than that of KFX2, and that of GSFIR is 35% higher than that of KFIR. It can be said that although the difference in error distribution is very small, it is very critical at strict requirement.
Availability of each method.

6.6. Result Analysis
The reason that the GSFIR method outperformed other methods can be explained as follows.
The SSX2 data showed the worst performance due to the high noise level, which is straightforward to understand. The KFX2 and KFIR methods use the same filtering procedures, but have different decision variables: WSSE and individual residuals, respectively. For a fixed false alarm rate, the χ2 method has a larger threshold, because it needs to consider the noise of the other fault-free measurements contained within the WSSE calculations. In contrast, because the individual methods only consider a single residual at a time, they have smaller thresholds. This difference is responsible for the better detection performance and availability of the KFIR method.
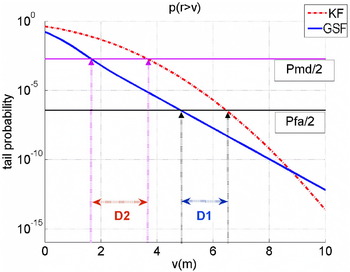
The KFIR and GSFIR methods use the same FDE algorithm, but they use the overbounded Gaussian and non-Gaussian error model, respectively. The impact of the different error models can be described as follows. In equations (28) and (29), the important factors are the detection threshold, T, and the position error noise, VPL n. When T is small, the system can detect smaller biases and smaller values of T and VPL n lead to lower protection levels that result in higher availability. Figure 9 shows the one-sided tail probability of the residuals of the KFIR method (dotted) and the GSFIR method (solid). The fault detection threshold is the residual at which the tail probability is equal to Pfa/2, as defined previously. In Figure 9, the thresholds for the KFIR and GSFIR methods differ by D1, due to the overbounding effect, and the difference of the residual values at which the tail probabilities were equal to the missed detection rate caused the discrepancy in the noise part. A projection of the difference, D2, to the position domain is shown as the protection level difference.


Equations (39) and (40) show that the GSFIR method has a smaller minimum detectable bias and both equations indicate that the GSFIR method has smaller protection levels.
The effect of the overbounded sigma.

7. CONCLUSIONS
In this work, we have developed an integrity-monitoring algorithm that tests measurement residuals individually using a Gaussian sum filter. The simulation results showed that our proposed algorithm detected smaller measurement biases and generated protection levels smaller by about 35%, which implies that systems with the algorithm can provide better integrity-monitoring performance than other methods that assume an overbounded Gaussian measurement. The data show that the conservative sigma overbounding methods degrade the integrity-monitoring performance. Inversely, using a true error model or more accurate overbounding methods, systems can be more available without loss of integrity or continuity.
Although our proposed algorithm requires a high computational capacity, the real time process was possible by using a conventional PC. Therefore it can be used in many sophisticated systems such as airliners, military aircraft, GNSS reference stations, etc. Moreover it can be used for development and performance assessment of sigma overbounding methods in conventional systems.
In the future, more computationally efficient algorithms need to be developed for our method to be widely used. In addition, because our algorithm tests the residuals individually, it can be used to detect simultaneous multiple faults, which is another interesting topic for future research.
ACKNOWLEDGMENTS
This research was supported in part by the Institute of Advanced Machinery and Design, Institute of Advanced Aerospace Technology at Seoul National University, and the BK-21.