INTRODUCTION
Cassava (Manihot esculenta Crantz) is one of the most important root crops in the world (FAO 2014). Thailand is ranked fourth among the world cassava producers after Nigeria, Brazil and Indonesia. Cassava root yield in Thailand increased from 1999 to 2009, decreased slightly in 2010 and then increased until 2013 (FAO 2014). In Thailand, most cassava roots are used to produce cassava starch, flour, chips and pellets for export, which enables Thailand to be the largest exporter of cassava products (Onwueme Reference Onwueme, Hillocks, Thresh and Bellotti2002), producing income of about US$2300 million (Office of Agricultural Economics, http://www.oae.go.th, verified 1 December 2013). In order to maintain leadership among cassava exporters, fresh root yield and starch content are the most important traits for cassava breeding in Thailand.
Quantitative trait loci (QTL) analysis is a powerful tool for identifying the location of genomic regions controlling quantitative traits based on an association between marker genotypes and trait values (Kearsey Reference Kearsey1998). Quantitative trait loci associated with root yield-related production in cassava have been reported in several studies. In Africa, QTL affecting early root growth were identified from an F 1 population (Okogbenin & Fregene Reference Okogbenin and Fregene2002), and QTL controlling root productivity and plant architecture (Okogbenin & Fregene Reference Okogbenin and Fregene2003) and root dry matter and cyanogen content (Balyejusa Kizito et al. Reference Balyejusa Kizito, Rönnberg-Wästljung, Egwang, Gullberg, Fregene and Westerbergh2007) were reported in an F 1 full-sib cross. Moreover, an F 2 population was later used to identify QTL for components of early root yield (Okogbenin et al. Reference Okogbenin, Marin and Fregene2008). In addition, QTL controlling plant and first branch height, which were associated with root yield in Thailand, was reported by Boonchanawiwat et al. (Reference Boonchanawiwat, Sraphet, Boonseng, Lightfoot and Triwitayakorn2011). Recently, QTL controlling cyanogen content (Whankaew et al. Reference Whankaew, Poopear, Kanjanawattanawong, Tangphatsornruang, Boonseng, Lightfoot and Triwitayakorn2011), fresh weight root yield, root dry matter content, root starch content in China (Chen et al. Reference Chen, Fu, Xia, Jie, Wang, Lu and Wang2012) and starch pasting viscosity in Thailand (Thanyasiriwat et al. Reference Thanyasiriwat, Sraphet, Whankaew, Boonseng, Bao, Lightfoot, Tangphatsornruang and Triwitayakorn2014) have been identified using F 1 cassava populations.
Quantitative trait loci controlling traits of interest will be useful for molecular breeding in cassava through marker assisted selection (MAS) for developing new cassava varieties with high yield and starch content and for identification of candidate genes controlling the traits of interest. The current study therefore aimed to identify QTL controlling fresh root yield and fresh starch content from an F 1 mapping population derived from a cross between ‘Huay Bong 60’ and ‘Hanatee’ and to annotate putative candidate genes based on QTL regions using the cassava database from the Phytozome Plant Genomics Resource (Available online from http://www.phytozome.net/cassava, verified 21 June 2016).
MATERIALS AND METHODS
Plant materials
The F 1 mapping population of 100 individuals was developed by a cross of Huay Bong 60 (HB60, as female parent) and Hanatee (HN, as male parent) in 2006 as described by Sraphet et al. (Reference Sraphet, Boonchanawiwat, Thanyasiriwat, Boonseng, Tabata, Sasamoto, Shirasawa, Isobe, Lightfoot, Tangphatsornruang and Triwitayakorn2011). Each individual line was planted by stem cutting at the Rayong Field Crops Research Center, Department of Agriculture, Rayong, Thailand in May 2008, 2009 and 2010, and at Lop Buri Crops and Production Resources Technical Service Center, Department of Agriculture, Lop Buri, Thailand in April 2008 with two replications at each location. The two locations had different soil types, clay loam in Rayong and black clay soil in Lop Buri. Total rainfall (mm) at Rayong in 2008, 2009 and 2010 was 1201·2, 1527·6 and 1716·1, respectively while at Lop Buri in 2008 it was 1473·2 (Meteorological Department, Ministry of Information and Communication Technology, http://service.nso.go.th/nso/web/statseries/statseries27.html, verified 26 April 2015). Extreme minimum/maximum temperatures (°C) were 18·8/34·7, 16·3/34·7 and 19·5/35·1 at Rayong in 2008, 2009 and 2010 and 16·3/38·2 at Lop Buri in 2008.
Plots were 4 × 10 m2 with 1 m between the rows and 1 m between individual plants in each row. One month after planting (MAP), 312·5 kg/ha fertilizer (nitrogen (N) : phosphorus (P) : potassium (K); 15:15:15) and 3100 kg/ha chicken manure were applied. Pest management was applied as necessary once any sign or symptom was observed.
Assessment of phenotypic traits
Phenotypic data on fresh root yield and starch content were evaluated at 12 MAP based on ten plants per line in 2009, 2010 and 2011 from Rayong Field Crops Research Center, and in 2009 from Lop Buri Crops and Production Resources Technical Service Center. Fresh root yield data were measured by collecting cassava roots from ten plants in the plot. All root samples of each line were shaken to remove soil and debris, and weighed using a mechanical pedestal spring balance (T O Scale Industry Co., Ltd., Bangkok, Thailand). The fresh root yield data (kg/rai; ‘rai’ is a Thai unit equal to 1600 m2) were converted into tonnes/hectare (t/ha; 6·25 rai = 1 ha). Starch content (% (w/w)) of cassava was measured using a Riemann™ balance (Thai Sang Metric Co., Ltd, Bangkok, Thailand) (Bainbridge et al. Reference Bainbridge, Tomlins, Wellings and Westby1996). Clean cassava roots (5 kg) were collected randomly from ten plants per plot and weighed in air and in water. Starch content was recorded directly from the Riemann balance. The average value within two replications of the trait at each location was calculated.
Statistical analysis
The statistical analyses including analysis of variance (ANOVA) of fresh root yield and starch content were carried out using SPSS version 17·0 (SPSS 2008). Correlations of both traits were tested in four different environments with a Pearson correlation test. Broad-sense heritability (
 $h_{\rm b}^2 $
) was computed using the following formula:
 $$h_{\rm b}^2 = \displaystyle{{\sigma _\alpha ^2} \over {\sigma ^2 + \sigma _\alpha ^2}}$$
where
 $\sigma _\alpha ^2 $
and σ
2 were the estimates of genetic and residual variance, respectively. Moreover,
 $\sigma _\alpha ^2 $
and σ
2 values were obtained from ANOVA results.
Quantitative trait loci analysis
The F 1 cassava genetic linkage map constructed by Sraphet et al. (Reference Sraphet, Boonchanawiwat, Thanyasiriwat, Boonseng, Tabata, Sasamoto, Shirasawa, Isobe, Lightfoot, Tangphatsornruang and Triwitayakorn2011) was integrated with phenotypic data in order to identify and locate QTL positions on the linkage map using MapQTL version 4.0 software (Van Ooijen et al. Reference Van Ooijen, Boer, Jansen and Maliepaard2002). The significant logarithm of odds (LOD) score threshold appropriate to declare a QTL significant was calculated by tests with 1000 permutations, which corresponded to a chromosome-wide (Pc ⩽ 0·05) and genome-wide LOD significance threshold of 5% (Pg ⩽ 0·05). Interval mapping (IM) was performed and genome-wide LOD significance threshold was used to declare a putative QTL. If there was no peak LOD score that exceeded the genome-wide LOD significance threshold, chromosome-wide significance thresholds were used to identify putative QTL. The closest markers at the highest LOD peak of each putative QTL were used as cofactors for the automatic cofactor selection option at P < 0·02 and significant marker cofactors were used in the restricted multiple-QTL model (rMQM) analysis. The closest marker to a new peak of a putative QTL was set as a new cofactor and automatic cofactor selection was reanalysed. If the LOD score of QTL with a cofactor dropped under the chromosome-wide LOD significance threshold, the dropped cofactor was removed from the list of cofactors. The rMQM was calculated until no new putative QTL was detected. Thereafter, the multiple-QTL model (MQM) analysis was executed to detect significant QTL using the stable set of cofactors from rMQM. The confidence region of the QTL position was drawn by Map Chart version 2.2 program (Voorrips Reference Voorrips2002) using 2-LOD support interval (Van Ooijen Reference Van Ooijen1992). A Kruskal–Wallis (KW) analysis, non-parametric test, was performed to determine the correlation between marker genotype data and significant phenotype trait and to confirm significant QTL detected by MQM.
Interactions among quantitative trait loci controlling root yield and starch content
The interactions between selected pairs of markers were tested by a two-way ANOVA using SPSS in order to determine additive and non-additive interactions between the unlinked QTL (Lark et al. Reference Lark, Chase, Adler, Mansur and Orf1995). Non-additive interactions between markers associated with the traits at P ⩾ 0·05 were excluded from the joint heritability analysis. All markers associated with the traits were analysed using multi-way ANOVA to estimate joint heritabilities for traits associated with multiple QTL. The model R 2 term in a multi-way ANOVA was used to determine joint heritability.
Gene annotation
The gene annotations within the identified QTL intervals were derived from BlastN searches against the cassava genome database in Phytozome v 9·1 (http://phytozome.net/search.php?show=blast&method=Org_Mesculenta) using the markers at the highest LOD peak of QTL as references. Functional annotations were made based on a Protein Families Database (PFAM), Protein Analysis Through Evolutionary Relationships (Panther), Eukaryotic Orthologous Groups (KOG), Enzyme Commission (EC) numbers, Gene Ontology (GO) and the Kyoto Encyclopedia of Genes and Genomes (KEGG).
RESULTS
Phenotypic evaluations
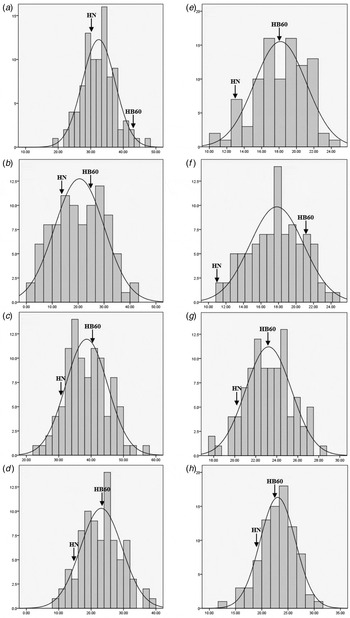
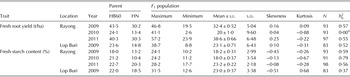
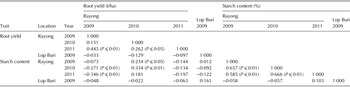
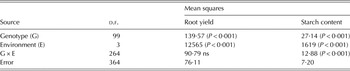
The descriptive statistical data of fresh root yield and starch content are shown in Table 1. Both traits of the F 1 population showed a normal distribution, except for starch content at Rayong in 2009. In addition, frequency distributions of the population at each environment showed skewness to either HB60 or HN and transgressive segregation of the F 1 population was also observed in all years (Fig. 1). Broad-sense heritability of fresh root yield and starch content ranged from 0·52 to 0·57 and 0·37 to 0·79, respectively. The correlations between and within root yield and starch content traits are given in Table 2 and the ANOVA results of both traits from four different environments are shown in Table 3.
Frequency distributions in the F 1 mapping population of root yield (YLD) at Rayong (a) 2009, (b) 2010 and HN, Hanatee; HB60, Huay Bong 60 (c) 2011 and Lop Buri 2009 (d) and starch content (ST) at Rayong (e) 2009, (f) 2010 and (g) 2011 and (h) Lop Buri 2009.

Phenotypic value of root yield and starch content of F1 mapping population

HN, Hanatee; HB60, Huay Bong 60
 $h_{\rm b}^2 $
, broad-sense heritability; n: showed negative broad sense heritability estimates.
Correlation analyses between and within root yield and starch content traits

Analysis variance of root yield and starch content in four environments

ns, not significant.
Quantitative trait loci underlying root yield
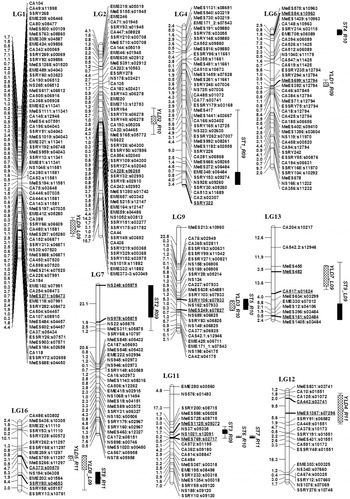
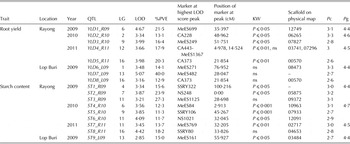
Eight QTL affecting fresh root yield were detected on seven linkage groups (Fig. 2). These QTL explained phenotypic variance that ranged from 12·9 to 40·0% with LOD values of 3·16–5·07 (Table 4). Of these, six QTL (YLD1_R09, YLD2_R10, YLD3_R10, YLD4_R11, YLD6_L09 and YLD7_L09) were identified at a specific environment and two QTL (YLD5_R11 and YLD8_L09) were found across two environments on linkage group 16 with no significant correlation between environments. Marker CA373 at QTL YLD5_R11 showed significance at P ⩽ 0·01 by KW.
Quantitative trait loci (QTL) specific to root yield (cross-hatching bar) and starch content (dark bar) in F 1 cassava population. The bar and whiskers represent QTL position with a 1-logarithm of the odds (LOD) and 2-LOD support intervals, respectively. The underlined markers are the closet marker at the highest LOD score peak.

Quantitative trait loci (QTL) controlling root yield and starch content in F1 population of cassava

LG, linkage group; LOD, logarithm of the odds; %PVE, the percentage of phenotypic variation explained by the QTL; KW, significance level of Kruskal–Wallis analysis; ns, not significant; Pc, chromosome-wide significant LOD threshold; Pg, genome-wide significant LOD threshold.
Quantitative trait loci underlying fresh starch content
A total of nine QTL that influenced fresh starch content with LOD values ranging from 2·85 to 4·42, explaining 11·3–27·3% of phenotypic variation were identified on seven linkage groups. Among these, six QTL (ST1_R09, ST2_R09, ST4_R10, ST5_R10, ST8_R11 and ST9_L09) were location specific and three QTL (ST3_R09, ST6_R10 and ST7_R11) were detected across three environments on linkage group 11. Of these QTL, the two closest markers, NS1021 (ST6_R10) and MeES769 (ST7_R11), were significant at P ⩽ 0·05 and P ⩽ 0·01, respectively. In addition, positive correlations among environments and traits were observed (Table 2).
Co-localization of quantitative trait loci between traits
Co-localization of QTL controlling both traits, with positive correlation (r = 0·334, P < 0·01) between traits, was found on linkage group 9 between YLD3_R10 (PVE = 16·4%) for fresh root yield and ST5_R10 (PVE = 11·3%) for starch content. The closest markers, MeES249 and SSRY106, showed significance for YLD3_R10 (P ⩽ 0·05) and for ST5_R10 (P ⩽ 0·001), respectively. In addition, co-localization between YLD8_LP09 and ST8_R11 and YLD7_L09 and ST9_L09 was observed, but with no correlation.
Interaction among quantitative trait loci
There were no significant interactions between pairs of markers for the fresh root yield trait. However, multi-way ANOVA showed that the QTL at Rayong 2010 and Lop Buri 2009 together accounted for 17·6 and 4·3% of the total variation, respectively. Together, the eight QTL across all locations explained up to 64·3% of the variation in root yield phenotype.
The QTL controlling starch content in Rayong 2009, Rayong 2010 and Rayong 2011 explained up to 40·2, 65·9 and 10·3% of the total variation, respectively. Moreover, the nine QTL across locations explained up to 28·3% of the total variation in starch content.
Gene annotation
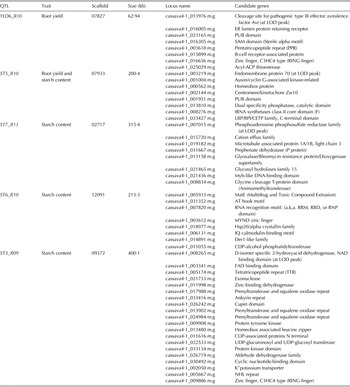
Quantitative trait loci underlying traits at the same region across years and locations were considered for identification of potential candidate genes. The consistent QTL on linkage group 11 for starch content showed positive correlation between ST3_R09 and ST6_R10 (r = 0·657, P < 0·01), ST6_R10 and ST7_R11 (r = 0·666, P < 0·01), and ST3_R09 and ST7_R11 (r = 0·585, P < 0·01). The highest LOD peaks of these QTL were located on scaffold09372 (ST3_R09), scaffold12091 (ST6_R10) and scaffold02717 (ST7_R11). Interestingly, confidence intervals of QTL controlling root yield (YLD3_R10) and starch content (ST5_R10) with a positive correlation (r = 0·334, P < 0·01) were found on scaffold07827 and scaffold07933. Candidate genes identified at the highest LOD peaks and their peripheries are shown in Table 5. A total of 52 candidate genes were analysed from five consistent QTL underlying both traits. Of these, eight genes were identified from co-localized QTL underlying root yield and starch content. Genes that were found near the highest LOD peak included those encoding: cleavage site enzyme for pathogenic type III effector avirulence factor Avr (scaffold07827); endomembrane protein 70 (scaffold07933); phosphoadenosine phosphosulphate reductase family (EC Number 1·8·4·9: scaffold02717); and D-isomer specific 2-hydroxyacid dehydrogenase NAD binding domain (EC 1·2·1·2: scaffold09372).
Candidate genes within QTL for root yield and starch content traits

DISCUSSION
In the current study, a cassava F 1 mapping population was used for QTL mapping. For cassava, F 1 populations have often been used for construction of genetic and QTL maps (Okogbenin & Fregene Reference Okogbenin and Fregene2002, Reference Okogbenin and Fregene2003; Okogbenin et al. Reference Okogbenin, Marin and Fregene2006). The use of F 1 populations is not common for QTL mapping because of limitations for the detection of recessive genes and epistatic interactions (Paterson et al. Reference Paterson, Damon, Hewitt, Zamir, Rabinowitch, Lincoln, Lander and Tanksley1991; Okogbenin et al. Reference Okogbenin, Marin and Fregene2006). However, F 1 population use was necessary in the current work because of the difficulty in developing populations of cassava. Difficulties include its out-crossing nature, time-consuming propagation, the high cost for measuring breeding traits and the small number of seeds produced (Kunkeaw et al. Reference Kunkeaw, Tangphatsornruang, Smith and Triwitayakorn2010). However, transgressive segregation was observed among the progeny for both traits, indicating that the variation in the population was sufficient for QTL analysis. Alleles from both parents contributed positively to both traits studied, which were therefore inferred to be controlled by multiple genes (Wang & Goldman Reference Wang and Goldman1997). Moreover, the moderate broad sense heritabilities of root yield and starch content inferred that these traits were strongly influenced by the environment (Song et al. Reference Song, Han, Teng, Sun and Li2010). Such traits are expected to be difficult to handle by direct selection (Ntawuruhunga & Dixon Reference Ntawuruhunga and Dixon2010).
In the current study, large numbers of QTL controlling both traits were identified, indicating that these traits are controlled by multiple genes (Okogbenin & Fregene Reference Okogbenin and Fregene2002). In addition, most QTL were major QTL, which explained >10% of phenotypic variance (Collard et al. Reference Collard, Jahufer, Brouwer and Pang2005).
The consistency of QTL for root yield (YLD5_R11 and YLD8_L09) and starch content (ST3_R09, ST6_R10 and ST7_R11) across years indicated the stability of QTL across years and locations. Quantitative trait loci with large effects and consistency in different environments exhibited genotype × environment interactions (G × E) (Malosetti et al. Reference Malosetti, Voltas, Romagosa, Ullrich and Van Eeuwijk2004; Zhang et al. Reference Zhang, Li, Wang, Liu, Liu, Peng, Tan, Wang, Shi, Sun, Song, Wang and Li2010) and were also preferable in MAS (Okogbenin et al. Reference Okogbenin, Marin and Fregene2008).
The co-localization of a QTL with positive correlation for root yield (YLD3_R10) and starch content (ST5_R10) was identified on linkage group 9. Interestingly, the QTL for plant and first branch height (Boonchanawiwat et al. Reference Boonchanawiwat, Sraphet, Boonseng, Lightfoot and Triwitayakorn2011) and pasting time of starch pasting viscosity (Thanyasiriwat et al. Reference Thanyasiriwat, Sraphet, Whankaew, Boonseng, Bao, Lightfoot, Tangphatsornruang and Triwitayakorn2014), deriving from the same F 1 population, were also reported in the same region. Generally, QTL underlying related traits tend to map in the same genomic regions or adjacent regions in the same linkage group (Sun et al. Reference Sun, Zhang, Le and Zhang2009). Therefore, QTL for yield and yield associated traits such as yield components (e.g. starch content, % dry-matter, seed number and seed weight) and yield-related traits (e.g. plant architecture, biomass and harvest index) appear to be clustered in the genome (Shi et al. Reference Shi, Li, Qiu, Jiang, Long, Morgan, Bancroft, Zhao and Meng2009). The QTL affecting different traits within the same genomic regions could be explained by pleiotropic effects or the close linkage of multiple genes (Okogbenin & Fregene Reference Okogbenin and Fregene2003). The major indicators for pleiotropic QTL are overlapped confidence interval regions of separate QTL, trait correlations and environmental correlations (Timmerman-Vaughan et al. Reference Timmerman-Vaughan, Mills, Whitfield, Frew, Butler, Murray, Lakeman, McCallum, Russell and Wilson2005; Lou et al. Reference Lou, Zhao, Kim, Shen, Del Carpio, Song, Jin, Vreugdenhil, Wang, Koornneef and Bonnema2007). The consistent QTL and the coincident QTL controlling different traits should be useful for MAS (Xiao et al. Reference Xiao, Grandillo, Ahn, McCouch, Tanksley, Li and Yuan1996; Redoña & Mackill Reference Redoña and Mackill1998).
Among the candidate genes identified within the QTL intervals underlying starch content, the glycosyl hydrolases family 15, the uridine 5’-diphospho-(UDP)-glucuronosyl and the UDP-glucosyl transferases are predicted to be involved in carbohydrate metabolism in cassava. Glycosyl hydrolases family 15 (GH15), which belongs among the glycosyl hydrolase (GH) enzymes, is classified into EC 3·2·1 × the Carbohydrate-Active EnZymes database (CAZy; Cantarel et al. Reference Cantarel, Coutinho, Rancurel, Bernard, Lombard and Henrissat2009). Enzymes in this group are involved in reactions in starch synthesis (Keeling & Myers Reference Keeling and Myers2010): GH15 included glucoamylase (EC 3·2·1·3), α, α-trehalase (EC 3·2·1·28) and glucodextranase (EC 3·2·1·70). Meanwhile, UDP-glucuronosyl (EC 2·4·1·17) and UDP-glucosyl transferase from scaffold09732 are classified among the glycosyl transferases (GTs) (EC 2·4.x.y), which catalyse the transfer of the glycosyl group from a UTP-sugar, forming small hydrophobic molecules. Similarly, candidate genes underlying QTL for starch pasting temperature in cassava were glucosyl transferases and glycosyl hydrolases (Thanyasiriwat et al. Reference Thanyasiriwat, Sraphet, Whankaew, Boonseng, Bao, Lightfoot, Tangphatsornruang and Triwitayakorn2014).
The candidate genes underlying the QTL for fresh root yield included those encoding a transcription factor, phosphatase activity, response signalling pathway and thioester hydrolase activity. As reported in a meta-analysis of yield QTL in (Swamy & Sarla Reference Swamy and Sarla2011), the zinc finger and pentatricopeptide repeat (PPR) domains were common and were also identified in the current study.
Other candidate genes within QTL for fresh root yield and starch content may influence these traits in cassava. Therefore, some of the candidate genes may be useful for further gene validation.
This research was supported by the Thailand Research Fund (Grants# TRG5580003 and DBG5380009), National Science and Technology Development Agency (NSTDA), Thailand (Grant# P-12-01382), the National Research Council of Thailand (Grants# P-12-00849) and Mahidol University.