

Introduction
Who is counted as poor (e.g. with income falling below a threshold) depends crucially on the measure of income adopted. One aspect of the measure of income that has drawn particular attention in the UK is the treatment of housing costs. As well as the physical standard of housing itself being important in avoiding deprivation, the affordability of housing costs is a major factor that impacts on the standard of living (Atkinson et al., Reference Atkinson, Cantillon, Marlier and Nolan2002). Recognising that the cost of housing does not always match the physical standards, official UK Households Below Average Income (HBAI) statistics present two alternative measures of income: ‘Before Housing Costs’ and ‘After Housing Costs’ (DWP, 2009).
Before Housing Costs (BHC) income is the measure generally adopted for poverty analysis in the countries of the European Union. It includes cash housing benefits and does not deduct housing costs, treating housing as any other consumption good. However, variation in the housing costs paid by households with comparable physical standards of housing may arise simply as a result of living in a particular region or being at a particular stage of mortgage repayment (Johnson and Webb, Reference Johnson and Webb1992; Buck et al., Reference Buck, Sutherland and Zantomio2007); or across households with different housing tenures. For example, social tenants benefit from a subsidised rent (Sefton, Reference Sefton2002) that the BHC measure of income does not acknowledge. Furthermore, owner-occupiers who own outright or who have paid off some of their mortgage might benefit from paying lower housing costs on a regular basis, compared to the situation of a comparable property rented in the private market.
To address this, after housing costs (AHC) income is sometimes calculated, which is BHC income less housing costs (e.g. DWP, 2009). In deducting housing costs from income, the issues raised above are dealt with. However, the fact that households occupy dwellings of different quality, affecting their relative standards of living, is ignored. The AHC measure understates the relative standard of living of those enjoying better housing either through choice or good fortune.
To overcome the drawbacks of the BHC and AHC measures, we propose an alternative measure of income that aims to account for both the housing costs paid for a given housing quality, and the housing quality. We refer to this as the imputed rent (IR) income measure. In brief, the housing price-to-quality relationship observed in the private rental market is used to impute a value for housing consumption, based on each dwelling characteristics, but consistently across all tenure types. From such value the housing costs actually incurred are deducted. This measure of net imputed rent is then added to BHC income to obtain the IR income.
IR constitutes a large component of in-kind income in most European countries (Frick et al., Reference Frick, Grabka, Smeeding and Tsakloglou2008). Contributions in the literature have offered empirical evidence of a strong inequality-reducing impact of IR both in EU counties (Smeeding et al., Reference Smeeding, Saunders, Coder, Jenkins, Fritzell, Hagenaars, Hauser and Wolfson1993; Eurostat, 1998; Frick and Grabka, Reference Frick and Grabka2003; Frick et al., Reference Frick, Goebel and Grabka2007) and elsewhere in the world (Yates, Reference Yates1994; Buckley and Gurenko, Reference Buckley and Gurenko1997; Gasparini and Escudero, Reference Gasparini and Escudero2004).
This article demonstrates and quantifies the difference an IR income measure makes to poverty measurement for the UK, drawing on the methods and approaches from the international literature. In particular, it provides an illustration of how including IR in income measurement can change conclusions about the relative effectiveness of anti-poverty policy reforms.
Given recent UK policy attention, we focus on children and pensioners. According to official statistics, the risk of experiencing poverty is significantly higher for children and pensioners than it is for the working age population using the BHC measure, and also for children using the AHC measure (DWP, 2009). We explore whether this remains the case using the IR measure. Furthermore, we examine how conclusions about the effectiveness of stylised poverty-reducing policies, targeted at children and pensioners are affected by the adoption of the IR income measure.
Poverty analysis: methods and income measurement
We use the Family Resources Survey 2003–4 (FRS), with a sample of 28,860 private households, for our analyses. The FRS provides information about individual income from various sources, tenure type, housing characteristics and housing costs. In order for all our empirical results to be consistent with each other, we use incomes as simulated by POLIMOD, a tax-benefit model for the UK (Redmond et al., Reference Redmond, Sutherland and Wilson1998), rather than using incomes as recorded in the FRS. We can, therefore, compare the incomes following simulated policy reforms with the incomes prevailing under 2003–04 policies. The POLIMOD simulated incomes have been defined to be as similar as possible to those used in the HBAI statistics (DWP, 2009), both BHC and AHC. POLIMOD calculates liabilities for income tax and National Insurance contributions and entitlements to child benefit, tax credits and means-tested benefits, including housing benefit. Otherwise, elements of income and housing costs (with rent measured gross of housing benefit) are drawn from the recorded values in the FRS dataset. Adjustments for non take-up of means-tested benefits and tax credits are made by applying the take-up proportions estimated for population sub-groups (Sutherland et al., Reference Sutherland, Evans, Hancock, Hills and Zantomio2008) on a caseload basis by the Department of Work and Pensions (2006) and HM Revenue and Customs (2006).Footnote 1
We use the modified OECD equivalence scale adjusting BHC, AHC and IR incomes to account for differences in household size and composition. As in the HBAI analysis, we set the poverty line at 60 per cent of median household equivalised income. This threshold naturally varies with the income measure that is used.
In the following analysis, we focus on poverty risk for children (aged under sixteen, or under nineteen if in full-time secondary education and unmarried) and pensioners (men aged sixty-five or more and women aged sixty or more).
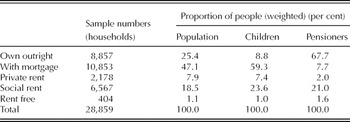
As shown in Table 1, there are significant differences in the distribution of tenure types for children and pensioners, which we would expect. While about two thirds of pensioners own outright, less than one in ten children live in owned-outright housing. About 60 per cent of children live in housing with a mortgage, but less than 8 per cent of pensioners are in this position. A very low proportion of pensioners are private tenants, while about 7 per cent of children live in private rental accommodation. The shares of children and pensioners living in social housing are comparable at slightly over 20 per cent.Footnote 2 These patterns suggest that households with pensioners are, on average, likely to incur lower housing costs than households with children and, other things being equal, are likely to enjoy greater command over resources for given housing quality than is indicated by conventional measures of income.
Housing tenure distribution in the United Kingdom

Source: Our calculations based on the FRS 2003–4.
Imputing rents
This section outlines our methodological approach to estimating the value of net IR, which we add to BHC income to obtain the IR income measure.
Among the methods previously used to derive a measure of IR, some are based on the capital value of the owned accommodation, viewing IR as a return on capital investment (Eurostat, 2010). However, this approach requires information about the capital value of property from all households, including tenants who may not know or supply it. This is problematic as we are keen to ensure that we assign an imputed rent to all potential beneficiaries, not least social tenants. Moreover, our interest lies in the consumption value of housing at a given point in time and not its investment return value. Therefore, we derive IR using the cost-to-quality relationship observed in the private rental market and based on housing quality-related characteristics observed across all tenure types. IR then reflects what the occupants of a dwelling would need to pay in gross rent if renting in the private market, minus what they actually pay to live there.
We first estimate a regression on the rent paid by private tenants, using a set of accommodation characteristics observable across all tenure types as explanatory variables. These include the number of bedrooms, the Council Tax band, dummies for the presence of central heating and whether the accommodation is let furnished or not, the number of years the household has been occupying the property and the region where the property is located.Footnote 3
The estimation sample contains 1,145 private tenants, holding assured short-hold letting agreements (approximately half of private tenants, which constitute the 8 per cent of the population). These are most representative of the private rental market prices that we wish to capture. Other tenancy types may relate to non-market agreements or contracts that were entered into some time in the past.Footnote 4 Regression results are presented in the Appendix.
Then we use estimated parameters from the regression analysis to predict a gross rent for owner-occupied, socially rented and rent-free accommodation, given the quality-related characteristics of the accommodation. We then deduct housing costs to obtain net IR. Housing costs include rent actually paid by reduced rent tenants, mortgage interest repayments for home owners with a mortgage, other costs related to regular maintenance and structural insurance and other charges paid by home owners. In some cases (around 5 per cent of home owners repaying a mortgage and about 3 per cent of social tenants), deducting housing costs results in a negative value of IR, implying that the cost of housing consumption outweighs any benefit that can be imputed to it, reducing IR income to below the BHC level.
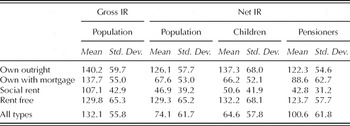
Table 2 presents our estimates of weekly gross and net IR by tenure type for children and pensioners, and for the population as a whole. Net IR is significantly lower than gross IR for owners with a mortgage and social tenants who are the tenure types with relatively large average housing costs.
Estimated weekly imputed rent (£) by tenure type and demographic group

Source: Our calculations using FRS 2003–4.
Among children and pensioners, outright owners and people living rent free have the highest amounts of net IR (£126.10 and £129.30 per week respectively in 2003–4 prices), followed by owners with a mortgage (£67.60) and social tenants (£46.90). Generally, the level of IR within tenure type is similar for children and pensioners. However, average IR for pensioners who own outright or social tenants is lower than for households of the same tenure type in which children live, possibly reflecting lower quality or smaller size of housing in which pensioners live. The reverse is the case for owners with a mortgage, reflecting pensioners’ later stage in the repayment of their mortgage.
In the final step, we derive the IR income measure by adding net IR to the standard BHC income measure.
Results: poverty using alternative income concepts
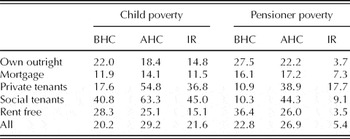
We now consider the effect of the choice of income measure on poverty rates.Footnote 5Table 3 reports poverty rates calculated using the BHC, AHC and IR income measures for children and pensioners across tenure types.
Child and pensioner poverty rates by tenure type (per cent)

Source: Our calculations using POLIMOD with FRS 2003–4.
The two official measures (BHC and AHC) provide different indications of the prevalence of child poverty. According to the BHC measure, 20 per cent of children live in households with income below the poverty line, with poor children over-represented among social tenants. On an AHC basis, the proportion of children living in poverty is higher by almost half of its BHC value at 29 per cent, and poor children are over-represented in privately rented accommodation as well as social housing. With the IR measure, the child poverty rate lies between that of the BHC and AHC measures (22 per cent). Children in owned-outright housing have a lower poverty risk using the IR measure than under either the BHC or AHC measures (15 per cent compared with 22 and 18 per cent respectively), while children in housing owned with a mortgage are shown to have a similar risk when using the IR and BHC income measures. However, children in social and private rented accommodation have an IR poverty risk that is higher than that using BHC income, but lower than that using AHC income.
It may at first sight be surprising that the child poverty risk among private tenants differs under the IR measure compared with BHC income as no IR has been added to the income of these households. However, the poverty threshold, measured as 60 per cent of median income, is 19 per cent higher under the IR measure than using BHC income. While the incomes of private tenant households are not affected by the shift from BHC to IR, their incomes relative to the median have fallen.
The relationship between poverty thresholds and distributions of the three income measures is shown separately for children and pensioners in Figure 1. For children, both the threshold and the distribution move to the right with the addition of IR, leaving the IR poverty rate little different from that under the BHC measure. In contrast, the concentration of pensioners below the poverty line observed for BHC as well as AHC income measures disappears for the IR measure. As a consequence, pensioner poverty risk is strikingly lower at one quarter of its BHC value. Poverty risk is especially reduced for home owners and rent free tenants. As with children, the small group of private tenant pensioners appear at a higher risk of poverty under the IR measure.
Income distribution and poverty thresholds using alternative income concepts
Source: Our calculations using POLIMOD with FRS 2003–4.

The main reason for such different outcomes for pensioners and children lies in their tenure status. Pensioners mostly own outright and are therefore attributed with a large amount of net IR. In contrast, children mostly live either in housing with a mortgage or in social housing.
Are reform evaluations sensitive to the income measure used?
In this section, we assess the extent to which conclusions about illustrative policy reforms are sensitive to the choice of income measure used to evaluate the effect on poverty. We simulate two reforms to the UK tax and benefit system designed to reduce child and pensioner poverty respectively. Thus, we can, in a stylised manner, consider which reform provides better value in terms of its poverty-reducing implications and then consider whether the choice of the income measure affects this assessment.
The reform intended to reduce child poverty is an increase of £12 per week to the child tax credit (CTC) per-child maximum amount. Using the POLIMOD microsimulation model, we estimate the first round net budgetary cost to the government as being £3.8 billion a year.Footnote 6
The reform intended to reduce pensioner poverty is designed to cost the same amount. It consists of an increase in the means-tested pension credit (PC). The simulated reform adds an extra 18.7 per cent to the guarantee maximum (equivalent to £19.05 per week for single pensioners and £28.45 for pensioner couples).Footnote 7
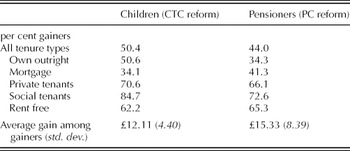
Table 4 reports the number of children and pensioners who gain from the simulated CTC and PC reforms, respectively, across tenure type, and the average income increase across benefitting households. About 44 per cent of all pensioners and 50 per cent of all children would gain from these policies. The average increase in household income per gaining pensioner would be £15.33 per week, which is slightly larger than the average increase in household income of £12.11 per gaining child.Footnote 8 In both groups, people in private and social rented accommodation are more likely to gain. These tenure types are more likely occupied by people entitled to means-tested benefits.
Gainers (per cent) and the average increase in household income (£/week) for children and pensioners following an increase in child tax credit (for children) and pension credit (for pensioners)

Source: Our calculations using POLIMOD with FRS 2003–4.
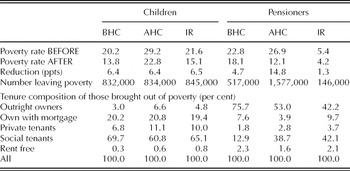
The effectiveness of the reforms in reducing child and pensioner poverty using the three income measures is shown in Table 5. The number of children brought out of poverty is almost the same in the three cases (830–850 thousand or around 6.4 per cent of all children). The tenure composition of those brought out of poverty is somewhat different when comparing the BHC with IR measure, however. While the largest group brought out of poverty is clearly social tenants using all measures, using IR there are fewer social tenants and more private tenants and outright owners.
Child and pensioner poverty reduction due to policy reforms, under alternative income concepts and by tenure type

Source: Our calculations using POLIMOD with FRS 2003–4.
In contrast, the assessment of the poverty-reduction effect of the PC reform on pensioners is very sensitive to the choice of the income measure. The number of pensioners brought out of poverty is much lower using the IR measure. This is because pre-reform pensioner poverty using IR is already very low and the proportional effect, while similar to that under BHC, represents a small number of pensioners (146 thousand, a third of the number brought out of poverty under the BHC measure). The contrast with the AHC measure is even larger because pre-reform AHC pensioner poverty is much higher. This suggests that the reform is very effective, moving more than half of the number counted as poor on this basis across the poverty line. The tenure composition of pensioners brought out of poverty also shifts significantly, with fewer outright owners and more social tenants.
On the basis of the evidence presented here, judgement as to whether expenditure on child or pensioner benefits is more effective at reducing poverty among the respective group depends on the income concept used. On a BHC basis, the numbers are relatively close, with child poverty reduced to a greater extent than pensioner poverty. On an AHC basis, the reform to PC would be extremely effective at moving pensioners across the poverty line. About twice as many pensioners would be brought out of poverty as children under the budget-equivalent CTC reform. Under the IR measure, pensioner poverty is much lower before the reform and the reform itself has a relatively small absolute effect on the poverty numbers. However, using the IR income measure suggests that expenditure on children would be the more effective strategy.
Conclusions
The treatment of housing when measuring income has some important implications for poverty analysis, and for drawing conclusions about the poverty-reduction effects of policy reforms. In this article, we compare poverty estimates for the UK under actual policies and under illustrative policy reform scenarios, using conventional BHC and AHC income measures and using an alternative IR approach. Adopting the IR measure can potentially provide a more comprehensive and consistent picture of living standards and therefore improve judgements about the success of policy reforms in terms of their implications for poverty or income distribution generally.
Once we account for the market value of housing quality, net of housing costs, child poverty risk is not significantly different from that estimated using the official BHC income measure. However, the composition of children counted as poor is different, including more children living in privately rented accommodation and fewer from owned outright housing. In contrast, pensioner poverty risk would fall to 5 per cent (one quarter its BHC value) using the IR measure.
Measures of the success of policy reforms in tackling poverty, such as the absolute reduction in the numbers counted as poor, are almost unaffected by the choice of income measure in the case of children and an increase in CTC. In contrast, the effect varies for pensioners and a budgetary-equivalent increase in PC, depending on the chosen income measure. It is smallest for the IR measure because pensioner poverty is already low using this income measure.
One can argue about whether IR should be included as income for poverty measurement. On the one hand, including IR allows better comparisons between incomes across tenure types. It captures the fact that some households, such as those owning outright, pay little for housing out of cash income which is not the case for BHC income. Simultaneously, the IR measure overcomes drawbacks of the AHC measure, which conceals the effect on relative living standards of households living in higher quality housing.
On the other hand, including IR as standard in poverty measurement would pose challenges. In practice, it would require a better assessment of the costs of ownership than has been possible in this study. For example, although we have deducted from IR amounts recorded in the FRS data for regular maintenance costs, we have not been able to account either for irregular maintenance costs or the hidden costs of living in housing that is in need of repair, but which the owners are unable to maintain. To correct for this, aspects of housing quality that are not captured by the variables available to us would need to be included in the estimation of net IR.
A further issue relates to the non-cash nature of imputed rent. The inclusion of imputed rent (and other non-cash incomes) has been advocated in distributional and poverty analysis on the grounds that such income components enlarge individuals’ command over resources. However, although the availability of a positive amount of IR frees cash incomes that would otherwise have been spent on housing consumption, non-cash incomes cannot be regarded as perfect substitutes for cash incomes, especially in the short term.
Nevertheless, we demonstrate that the inclusion of IR would reduce the assessed risk of poverty for pensioners as a whole relative to children as a whole. This re-emphasises the already high-profile policy problem of child poverty in the UK which remains insensitive to the treatment of housing income that we have considered here.
Acknowledgements
The research underlying this article has been carried out as part of the AIM-AP (Accurate Income Measurement for the Assessment of Public Policies) project, supported by the 6th Framework Programme of the European Commission (CIT5-CT-2005–028412). We are grateful to participants in that project, particularly Joachim Frick and Panos Tsakloglou, and for useful comments from Ruth Hancock. The usual disclaimers apply. Data from the Family Resources Survey (FRS) are made available by the UK Department of Work and Pensions (DWP) through the UK Data Archive. Material from the FRS is Crown Copyright and is used by permission. Neither the DWP nor the Data Archive bear any responsibility for the analysis or interpretation of the data reported here.
Appendix
Estimating log rent for assured shorthold tenants

Notes: Standard errors in brackets; * significant at 10 per cent; ** significant at 5 per cent; *** significant at 1 per cent
Source: Our calculations using FRS 2003–4.
Estimated coefficients can be interpreted as the percentage increase in gross rent that would result from a change in the value of each covariate from the situation of a ‘reference accommodation’, other things being equal. The reference accommodation is a one bedroom house, unfurnished, in Council Tax band A, with no central heating, located in the North East of England and in which the household has been living for less than two years. So the market rent is 16.2 per cent higher for two bedroom houses and respectively 21.3 per cent and 35.0 per cent higher for three and four or more bedroom houses, compared with one bedroom houses. Central heating increases rent by one tenth and furniture by about 8 per cent. The rent level progressively increases for accommodation classified in higher Council Tax bands, up to an 87 per cent increase for band G and H housing, relative to band A accommodation. Location in London increases market rent by 60 per cent to 70 per cent, and by 25 per cent to 40 per cent in the South East, South West and East, relative to a location in the North East. Rent is 12 per cent lower for accommodation occupied for more than two years and about 57 per cent lower for accommodation occupied for more than ten years. This indicates the extent to which, in longer tenancies, rent does not keep pace with market increases. For this reason, in the ‘out of sample’ prediction based on the estimated function, it is assumed that all (hypothetical) rental agreements were initiated within the last two years. Also, owned accommodation is treated as being rented unfurnished.