


INTRODUCTION
At the heart of the current “voting wars” (Hasen Reference Hasen2012) lie different beliefs about the incidence of voter fraud (Ansolabehere and Persily Reference Ansolabehere and Persily2008; Stewart III, Ansolabehere, and Persily Reference Stewart, Ansolabehere and Persily2016). These beliefs in turn shape the evolving nature of voting rights (Minnite Reference Minnite2010), making it critical to quantify and clarify how often such fraud actually occurs (Alvarez, Hall, and Hyde Reference Alvarez, Hall, Hyde, Alvarez, Hall and Hyde2009).
Voter fraud could come in many forms, including the casting of multiple ballots (i.e., double voting), illegal ballots (e.g., noncitizen voting), or other peoples’ ballots (i.e., voter impersonation).Footnote 1 After extensive research, Levitt (Reference Levitt2007) and Minnite (Reference Minnite2010) conclude that little to no voter fraud—of any stripe—has occurred in recent U.S. elections. One of their primary pieces of evidence is that few people have been successfully prosecuted for voter fraud. Not everyone, however, accepts these conclusions, both because such prosecutions are dependent on the investigation of, or at least allegations by, legal authorities (Fund Reference Fund2004) and because voter fraud may be difficult to detect when it is done well (Ahlquist, Mayer, and Jackman Reference Ahlquist, Mayer and Jackman2014; Christensen and Schultz Reference Christensen and Schultz2013).
We focus specifically on double voting, which is one of “the most common assertions of voter fraud” and a factor in structuring policy about the removal of voter registrations (Levitt Reference Levitt2007, 12). Identifying double voters is particularly challenging because the information in publicly available state voter files—stitched together to create a national file—is necessarily limited due to privacy concerns. Information on social security numbers is particularly useful for determining whether two registrations belong to one person, but this information is not included in public voter files even when known by a state. The only variables consistently reported across states about each registration are first name, last name, and date of birth (DOB). Although approximately three million pairs of 2012 vote records share these three attributes, some of these parings represent two distinct voters rather than one double voter.
We first develop a statistical technique to estimate the aggregate amount of double voting using a national voter file. Roughly speaking, we estimate the number of double voters by subtracting the number of distinct voters that we expect to share the same first name, last name, and DOB from the number of observed matching pairs. We build on McDonald and Levitt’s (Reference McDonald and Levitt2008) probabilistic birth-date model for our estimation strategy and extend their work in four ways, accounting for nonuniformity in the distribution of birthdays, producing analytic confidence intervals, explicitly accounting for measurement error in vote history, and looking at the entire country instead of a single state.
If registration records in our national voter file are never wrongly marked as having been used to vote, we estimate that about one in 4,000 votes cast in 2012 were double votes. But inaccurate marking of vote records would cause our estimate to overstate the number of true double votes. In fact, a 1.3% clerical error rate would be sufficient to explain all of these apparent double votes. Unfortunately, no data exist to make a definitive statement about the error rate nationwide. However, a comparison we make of vote records in a poll book to vote records in a voter file supports the idea that enough measurement error exists to explain at least some, and potentially nearly all, of the apparent double votes.
After we use a national voter file to produce our estimate of double voting, we use data generated by the Interstate Crosscheck Program, a consortium of states that share detailed registration information with each other, to validate the result. The data include all of the cases in which a registration record in a single state in the consortium had the same first name, last name, and DOB as a registration record in any other participating state, plus an indicator for whether the last four digits of each registration’s social security number (SSN4) is known and an indicator for whether the two are the same. Using these data, we first identify cases in which both registration records have a known SSN4 and were used to vote, and then calculate the share of these cases in which the SSN4s match. In the national voter file, we estimate that 97% of the votes cast with the same first name, last name, and DOB were cast by two distinct individuals. If we limit our focus to Crosscheck states, we estimate that fully 99.4% of votes cast with the same name and DOB were cast by distinct individuals. In the consortium data, where we can measure this statistic more directly, we estimate this quantity to be 99.5%.
The more fine-grained consortium data also allow us to better quantify the balance between voter accessibility and electoral integrity at the heart of the current voting wars. Fewer than 10 of the roughly 26,000 known duplicate registrations we identified in the consortium data were used to cast two votes in 2012. By contrast, we identified more than 2,500 cases in which only the registration record with an earlier registration date was used to vote in 2012. This ratio is particularly important when evaluating policies such as Indiana’s, which instructed local registrars to cancel registrations that share a common first name, last name, and DOB with a registration in another state if the Indiana registration had an earlier registration date [Ind. Code Ann. 3-7-38.2-5(d)(2); see generally Com. Cause Indiana v. Lawson, 937 F.3d 944 (7th Cir. 2019)]. Our results suggest that such a strategy would eliminate more than 300 registrations used to cast a seemingly legitimate vote for every double vote prevented. More broadly, these findings highlight that the number of registration records that share common observable characteristics and the number of duplicate registrations are poor proxies for the number of double votes.
THE MEASUREMENT OF VOTER FRAUD
The Supreme Court has voiced concern that perceptions of voter fraud “drive[] honest citizens out of the democratic process and breed[] distrust of our government” [Purcell v. Gonzalez, 549 U.S. 1, 4 (2006)]. This suggests an important scholarly role for the measurement of voter fraud: if there is little voter fraud, it is particularly important for this to be documented and for the public to be made aware.
To this end, the recent growth of election forensics has ushered in a host of new measurement methods to detect patterns consistent with various conceptions of electoral fraud (see, e.g., Ahlquist, Mayer, and Jackman Reference Ahlquist, Mayer and Jackman2014; Beber and Scacco Reference Beber and Scacco2012; Cantú and Saiegh Reference Cantú and Saiegh2011; Christensen and Schultz Reference Christensen and Schultz2013; Cottrell, Herron, and Westwood Reference Cottrell, Herron and Westwood2018; Fukumoto and Horiuchi Reference Fukumoto and Horiuchi2011; Hood and Gillespie Reference Hood and Gillespie2012; Mebane Reference Mebane, Alvarez, Hall and Hyde2009; Montgomery et al. Reference Montgomery, Olivella, Potter and Crisp2015). But little existing election forensics work examines the issue of double voting, despite the frequency with which it is alleged (Levitt Reference Levitt2007).
McDonald and Levitt’s (Reference McDonald and Levitt2008) study of double voting within New Jersey in the 2004 presidential election is the most extensive work to date on the topic. McDonald and Levitt identify 884 pairs of vote records that have the same first name, last name, and DOB. Via simulation, they estimate the number of vote records that would be expected to share these observable characteristics by drawing the year of birth for a vote record at random from the empirical age distribution of voters and assuming that birthdays within years follow a uniform distribution. Using this method, McDonald and Levitt put a 95% confidence interval of 300–500 people voting twice in New Jersey in this election. If this estimate is correct and the rate of intrastate double voting in New Jersey is representative of the rate in the rest of the county, it would imply that more than 10,000 intrastate double votes were cast across the country during the 2004 presidential election.
In the sections that follow, we build on work by McDonald and Levitt (Reference McDonald and Levitt2008) and by Yancey (Reference Yancey2010) to estimate the number of people who cast two ballots—either in the same state or in two different states—in the 2012 U.S. presidential election. In addition to expanding the scope of analysis using a national voter file, we deal with two statistical challenges that McDonald and Levitt identify in their approach. First, our model accounts for both name and day-of-birth periodicity. Second, we allow for the possibility that some registration records are incorrectly marked as being used to cast a ballot. McDonald and Levitt note that failure to account for either issue can inflate estimates of double voting. Indeed, we estimate that the actual number of double votes is fewer than one-tenth of what their approach suggests.
Our approach departs from many of the standard strategies for record linkage (see, e.g., Elmagarmid, Ipeirotis, and Verykios Reference Elmagarmid, Ipeirotis and Verykios2007). For example, recent work by Enamorado, Fifield, and Imai (Reference Enamorado, Fifield and Imai2019) is part of a broader set of Bayesian mixture models that generate posterior probability estimates that record i from dataset A and record j from dataset B are associated with the same observation, even when the number of overlapping variables between the two datasets is inconsistent or some of the variables are measured with error [see also Sadinle (Reference Sadinle2017) and Steorts, Hall, and Fienberg (Reference Steorts, Hall and Fienberg2016)]. These models are well suited for estimating the likelihood that a specific registration in state A and a specific registration in state B belong to the same person based on all the information that can be assembled about each registration.
Estimating the total number of double votes, however, presents a number of challenges to existing Bayesian record-linkage models. National voter files contain a limited set of consistent identifiers, making it difficult to conclusively determine whether a particular pair of vote records represents the same individual voting twice. In theory, one could aggregate over the posterior probabilities that each pair of records comes from the same individual and interpret this sum as the estimated number of double votes. But the infrequency of double voting brings into question the accuracy of the posterior probabilities. Indeed, previous work suggests that the performance of existing Bayesian record-linkage models declines when the overlap—the share of observations from one dataset that also are contained in the other—decreases (Enamorado, Fifield, and Imai Reference Enamorado, Fifield and Imai2019; McVeigh and Murray Reference McVeigh and Murray2017). For example, Enamorado, Fifield, and Imai show classification errors increase when the overlap is reduced from 50% to 20%. Because double voting is rare, overlap is less than 1% in our setup, even if we engage in the forms of blocking suggested by Enamorado, Fifield, and Imai. If this low amount of overlap generates even small inaccuracies in estimates of posterior probabilities, these inaccuracies can be consequential because the probabilities get aggregated over such a large number of potential pairings.
Alternatively, we could apply a threshold to the posterior probabilities to determine whether any given pairing should be considered a match, as is common in the Bayesian record-linkage literature (Fellegi and Sunter Reference Fellegi and Sunter1969). For example, Enamorado, Fifield, and Imai (Reference Enamorado, Fifield and Imai2019) apply thresholds between 0.75 and 0.95 when defining whether voter registration records in two datasets are a match. But in our setting, our results indicate that the probability that two vote records that share the same first name, last name, and DOB belong to the same individual is less than 0.05, hindering efforts to apply this threshold strategy.
Because our quantity of interest is the total number of people casting two ballots, there are several advantages of modeling the aggregate number of matches instead of trying to identify specific double voters. Whereas most existing record-linkage models consider only the overall match quality of two fields, we consider the actual values in those fields. As a result, our method can naturally account for the varying popularity of names and nonuniform birth-date patterns. Relatedly, most record-linkage approaches evaluate the match quality of two records in a given field independent of the information contained in other fields. By contrast, our model accounts for interactions between someone’s first name and DOB that affect the likelihood that two people who share these characteristics are, in fact, the same person. Such flexibility can be incorporated into existing record-linkage methods, but this typically comes with significant computational overhead or loss of theoretical guarantees (Enamorado, Fifield, and Imai Reference Enamorado, Fifield and Imai2019). Thus, although we believe in theory that the number of double votes could be estimated via record-linkage models, doing so appears to require a nontrivial extension of existing methods.
We also take steps to address some of the weaknesses of our approach relative to the standard strategies for record linkage. Bayesian record-linkage models are better equipped than ours for dealing with data recording errors (e.g., misspelled names) and missing data. We take two actions to deal with this. First we preprocess the data to correct some data recording errors. Second, we exclude some observations that we think are particularly likely to have data errors and then scale our estimates to account for the missing and excluded data.
Our statistical approach has applications beyond estimating the incidence of double voting. Ansolabehere and Hersh (Reference Ansolabehere and Hersh2017) develop the terms “matchability” and “identifiability” to define two contrasting goals of record linkage. Their focus is on voter identification laws, in which identifiability refers to the identification of the specific individuals who possess the identification required to vote and matchability refers to quantifying differences over groups (e.g., racial groups) in the likelihood of possession. Our approach to studying matchability without first establishing identifiability may be useful in informing similarly broad political debates, particularly when linking datasets with two key properties. First, that there is a reasonable chance distinct records match on DOB and the other identifiers available in the two datasets, perhaps because identifiers are limited to preserve anonymity. Second, that few observations in the two datasets are true matches. For example, there have been multiple cases in recent years in which a substantial number of individuals on a list of potential noncitizens share common identifiers with a registered voter (Garner Reference Garner2019). Our method could be applied to determine how many people on such a list are actually registered to vote.
DATA
This study uses three sources of data: (1) a national voter file, with first name, last name, and DOB; (2) a comparison of local poll books with an analogous local voter file; and (3) a list of cases in which voter registration records in different states had a common first name, last name, and DOB, supplemented with information about whether the registration records shared a common SSN4.
Each source of data plays a distinct role. The national voter file, which comes from TargetSmart, a data vendor, is used to estimate the rate of double voting. The poll book comes from Philadelphia, Pennsylvania, and is used to suggest the degree of measurement error in vote records, although it cannot offer a nationally representative estimate. Finally, the multistate match was generated by the consortium of states known as the Interstate Crosscheck Program and is used to both validate the model result and quantify the implications for election administration.
National Voter File
To estimate the number of people who voted twice in the 2012 election, we use TargetSmart’s national voter file, which lists the first name, last name, DOB, and turnout history associated with each voter registration.Footnote 2 The 126,444,926 vote records in these data provide a nearly comprehensive list of 2012 general election participation.Footnote 3
One limitation of our approach is that we need to observe first name, last name, and DOB to include a vote record in our analysis. Thus, we exclude 1,019, 3,145, and 1,498,005 vote records from all of our analyses because we do not have information on the first name, last name, or DOB, respectively. While we scale our estimates to account for the fact these vote records are not included in our analysis, this requires an assumption that vote records missing at least one of these three fields were equally likely to be used to double vote as vote records missing none of these fields.
A second limitation of our approach is that measurement error in registration records may influence our estimated rate of double voting. Such bias could point in either direction. An error could eliminate the distinguishing feature between two actually unique vote records, creating the appearance of a double vote, or introduce such a distinguishing feature, masking what would otherwise have been detected as a double vote.
Section A.4 in the Appendix highlights a number of forms of measurement error in the TargetSmart data. Across all years, we found an improbable 14% of 2012 vote records that were associated with a first-of-the-month birthday. McDonald (Reference McDonald2007) notes that first-of-the-month birthdays are sometimes used by election officials to identify missing information and drops records with such “placeholder” dates of birth. We follow the same strategy here and remove these records from our baseline analysis that might otherwise cause us to overestimate the number of double votes.
We similarly are concerned that some states generally have poor record-keeping practices, which might introduce an unknown bias into our estimate. Ansolabehere and Hersh (Reference Ansolabehere and Hersh2010) conclude that voter registration data from some states, most notably Mississippi, perform consistently worse than others across a range of data validation exercises. We take advantage of the information contained in both residential addresses and generational suffixes (e.g., “Jr.” and “Sr.”) to generate two related measures of the accuracy of a state’s voter records. It is highly unlikely that two voters with the same first name, last name, and DOB would be registered to vote at the same address. Although most states have almost no cases like this, seven states, including Mississippi, have a significant number of such pairings. Our suspicion that many of these cases represent fathers and sons who are incorrectly noted as having a common DOB is bolstered by the finding that many of these pairings do not share a common suffix. Because this suggests that there is substantial measurement error in voter records in these states, we drop these states from our baseline analysis.Footnote 4
Our preferred sample includes 104,206,222 of the 126,444,926 vote records contained in the full dataset. We explain in the Results section how we adjust our final estimate to account for the dropped records. In doing so, we make an additional assumption that registration records with a first-of-the-month birthday and from the seven dropped states are used to cast double votes at the same rate as all other registration records.
Finally, we address measurement error in names. Two vote records that should be associated with the same person might not be if each has a similar, but not identical, first name. To reduce the possibility that such measurement error causes us to underestimate the number of double votes, the Appendix details how we use commercial software to resolve each first name to a standardized form.
Ultimately, though, this preprocessing approach cannot address all problems of exact matching vote records. For example, while we correct transcription errors in first names, we cannot address the case of outright voter evasion, in which registration records are purposely misleading. That remains a weakness of our inferential approach, although the problem is likely mitigated by established practices of checking registration information against other state databases. To better understand the consequences of measurement error, we present a sensitivity analysis in the Appendix that shows how our estimate of the number of double votes may be affected by such error.
Philadelphia Vote Record Audit
As we discuss in the next section, our estimate of the number of double votes depends on the rate at which registration records are erroneously marked as being used to vote. While we selected Philadelphia in part out of geographical convenience, we also thought the process it uses to translate its poll books into vote records would make it middle-of-the-road in terms of the incidence of such errors. There are three general approaches to the task of generating electronic vote records. Some jurisdictions use an electronic poll book, which automatically updates the voter file and, thus, should be the least error-prone. But in 2012, only a quarter of voters used an electronic poll book to check-in to vote (Election Assistance Commission 2013). Other jurisdictions manually key in the information about who voted, which we expect to be the most error-prone method. The third method, which is illustrated by the Philadelphia poll book displayed in Figure 1, is to attach a bar code to each registration record, which should be scanned after the election if it is used to vote. We expect this will generate more error than an electronic poll book, but less error than when the information gets manually entered. Because of the local variation in updating voter history, however, our audit is meant only to be illustrative, not representative, of the error rate in the population.
Example of a Philadelphia Poll Book After an Election
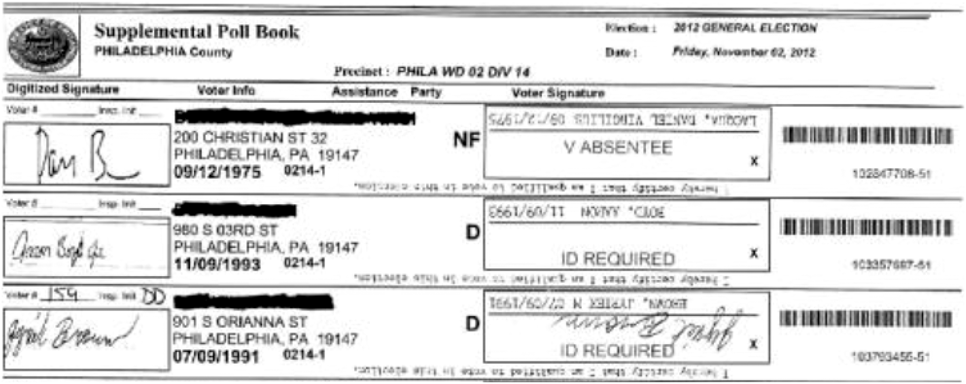
We knew of no existing data that were useful for estimating this quantity. To fill this gap, we conducted an audit in which we compared data on who voted in the 2010 midterm election in Philadelphia according to the poll books with who voted according to an electronic voter file produced on December 8, 2010. Our principle interest is in identifying false positives: registrations that had an electronic record of voting, but were not listed as having voted in a poll book.
Auditors validated 11,676 electronic registration records with a record of voting and 17,587 electronic registration records without a record of voting in 47 randomly selected precincts in Philadelphia.
Interstate Crosscheck Multistate Match with SSN4
The Interstate Crosscheck Program is a consortium of states that share individual-level voter registration data in an effort to eliminate duplicate registrations and prevent (or prosecute) double voters. According to Crosscheck’s Participation Guide (see Section A.10 in the Appendix), administrators return to each participating state a list of registrations in that state that share the same first name, last name, and DOB as a registration in another participating state. Most of our analysis focuses on 2012, in which Crosscheck handled more than 45 million voter registration records and flagged more than a million.
We obtained the list of 100,140 and 139,333 pairings that Crosscheck provided to the Iowa Secretary of State before the 2012 and 2014 elections, respectively. In addition to the first name, last name, and DOB, these data include the middle name, suffix, registration address, county of registration, date of voter registration, voter registration status (i.e., active or inactive), and the last four digits of a registrant’s social security number (SSN4) in both the Iowa voter file and the voter file of the state of the matched registration. For the Iowa registration, it also includes the voter registration number. For privacy reasons, Iowa removed the SSN4 before providing us with these data, instead including an indicator for whether the SSN4 was missing for the Iowa registration, an indicator for whether the SSN4 was missing for the other state’s registration, and an indicator for whether the SSN4 was the same in Iowa and the other state.Footnote 5
Knowledge of SSN4 match allows us to better assess whether a specific pairing reported by Crosscheck represents the same individual registered twice or two distinct individuals, each registered a single time. Only 1 in 10,000 distinct people with the same first name, same last name, and same DOB would also share the same SSN4 by chance. So, pairings that share all four attributes in common are likely the same person registered twice. And absent transcription error, registrations with different SSN4s are for two distinct people.
To assess the frequency with which votes are cast using the registration records flagged by Crosscheck, we merged the Crosscheck data with the TargetSmart national voter file. We exactly matched records on first name, middle name, last name, DOB, and state.Footnote 6 Because our TargetSmart data were generated after our Crosscheck data, a registrant’s information may have changed between when Crosscheck identified its pairings and when the TargetSmart data were compiled. In addition, some of the information reported to Crosscheck may not have been reported to TargetSmart, particularly if such information is privileged or confidential. Because we are concerned that some registrants in Crosscheck will fail to match to their own vote record in TargetSmart, we also merged the Iowa-specific registration records flagged by Crosscheck with a contemporaneous Iowa voter file using the voter registration number that is contained in both sources.
METHODOLOGY
We now detail our statistical approach to estimating the incidence of double voting. At a high level, we start with the set of apparent double votes (i.e., vote records with the same first name, last name, and DOB) and then subtract the number of matches one would expect to occur by chance—a procedure we formalize in the first sub-section that follows. We show how to compute the number of these coincidental matches in the next sub-section by modeling the relationship between names and dates of birth. In the final sub-section we describe how to derive more precise estimates of double voting that account for two forms of measurement error: (1) inaccuracies in recorded birthdays and (2) inaccuracies in recorded turnout.
Adjusting for Doppelgängers
We start by making two key assumptions. First, we assume that the voter file is a completely accurate reporting of whether a registration was used to vote in a given election. When this assumption holds, double voting is the only explanation for why the same individual would be recorded as having voted twice. We revisit this assumption in the last sub-section when we investigate the effect of recording errors on our estimate. Second, we assume that an individual votes at most twice. We make this simplifying assumption because few people are registered to vote more than twice (Pew 2012) and about 95% of the cases in which vote records match on name and DOB involve only two records.
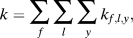
Given this, we decompose the number of people k who voted twice in a given election into the sum
 $$k = \sum\limits_{f} \, {\sum\limits_{l} \, {\sum\limits_{y} \, {{k_{f,l,y}}} } } ,$$
where k f,l,y is the number of double voters with the first name f and the last name l who were born in year y. Although we cannot observe k f,l,y, we can estimate it by combining three quantities. The first is n f,l,y: the number of vote records in a given election with the first name f, last name l, and birth year y. The second is m f,l,y: among the n f,l,y vote records, m f,l,y is the number of pairs of records having the same birthday. Finally, the third is p b|f,l,y: the probability of having a birthday b conditional on having the first name f, last name l, and being born in year y.Footnote 7
Theorem 1, which is presented in the Appendix, shows how we combine these three quantities to estimate k f,l,y.Footnote 8 Roughly, starting with the number of observed matches m f,l,y, we subtract the number of pairs expected to match by chance alone. Specifically, we have
 $${\hat{k}_{f,l,y}} = {{\left( {{m_{f,l,y}} - \left( {\matrix{ {{n_{f,l,y}}} \cr 2 \cr} } \right)\sum\limits_{i} \,{p_{{b_i}|f,l,y}^2} } \right)} \Big / {\left( {1 - \sum\limits_{i} \, {p_{{b_i}|f,l,y}^2} } \right)}}.$$
Theorem 1 further provides an analytic bound on the variance of  ${\hat{k}_{f,l,y}}$, which in turn yields confidence intervals on our estimate of double voting. To derive these expressions, we treat m f,l,y as the realization of a random variable, M f,l,y, that depends on (1) the actual number of double votes cast (which we treat as a fixed but unknown quantity) and (2) the number of pairs of vote records matching on birthday just by chance (which we treat as random). The remaining two terms, n f,l,y and p b|f,l,y, are considered to be fixed.
To evaluate equation (2), we need values for n f,l,y, m f,l,y, and p b|f,l,y. The first two can be directly observed from the voter file, but the birthday distribution p b|f,l,y must be estimated, as we describe next.
Modeling the Birthday Distribution
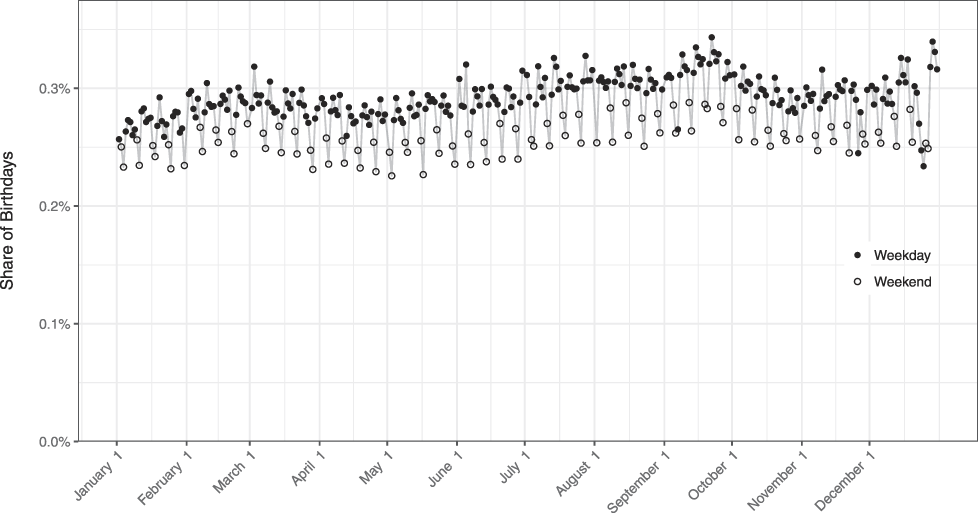
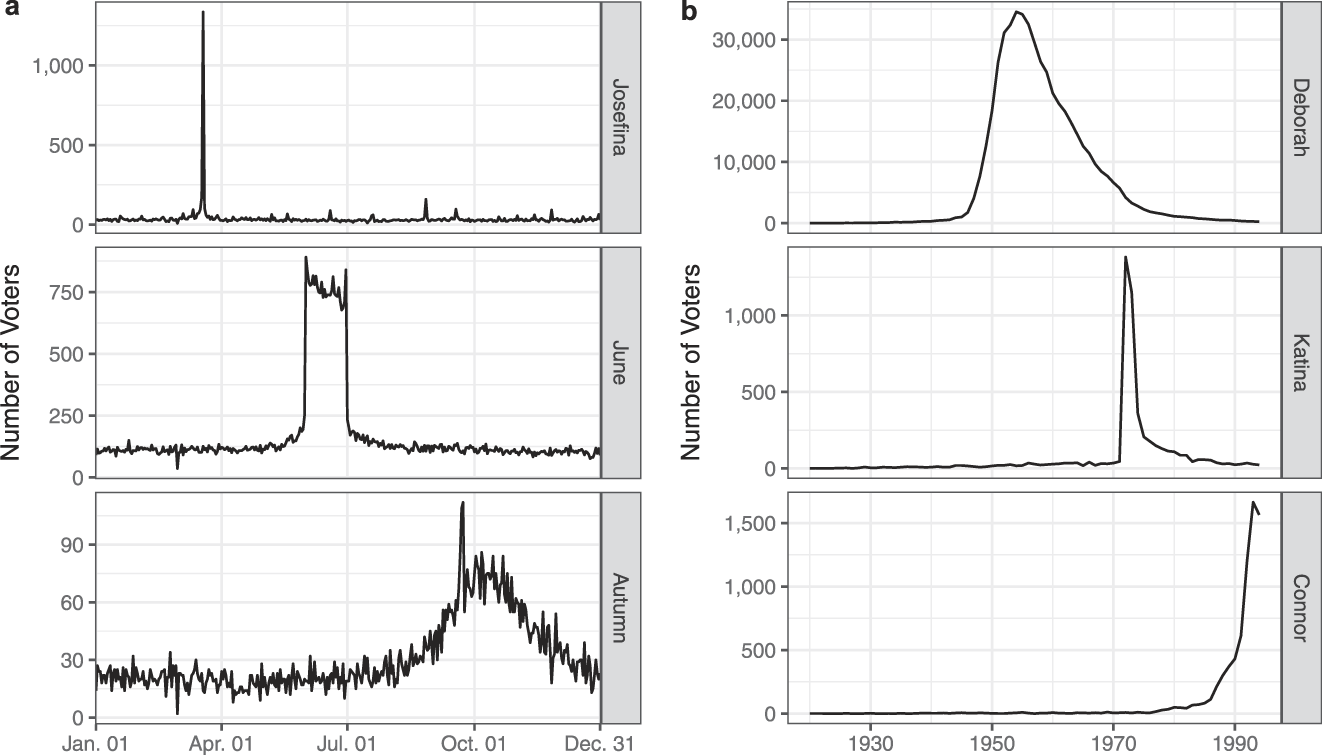
For simplicity, one could take p b|f,l,y to be uniform across days of the year, but that would miss important patterns in the birthday distribution, including periodicities in birth day-of-week and seasonal correlation between first names and birthdays. Figures 2 and 3 illustrate these patterns. First, using data on 2012 voters born in 1970, Figure 2 shows that the same number of people are not born on all days. For example, people are more likely to be born during autumn than during other parts of the year and on weekdays than on weekends. Second, Figure 3 shows that certain first names are more frequently observed among people born in certain points of the year and in certain years.
Distribution of (Cleaned) Birthdays in 1970 in the National Voter File
Examples of Names Among 2012 Voters with a Nonuniform Date of Birth Distribution, by Day (a) or Year (b) of Birth.
Note: For example, those with the name June were likely born in the month of June, and those with the name Josefina were likely born on March 19, the associated name day.
In addition to our assumptions about no measurement error and a maximum of two votes per person, we assume p b|f,l,y can be well approximated as follows. Define d b,y as the day of the week on which birthday b occurred in year y. For instance, d September 25, 1970 = Friday. Let B, F, and D be random variables that specify the birthday, first name, and birth day-of-week of a random voter. Then we estimate p b|f,l,y by
 $${\hat{p}_{b|f,l,y}} = {{\widehat {\Pr }\left( {B = b\,|\,F = f} \right)\;\widehat {\Pr }\left( {D = {d_{b,y}}} \right)} \over {\sum\limits_{b\prime } {\widehat {\Pr }\left( {B = b\prime \,|\,F = f} \right)\;} \widehat {\Pr }\left( {D = {d_{b\prime ,y}}} \right)}}.$$
Section A.1 in the Appendix provides theoretical justification for the specific form of our estimator. The constituent factors in equation (3) are estimated as follows. First,
 $$\widehat {\Pr }\left( {D = d} \right) = {{\sum\limits_{f\prime } {\sum\limits_{y\prime } {\sum\limits_{b\prime } {{r_{f\prime ,y\prime ,b\prime }}} } } {\tf="OT74165594"{1}}\left( {{d_{b\prime ,y\prime }} = d} \right)} \over {\sum\limits_{f\prime } {\sum\limits_{y\prime } {\sum\limits_{b\prime } {{r_{f\prime ,y\prime ,b\prime }}} } } }},$$
where r f,y,b is the number of vote records with the first name f, birthday b, and birth year y. Second, for a smoothing parameter θ = 11,000 that maximizes model fit,Footnote 9 we set
 $$\widehat {\Pr }\left( {B = b\,|\,F = f} \right) = {{\theta \,\widehat {\Pr }\left( {B = b} \right) + \sum\limits_{y\prime \ne y} \,{{r_{f,y\prime ,b}}} } \over {\sum\limits_{b\prime } {\left( {\theta \,\widehat {\Pr }\left( {B = b\prime } \right) + \sum\limits_{y\prime \ne y} \,{{r_{f,y\prime ,b\prime }}} } \right)} }},$$
where
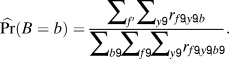 $$\widehat {\Pr }\left( {B = b} \right) = {{\sum\limits_{f'} {\sum\limits_{y\prime } \,{{r_{f\prime ,y\prime ,b}}} } } \over {\sum\limits_{b\prime } {\sum\limits_{f\prime } {\sum\limits_{y\prime } \,{{r_{f\prime ,y\prime ,b\prime }}} } } }}.$$
Our estimates of Pr(D = d) and Pr(B = b) in equations (4) and (6) aggregate over all voters to generate the empirical distributions. Our estimate of Pr(B = b|F = f) in equation (5) averages the birthday distribution specific to each first name f with the overall distribution aggregated over all first names in every year, excluding observations from year y to remove the effect of a specific registrant’s own data when estimating the probability that he or she was born on a given day.Footnote 10
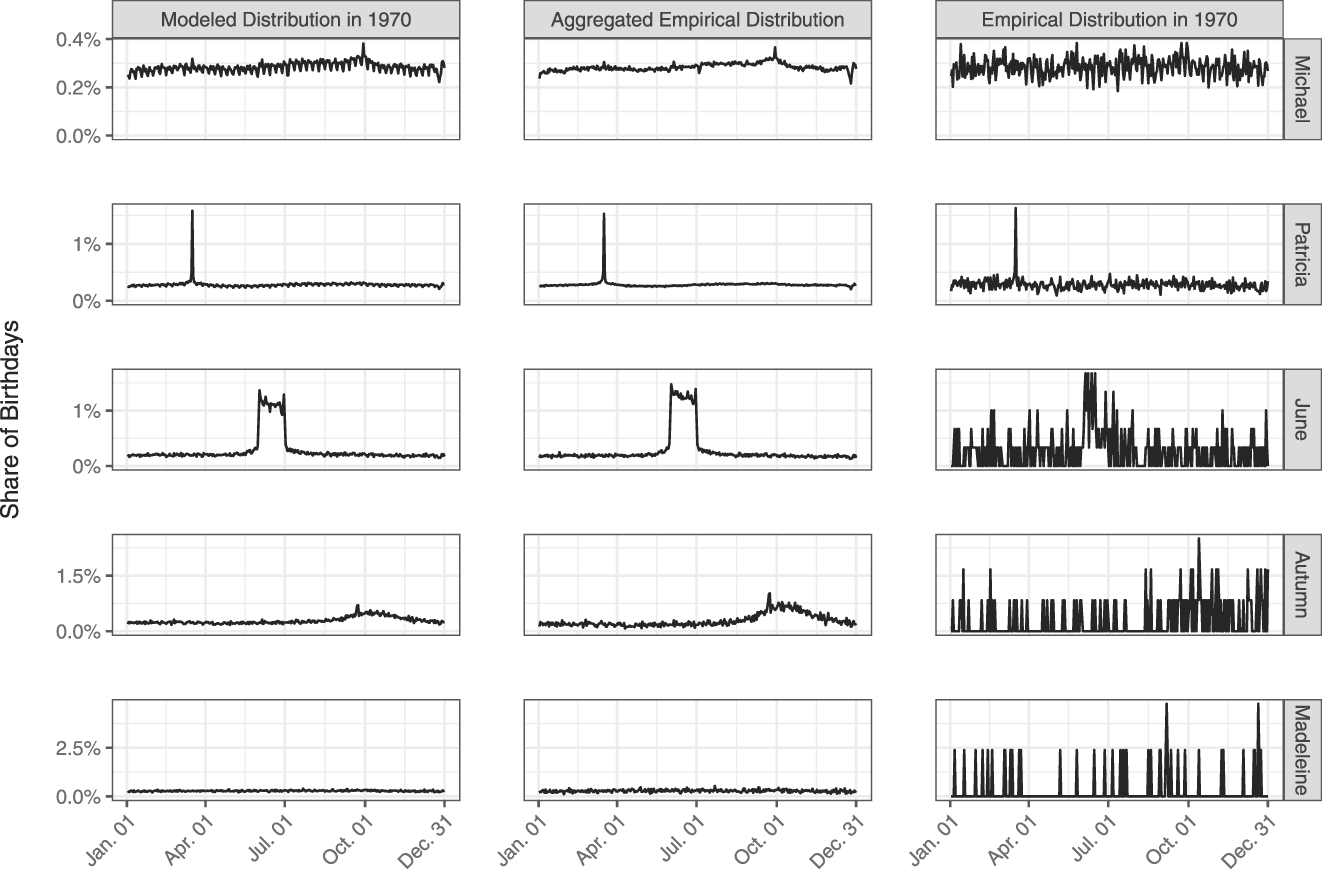
Figure 4 shows the modeled distribution of birthdays of voters born in 1970 for five different first names and how they compare to the empirical distribution of birthdays. The names in the plot are ordered from top to bottom based on their popularity among voters. For names such as Michael, which have a mostly uniform birthday distribution in a year, our model captures day-of-week and seasonal effects well. In addition, for names with nonuniform birthday distributions and different levels of popularity, such as Patricia, June, or Autumn, our method is able to capture the cyclic popularity of the first names. Finally, for highly infrequent names, such as Madeleine, our model captures only aggregate, non–name-specific day-of-week and seasonality trends.
Modeled Distribution of Birthdays for Voters Born in 1970 for Five Different First Names vs. the Empirical Distribution of Birthdays for Voters with Those First Names (Aggregated Across All Years) and the Empirical Distribution of Birthdays for Voters with Those First Names Born in 1970.
Note: Across all years (in 1970), we observe 1,669,641 (39,583) voters named Michael; 894,836 (7,621) voters named Patricia; 60,464 (299) voters named June; 10,956 (120) voters named Autumn; and 7,084 (42) voters named Madeleine.
To investigate the finite-sample properties of our estimator  ${\hat{k}_{f,l,y}}$ in equation (2), we carry out a simulation exercise, described in detail in the Appendix (Section A.5). In brief, we first generate 100 synthetic voter files with a known number of double votes k. We then apply our full statistical procedure, including approximation of the birthday distribution p b|f,l,y, to estimate the number of double votes in each synthetic dataset. Across a range of values for k, we find that our estimation strategy does a good job of recovering the number of double votes (Figure A.5). We further find that our analytic confidence intervals for
 $\hat{k}$ are somewhat conservative. Among the 100 synthetic datasets, the 95% confidence intervals always contained the correct value, and the 80% confidence intervals contained the correct value in 98 of the 100 cases. This pattern is expected as the analytic expression derived in Theorem 1 is an upper bound on the standard error.
Accounting for Measurement Errors
As discussed earlier, voter files often suffer from two significant sources of error. First, the birthdates for some observations are particularly likely to be recorded incorrectly—including those in certain states and those listed as having first-of-the-month birthdates. We accordingly perform our primary analysis on a subset that excludes these records, but that restriction can itself skew estimates if not handled appropriately. Second, a voter file does not provide a completely accurate account of who did and who did not vote in a given election. Such discrepancies may indeed be relatively common; as Minnite (Reference Minnite2010, 7) describes, the “United States has a fragmented, inefficient, inequitable, complicated, and overly complex electoral process run on Election Day essentially by an army of volunteers.”
Here, we describe a statistical procedure to correct both for our sample restriction and for misrecorded votes. But before doing so, it is useful to understand how measurement error can produce the appearance of a double vote. In the run-up to the 2016 election, a local television station reported that Charles R. Jeter, Jr., a North Carolina state representative, voted twice in the 2004 presidential election, once in North Carolina, where he was living at the time, and once in South Carolina, where he grew up. While Jeter had not voted in South Carolina in 2004, his mother had. A poll manager made a mistake and Jeter’s mother signed the poll book next to her son’s “deadwood” registration instead of her own registration on the line (Ochsner Reference Ochsner2016), creating an illusory double vote.
A thought experiment illustrates how errors like these in the recording of votes in a voter file could generate a substantial number of cases of illusory double voting. Imagine a world with 140 million registration records, 100 million of which were used to cast a ballot in an election. If a vote record is mistakenly attached to a nonvoting registration in 1% of the cases, this would result in one million records, or 2.5% of nonvoting registrations, being incorrectly marked as being used to cast a ballot. Some number of these registration records are dormant deadwood registrations of people who moved to, and voted in, a different jurisdiction. Assuming recording errors are assigned randomly, we would generate 2,500 illusory double votes for every 100,000 voters that have a deadwood registration.
To correct for such errors, we assume voter registrations go through a stochastic update process in which each record is duplicated with probability p u and dropped with probability p r. Proposition 2, which is presented in the Appendix, estimates the original number of double voters before the update happened, k orig, based on the number of double voters that end up in the updated sample, K, and the number of vote records in the updated sample, N.Footnote 11 In particular, we have
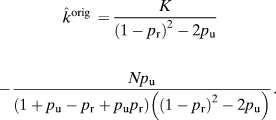 $$\eqalign {\hat{k}^{{\rm{orig}}}} = {K \over {{{\left( {1 - {p_{\rm{r}}}} \right)}^2} - 2{p_{\rm{u}}}}} - {{N{p_{\rm{u}}}} \over {\left( {1 + {p_{\rm{u}}} - {p_{\rm{r}}} + {p_{\rm{u}}}{p_{\rm{r}}}} \right)\left( {{{\left( {1 - {p_{\rm{r}}}} \right)}^2} - 2{p_{\rm{u}}}} \right)}}.$$
To see how equation (7) can be used to account for measurement errors, let f p represent the probability of a false positive, such that a registration record that was not used to cast a ballot nonetheless has a vote record associated with it. Similarly, let f n represent the probability of a false negative, such that a registration record that was used to cast a ballot does not have a vote record associated with it. In addition, let c be the number of cases where a voter has a duplicate registration record in another state and let n be the total number of votes in the election.
In the context of equation (7), p u is the probability of a vote record getting duplicated in the voter file, which corresponds to cases where a deadwood registration for a voter in another state is wrongly recorded as having voted. We can thus set p u to be c(1 − f n)f p/n.Footnote 12 Furthermore, p r is the probability of a vote record getting dropped, which is the same as the false negative rate, and so p r = f n. Finally, K is the number of double voters we observe before adjusting for measurement errors, which can be estimated from Theorem 1.
To carry out this approach, we need an estimate of the number of deadwood registrations for voters (c) as well as the probability of observing false-positive (f p) and false-negative (f n) vote records in a voter file. To estimate deadwood registrations, we follow a procedure similar to the one outlined in Theorem 1, which we detail in Section A.7 of the Appendix. We estimate f n and f p via our Philadelphia audit, as described below.
Equation (7) can likewise be used to adjust for our exclusion of records with suspect birthdates. Specifically, we set the drop rate p r to the proportion of records that were excluded and set the duplication rate p u to 0. In this case, equation (7) simplifies to  ${\hat{k}^{{\rm{orig}}}} = {K / {{{\left( {1 - {p_{\rm{r}}}} \right)}^2}}}$.
RESULTS
Baseline Results
We begin our analysis by excluding observations with data quality issues, as described earlier, to obtain our preferred sample of just more than 104 million vote records. Within our preferred sample, there are 763,133 pairs of 2012 vote records that share the same first name, last name, and DOB. Given our assumptions about p b|f,l,y, we estimate that within our preferred sample there were 21,724 (s.e. = 1,728) double votes cast in 2012 using Theorem 1. Using Proposition 2, we scale the results of our analysis on our preferred sample to account for the observations we excluded. Given that the FEC reported that just more than 129 million votes were cast in the 2012 presidential election (Federal Election Commission 2013), 19.3% of votes were dropped when generating our preferred sample. Equation (7) shows we can accordingly generalize the rate of double voting in the broader population by multiplying the estimated number of double voters in our preferred sample by 1.53. Thus, we estimate there were 33,346 (s.e. = 2,652) double voters in the full population of 129 million voters, or about 1 for every 4,000 voters.Footnote 13
Tables A.3 and A.4 in the Appendix demonstrate the sensitivity of our results to a number of the assumptions we make in our analysis. Table A.3 focuses on sample restrictions, and shows that the estimated number of double votes would be substantially higher if we did not exclude observations with a first-of-the-month birthday,Footnote 14 would be somewhat higher if we kept states despite issues with multigenerational households, and would be similar if we excluded commercially sourced dates of birth. Table A.3 also shows that using our preferred birthday distribution, rather than a uniform distribution, reduces the estimated number of double votes in our preferred sample by approximately 25%. A little under half of this reduction results from accounting for periodicity that affects all first names and a little over half of this reduction results from accounting for name-specific periodicity. Finally, Table A.4 shows that our results are not particularly sensitive to the standardization of the first name and assumptions about the smoothing parameter θ in our birthday distribution function.
Our method produces a substantively different estimate of the rate of double voting than McDonald and Levitt’s (Reference McDonald and Levitt2008) on our preferred sample. McDonald and Levitt’s method generates an estimate of about 200,000 double votes, which is about ten times larger than what we estimate using our method. Most of the difference is because their method fails to account for the higher number of distinct voters who share a common first name, last name, and DOB because of the changing popularity of first names over years. The remainder of the difference is a function of the nonuniformity of the distribution of first names within years that we discussed in the previous paragraph.
Accounting for Measurement Error in Vote Records
We next explore how measurement error in vote records affects our estimates of double voting. As the earlier Charles Jeter example highlighted, it is the combination of voters having a deadwood registration and clerical error in recording vote history that leads to false double votes. In this section, we first provide estimates of deadwood registration. Given this estimate, we then calculate the implied rate of double votes as a function of the amount of measurement error. Finally, we use an audit to calibrate the amount of measurement error.
We observe 1,837,112 pairs in our preferred sample of the voter file in which two registration records in different states shared the same first name, last name, and DOB, and exactly one of them is recorded as having voted. Applying Theorem 2 gives us an estimate of 1,597,732 (s.e. = 22,197) 2012 voters who have a duplicate registration.
Figure 5 shows how our estimate of double voting changes with respect to different hypothetical error rates. If we assume f p = f n = f as the clerical error rate, then we should plug in  ${p_{\rm{u}}} = {{1,597,732 \times f \times \left( {1 - f} \right)} \over {104,206,222}}$ and p r = f in Proposition 2 to correct for measurement error. In the figure, we additionally apply Proposition 2 to scale up our estimates to account for records that we dropped to create our preferred sample. We find that a clerical error rate of 1.3% would be sufficient to explain nearly all the apparent double voting.
How the Estimated Number of Double Votes Changes Based on the Clerical Error Rate
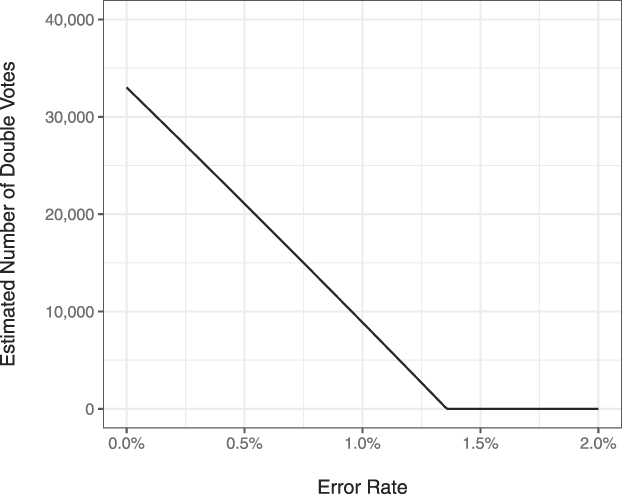
We use our Philadelphia poll book audit data to give a rough approximation of the clerical error rate. Our audit, which is described in more detail in Section A.6 in the Appendix, found that 1% of registrations without a vote record in the poll book nonetheless have an electronic vote record. This suggests that, at a minimum, our unadjusted estimate overstates the incidence of double voting. If our Philadelphia audit were representative of the false-positive rate in the population, Figure 5 indicates that our estimate would drop to about 10,000 double votes, or about 1 double vote per 13,000 votes cast. These audit results, however, are only meant to be illustrative of the false-positive rate in the population.
Multiple notes of caution are discussed in more detail in Section A.6. The false-positive rate in Philadelphia may be larger than the rate in the general population, perhaps because Pennsylvania is known to have more voter file discrepancies (Ansolabehere and Hersh Reference Ansolabehere and Hersh2010), but it may also be smaller because the local office has a large, professionalized, and experienced staff. Furthermore, while a small but growing number of jurisdictions use an electronic poll book to record vote history, Philadelphia’s poll-book-and-bar-code approach likely produces fewer errors than a sign-in sheet with no bar codes, which requires manual entry. Finally, note that we are measuring the translation error between the poll book and the voter file, but that translation error is just one type of possible clerical error. There may be errors in the poll book itself, such as in the Charles Jeter example, that our audit would not detect. For example, Hopkins et al. (Reference Hopkins, Meredith, Morse, Smith and Yoder2017) report that 105 individuals were forced to file a provisional ballot in a recent state election because their registration was wrongly marked in the poll book as having been used to vote earlier in the day. Ultimately, all we can conclude is that measurement error likely explains a sizable portion, and possibly nearly all, of the double votes that we estimated via Theorem 1 under the assumption of no such measurement error.
Model Validation
In the previous subsection, we estimated that about 1 in 35 vote records that shared the same first name, last name, and DOB in our preferred sample of the national voter file were double votes, assuming no measurement error in vote records. In this subsection, we validate our model by presenting the same ratio in the Crosscheck data, using SSN4 to identify double votes between Iowa and the other participating states.
Table 1 looks at the registration pairings identified by Crosscheck based on first name, last name, and DOB in which SSN4 information is available for both records in the match. The incidence of likely double votes—cases in which the SSN4 matched and both registration records were used to cast a ballot—is extremely low. In fact, there are only seven cases in 2012 in which both registration records with the same SSN4 were used to cast a vote. By contrast, there were 1,476 cases in which both registration records with different SSN4s were used to vote. Thus, the probability of a registration pairing sharing an SSN4 conditional on both registrations being used to cast a ballot was about 1 in 200 in 2012. The same quantity in 2014 was about 1 in 300.
Vote Records Among Registration Pairings with Known SSN4s
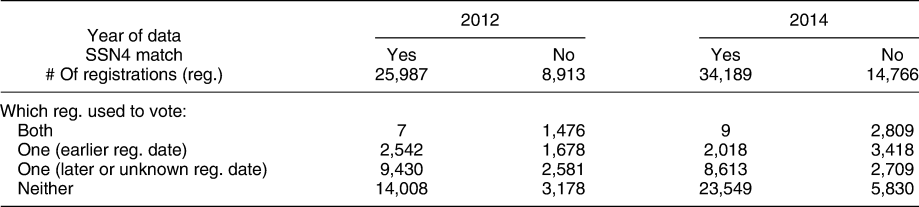
Despite the benefit of SSN4 information, it is important to consider that, as a result, Table 1 relies on a nonrandom subset of potential double registrants. The incidence of double voting may differ between registration records with known and unknown SSN4s. Moreover, the data presented in Table 1 are generated from a nonrandom subset of states. This could be problematic for the purposes of validation to the extent that the incidence of double voting in Crosscheck states is higher or lower than the incidence of double voting in the nation. On the one hand, states that permit no-excuse absentee voting, such as Iowa, seemingly make it easier to cast two ballots than states that do not. A state may also opt in to Crosscheck, in part, because it believes the rate of double voting is higher in the state. On the other hand, states involved in Crosscheck may take more actions than the typical state to deter double voting.Footnote 15
To facilitate a better comparison between our model and Table 1, we use our model to generate a parallel estimate of the number of double votes between Iowa and other Crosscheck states. To do so, we first estimate the number of double votes between all Crosscheck states and then subtract our estimates of (1) the number of double votes between Crosscheck states other than Iowa and (2) the number of double votes within Iowa.Footnote 16 This Crosscheck-specific model estimates that one in 150, or about 0.6%, of vote records with the same first name, last name, and DOB are double votes. Given that Table 1 shows the observed ratio in the Crosscheck data is 0.5%, this lends strong support to our modeling approach.
Implications for Election Administration
Table 1 shows that, based on the subset of pairings with SSN4 data, 70–75% of registrations which match on first name, last name, and DOB are in fact double registrations. Crosscheck recommends canceling the registration with an earlier date of registration in these cases with an SSN4 match, provided there is also middle name consistency (see the Crosscheck participation guide reproduced in Section A.10). Indiana is at least one state that largely codified this practice [Ind. Code Ann. 3-7-38.2-5(d)(2); see generally Com. Cause Indiana v. Lawson, 937 F.3d 944 (7th Cir. 2019)].
Yet, problems remain even when it is known that two registration records belong to the same person partly because states provide different information in the date of registration field. Some states use the voter registration date to represent the date that a registration was initiated, whereas others use it to represent the date a registration was last modified. As a result, the registration record with the earlier registration date is not necessarily the deadwood registration. In particular, the active registration may have the earlier registration date when individuals return to the state where they were previously registered to vote. Imagine a voter who initially registers to vote in state A in 2012, then moves to and votes in state B in 2014, before finally moving back to and voting in state A in 2016. The voter’s date of registration in state A may be the earlier of the two if state A either reactivates the initial registration and does not update the registration date or creates a new registration but nonetheless assigns the voter to their original registration date.
Table 1 confirms that while more single ballots were cast using the registration with the later date of registration in a pair, the registration with the earlier registration date in a pair was used to cast a single ballot 2,542 times. Thus, canceling the record with the earlier registration date would risk impeding more than 300 votes for every double vote prevented.
It is true that, as mentioned earlier, these data focus on a nonrandom subpopulation over which the rate of double voting is potentially particularly low. But even if the number of double votes were five to ten times higher—to reflect the incidence of double voting we estimated in the national voter file—we would still conclude that such a strategy would result in many more impeded votes for every double vote prevented.
A final difficulty implied by Table 1 is that a majority of the potential double registrations identified by Crosscheck have at least one unknown SSN4. In 2012, the full dataset contained 100,140 pairs of registrations with the same first name, last name, and DOB, so the fact that 25,987 pairs had matching SSN4s and 8,913 pairs did not have matching SSN4s means that 65,240, or 65.1%, pairs of registrations had at least one unknown SSN4. Likewise, 64.9% pairs of registrations had at least one unknown SSN4 in 2014.
Thus, although a majority of the pairs identified by Crosscheck appear to be the same person registered in two states, more often than not an election administrator will not have enough information to distinguish between good and bad matches. An administrator who nonetheless believes that aggregate match quality is sufficiently high to justify dropping the registration with the earlier registration date would impede even more votes.
DISCUSSION
The evidence compiled in this article suggests that double voting is not currently carried out in such a systematic way that it presents a threat to the integrity of American elections. We estimate that at most only 1 in 4,000 votes cast in 2012 were double votes, with measurement error in turnout records possibly explaining a significant portion, if not all, of this.
Scholars have been concerned about the (mis)measurement of voter fraud because sometimes the twin goals of improving both electoral integrity and voter accessibility come into conflict. One reason that people disagree about how to run elections is that they focus on either accessibility or integrity, without much consideration of this trade-off. For example, when speaking out against a voter identification law, a Democratic state representative argued that “if even one person is disenfranchised … that will be one person too many” (People For The American Way 2012). Republican Kris Kobach used similar logic but instead contended that “one case of voter fraud is [one] too many” (Lowry Reference Lowry2015). Such statements promote a debate that focuses on maximizing accessibility or integrity, without any consideration for the other dimension.
But many election administration policies fall along a continuum from promoting accessibility, with some potential loss of integrity, to protecting integrity, but potentially disenfranchising legitimate voters. For example, the adoption of absentee ballots made it easier for people to access a ballot, particularly those who are elderly or disabled (Barreto Reference Barreto2006; Miller and Powell Reference Miller and Powell2016), while also introducing new ways through which fraudulent ballots could be cast (Fund Reference Fund2004, 47–50). Likewise, when maintaining voter registration records, there is a trade-off between reducing deadwood and potentially removing legitimate registrations.
This article highlights how emphasizing election integrity when maintaining voter registration records without consideration for voter accessibility is likely to lead to poor election administration. Such list maintenance is particularly necessary in the United States, where a decentralized election apparatus produces duplicate registrations as people move across jurisdictions. But it is also difficult because, as we demonstrate, sparse individually identifying information often makes it hard to definitively conclude whether two registrations belong to the same person, at least without significant investigation. Moreover, even when it is known two registrations belong to the same person, we highlight that it is often not easy to differentiate between the active and deadwood registration, at least using a single variable such as registration date.
Our findings that double voting is not threatening the integrity of American elections may come as a surprise to a number of Americans who report on surveys that double voting is not rare. Stewart III, Ansolabehere, and Persily (Reference Stewart, Ansolabehere and Persily2016) find that about 25% of the public believes that voting more than once happens either commonly or occasionally (as opposed to infrequently or never), whereas another 20% report being unsure how often it happens. Such beliefs are driven, at least in part, by the lack of a clear differentiation in public reporting between (1) registration records that share common observable characteristics, (2) duplicate registrations, and (3) double votes. For example, in 2013, Crosscheck circulated Figure A.6 in the Appendix which reported that it had identified 1,395,074 “potential duplicate voters”—registration records with a common first and last name and DOB, per (1)—among the 15 states participating in the program at the time. Our analysis of the 100,140 records flagged in Iowa in 2012 allows us to better understand how many of these pairings represented duplicate registrations and how many of these duplicate registrations actually produced double votes. Of the 34,900 pairings in which the SSN4 is known for both records, 25,987 had the same SSN4. We thus estimate that roughly three-quarters of the registrations flagged by Crosscheck were, in fact, duplicate registrations, although election administrators often lack the necessary SSN4 to determine whether a particular match is good or bad. More importantly, fewer than 10 of the known 25,987 duplicate registrations were used to cast a ballot twice. This shows that there can be a large number of registration records that share common observable characteristics and duplicate registrations, without almost any double votes. Reporting the first two quantities in place of the last risks confusing the public about the integrity of American elections.
SUPPLEMENTARY MATERIAL
To view supplementary material for this article, please visit https://doi.org/10.1017/S000305541900087X.
Replication materials can be found on Dataverse at: https://doi.org/10.7910/DVN/QM15HX.




Comments
No Comments have been published for this article.