





1. Introduction
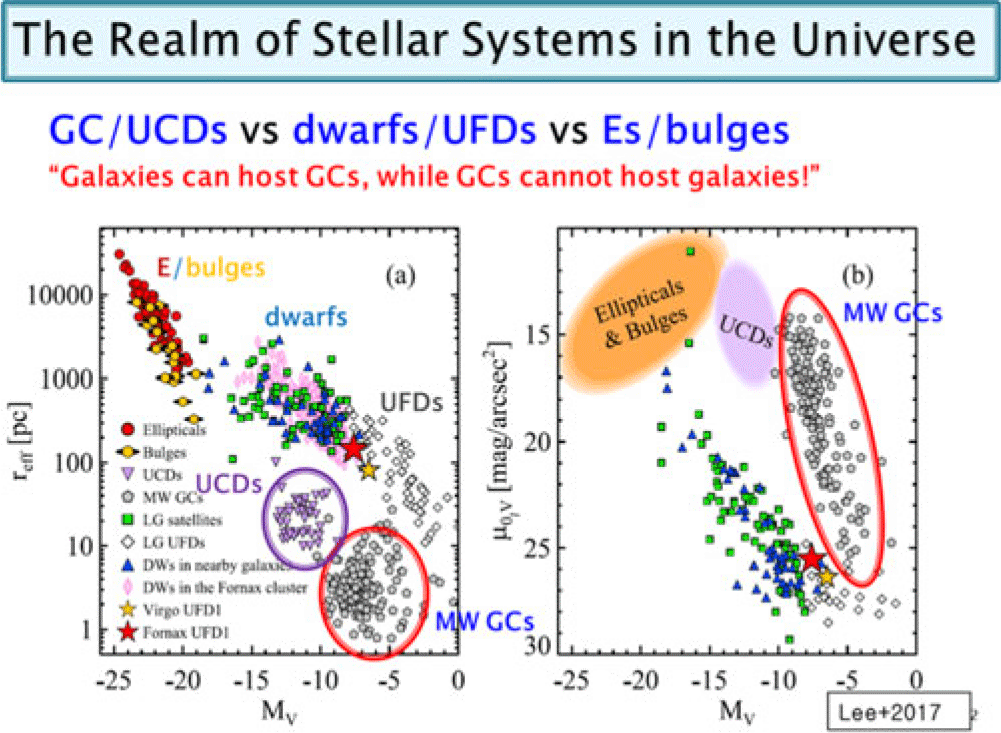
Globular clusters are an old, compact, massive stellar system that appears to be an extended round source in the images of the local universe, and to be a point source in the images of the distant universe. Fig. 1 displays the realm of the diverse stellar systems found in the local universe, in terms of the scaling relations: elliptical galaxies, bulges in spiral galaxies, dwarf galaxies, ultra-faint dwarfs (UFDs), globular clusters in the Milky Way Galaxy and ultracompact dwarfs (UCDs). In the figure two sequences are noted: one is a galaxy sequence including galaxies and bulges, and the other is a star cluster sequence including the globular clusters and UCDs. The globular clusters (
 $r_{\rm eff}=1-10$
pc) are much smaller than the galaxies with similar luminosity. It is also noted that the UCDs are separated from the globular clusters and from the galaxies. The UCDs are slightly brighter and larger than the globular clusters, but they are also much smaller than the galaxies with similar luminosity. Thus the globular clusters and UCDs belong to the same sequence. In the sky the central surface brightness of the Milky Way globular clusters varies by more than ten magnitudes.
Scaling relations ((a) effective radius vs. absolute V-band magnitude (
 $M_V$
), and (b) V-band central surface brightness vs.
 $M_V$
) of diverse stellar systems in the universe. The large red circle and purple circle denote the locations of the Milky Way globular clusters and the ultracompact dwarfs (UCDs), respectively. Other symbols represent various types of galaxies in the local universe: elliptical galaxies, bulges in spiral galaxies, dwarf galaxies, and ultra-faint dwarf galaxies (UFDs). (Figure source: Fig. 4 of Lee et al. (Reference Lee, Jang and Beaton2017)).

It is sometimes difficult to distinguish between the globular clusters and the dwarf galaxies. A common wisdom to distinguish them is to remember: globular clusters can be hosted by a galaxy, but any galaxy cannot be hosted by a globular cluster. A fundamental difference between the globular clusters and the galaxies is their size.
Globular clusters are found not only in the Milky Way but also beyond the Milky Way, from nearby galaxies to distant galaxy clusters. The globular clusters can be divided into two types according to their location: galactic globular clusters (groups) which are gravitationally bound to a galaxy, and intracluster (or intragroup) globular clusters (IGCs) which are found between galaxies in a galaxy cluster (galaxy group).
Globular clusters belong to the densest stellar systems among the known stellar systems. The central surface stellar density of the globular clusters reaches as high as
 $10^6 M_\odot/$
pc
 $^2$
. They host a number of diverse compact objects and binaries, including black holes and neutron stars. These compact objects and binaries are important sources of gravitational wave radiation (Abac et al. Reference Abac, Abramo and Albanesi2025). Globular clusters are also an excellent probe to investigate the formation and evolution of galaxies as well as galaxy clusters. Historically globular clusters were considered to be a simple and boring system in the old days. However it turns out recently that they are much more complicated, becoming a very intriguing system.
2. Today’s Globular Clusters in the Milky Way Galaxy
There are about 200 globular clusters in the Milky Way Galaxy, and new globular clusters continue to be discovered (Harris Reference Harris2010; Ryu & Lee Reference Ryu and Lee2018; Saroon et al. Reference Saroon, Dias and Minniti2024). Their mass ranges from
 $M_{\rm GC}=10^4 M_\odot$
to
 $10^6 M_\odot$
. Because of their proximity, these globular clusters are the best targets to investigate the details of various aspects of the globular clusters. They are therefore an excellent laboratory to study the nature of compact objects and binaries in relation with gravitational wave observations as well as dynamics of dense stellar systems and stellar evolution.
2.1. Compact Objects and Binaries in the Milky Way Globular Clusters
Below are some notable examples of the Milky Way globular clusters which host compact objects and binaries. Fig. 2 displays the images of two interesting Milky Way globular clusters: Ter 5 and 47 Tuc (NGC 104). Ter 5 is a very metal-rich ([Fe/H] = –0.2) globular cluster with a mean luminosity (
 $M_V=-7.4$
mag) located in the Galactic bulge. 47 Tuc is the second brightest globular cluster (
 $M_V=-9.4$
mag).
HST color images of the two interesting Milky Way globular clusters: (a) Ter 5 and (b) 47 Tuc. They host the largest number of MilliSecond Pulars (MSPs, including isloated ones and binaries)) and low mass X-ray binaries (LMXBs) among the known globular clusters.

Figure 2 Long description
Two scatter plots compare different stellar systems in the universe. Panel A: A scatter plot of effective radius (r_eff) in parsecs versus absolute V-band magnitude (M_V). The plot includes various symbols representing elliptical galaxies, bulges, dwarf galaxies, ultracompact dwarfs (UCDs), and ultra-faint dwarf galaxies (UFDs). A large red circle denotes the location of Milky Way globular clusters, and a purple circle denotes UCDs. Panel B: A scatter plot of V-band central surface brightness (mu_v) in magnitudes per square arcsecond versus M_V. The plot includes similar symbols and circles as in Panel A, with an ellipse highlighting the region of Milky Way globular clusters.
These two globular clusters host the largest numbers of millisecond pulsars (MSPs, isolated ones and binaries) and low mass X-ray binaries (LMXBs) among the known globular clusters. Freire (2025; https://www3.mpifr-bonn.mpg.de/staff/pfreire/GCpsr.html) lists 345 pulsars in 45 Milky Way globular clusters. A quarter of these known pulsar populations are found in these two globular clusters. It remains to be understood why these two globular clusters host the largest number of MSPs and LMXBs.
Another important example is
 $\omega$
Cen (NGC 5139), the brightest (
 $M_V=-10.3$
mag) and largest globular cluster in the Milky Way. Fig. 3 displays the HST color images of
 $\omega$
Cen. It shows complex stellar populations and kinematics. It is considered to be a good example of the stripped nucleus of an accreted dwarf galaxy. Recently using 500 HST images obtained over 20 years Häberle et al. (Reference Häberle, Neumayer and Seth2024) measured the velocities of seven fast-moving stars at
 $r\lt0.8$
pc and derived a mass of the central black hole. They obtained
 $M_{BH}\gt8200 M_\odot$
, showing that this cluster hosts an intermediate mass black hole (IMBH). This IMBH in a globular cluster is very useful to understand the diverse origin of the IMBHs.
HST color image of
 $\omega$
Cen, the brightest globular cluster in the Milky Way, with two-step zooming-in of the central region. The small circle in the right panel shows the location of the intermediate-mass black hole (IMBH) with
 $M_{BH}\gt8200 M_\odot$
(Häberle et al. Reference Häberle, Neumayer and Seth2024).

Stellar mass black holes are also discovered in the globular clusters (see Giesers et al. (Reference Giesers, Dreizler and Husser2018) and references therein). Strader et al. (Reference Strader, Chomiuk and Maccarone2012) used the relation between 8.4 GHz radio luminosity and 3-9 kev X-ray luminosity for the sources in M22, a metal-poor bulge globular cluster with a large core. They found two black holes with
 $M_{BH}=10-20 M_\odot$
. Also they estimated the total number of such black holes in this globular cluster to be
 $N(BH)=5-10$
. This implies that more stellar mass black holes can be discovered in the Milky globular clusters.
2.2. Ages of the Milky Way Globular Cluster
Some of the eminent questions about the globular clusters today are: When and where did globular clusters form? Are the globular clusters a main source for reionization? What is the origin of the multiple stellar populations in the Milky Way globular clusters? One key element to answer these questions is the ages of the nearby globular clusters. Ages of the nearby globular clusters can be estimated using the isochrone fitting method with color-magnitude diagrams of the resolved stars. In the case of distant globular clusters, their ages can be derived from the spectral fitting of the integrated spectra of the globular clusters.
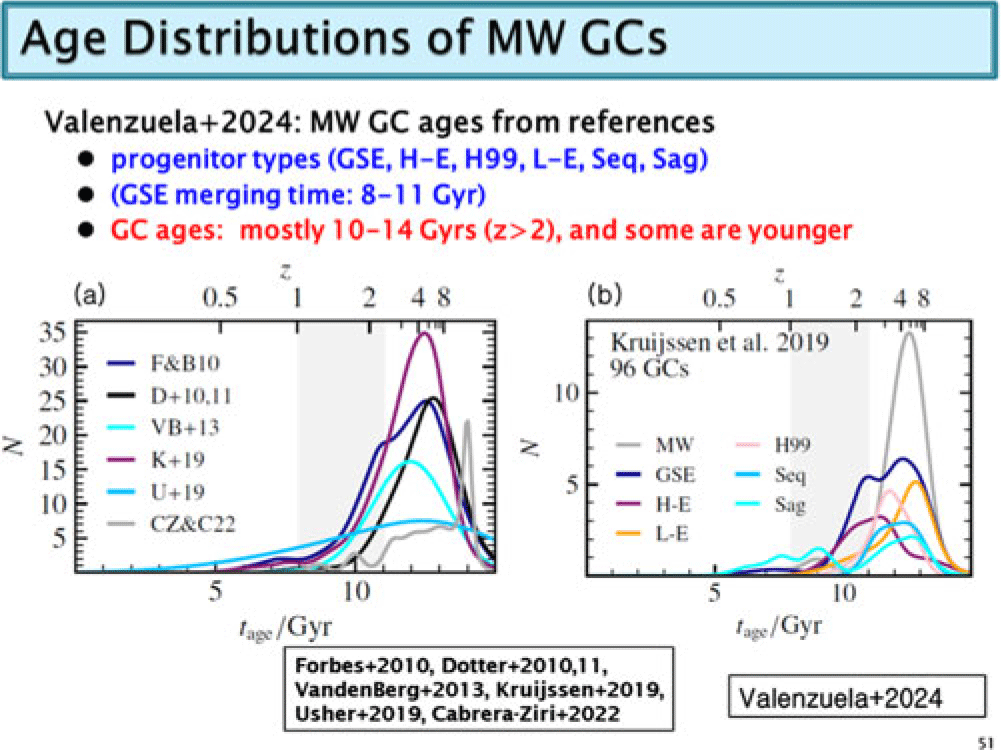
Fig. 4 displays the age distributions of the Milky Way globular clusters in the references compiled recently by Valenzuela et al. (Reference Valenzuela, Remus and McKenzie2024) (see the original references therein): (a) according to the age references, and (b) according to the subgroups. Notable features in this figure are: (a) There is a major component with a peak at 13 Gyr (
 $z \approx 6$
). (b) A majority of the globular clusters are older than 10 Gyrs (
 $z\gt2$
). (c) There is a minor component with a peak at 7 Gyr (
 $z\approx 2$
). (d) The Gaia Sausage/Enceladus GCs show two possible components at 10.5 Gyr and 12.5 Gyr. These results show that a majority of the Milky Way globular clusters formed 13 Gyrs ago, but over an extended period, 10–14 Gyr. Some of the globular clusters formed much later. Globular clusters in some substructures formed at different epochs. The age spread of the globular clusters indicates that they formed in different hosts or at different epochs, enabling us to derive the cluster formation history and the merger history of the Milky Way.
Age distributions of the Milky Way globular clusters compiled in Valenzuela et al. (Reference Valenzuela, Remus and McKenzie2024): (a) according to the age references, and (b) according to the subgroups (GSE for the Gaia-Sausage/Enceladus GCs, H-E for unassociated high-energy GCs, L-E for unassociated low-energy GCs, H99 for the Helmi Streams, Seq for the Sequoia GCs, and Sag for the Sagittarius GCs). The purple line in (left panel) and the gray line in (right panel) denote the mean distribution for the globular clusters given in Kruijssen et al. (Reference Kruijssen, Pfeffer and Reina-Campos2019) (Figure source: Figure A1 and A2 of Valenzuela et al. (Reference Valenzuela, Remus and McKenzie2024)).

3. Globular Cluster Systems in M31, A Twin of the Milky Way Galaxy
M31 is a twin of the Milky Way Galaxy, and these galaxies are two main hosts of the Local Group. Interestingly the estimated number of the globular clusters in M31 is about 1000, much larger than that of the Milky Way globular clusters (Galleti et al. Reference Galleti, Bellazzini and Buzzoni2009), although the masses of the two galaxies are not much different. M31 is an ideal target to investigate the overall structure of the globular cluster system in a spiral galaxy.
Using the catalog of 612 globular clusters (456 old globular clusters with ages
 $\gt3$
Gyr and 156 young globular clusters with ages
 $\lt3$
Gyr, Lee et al. (Reference Lee, Park and Hwang2014) presented the spatial distribution and kinematics of the old globular clusters in Fig. 5. The metal-rich ([Fe/H]
 $\gt-0.9$
) globular system shows a strong central concentration around the M31 bulge region, and is more compact than the metal-poor ([Fe/H]
 $\lt-0.9$
) globular cluster system. The metal-rich globular system shows a fast rotation, while the metal-poor globular system shows a slow rotation.
(Upper panel) Spatial distribution of the old metal-rich (red symbols) and metal-poor (blue symbols) globular clusters in M31. (Lower panel) Relative velocity vs. galactocentric distance along the major axis of the metal-rich and metal-poor globular clusters. Blue contours represent the number density of the metal-poor globular clusters and red and yellow contours are for the metal-rich globular clusters (Lee et al. Reference Lee, Park and Hwang2014). (Figure source: Figure 1 of Lee et al. (Reference Lee, Park and Hwang2014)).

Lee et al. (Reference Lee, Park and Hwang2014) suggested a scenario for the formation of M31 based on these results. First the metal-rich halo including the bulge formed through major merger, leading to a rotating system. The outer part of the metal-poor halo continued to grow via accretion of dwarf galaxies and globular clusters. The disk formation followed the formation of the bulge and halos.
4. Globular Clusters in NGC 4993 with a Gravitational Wave Source
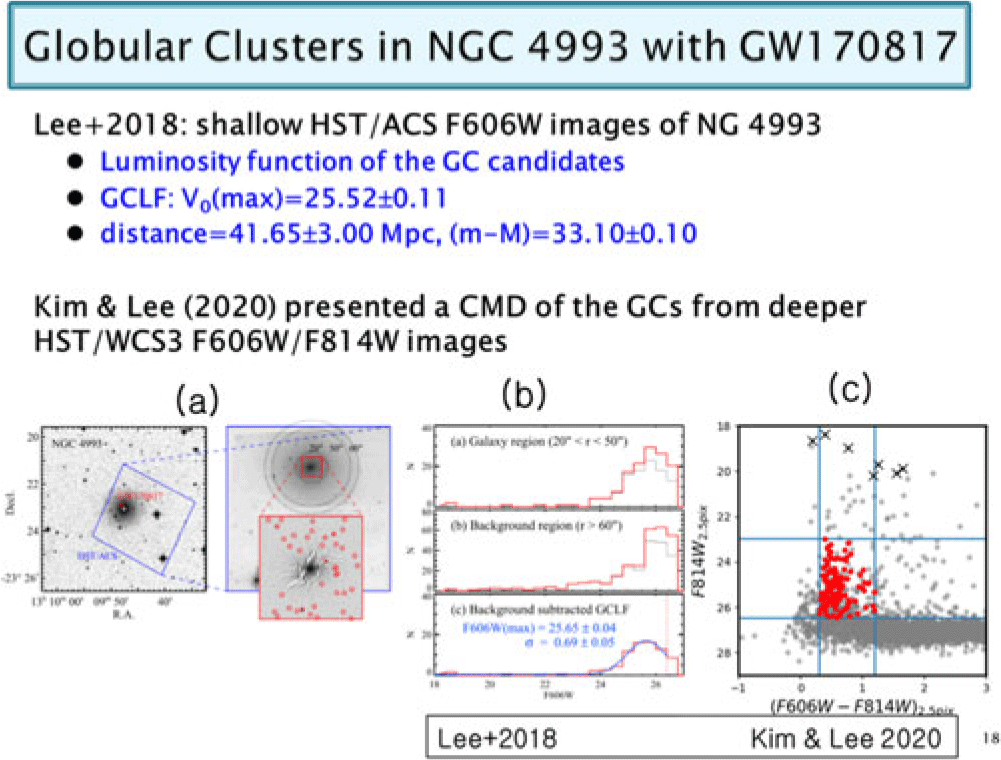
NGC 4993 used to be a typical elliptical galaxy showing multiple shells. However, it became a very unique and precious galaxy today in the sense that it is, to date, the only galaxy where a gravitational wave source is identified with an electomagnetic wave source. On August 17, 2017, GW170817, a gravitational wave source, was detected, which was identified with a gamma ray burst, GRB170817a, and later with an optical kilonova AT2017gfo (Abbott et al. 2017a, b). GW170817 tells us about the last moments when a binary pair of neutron stars merged. GW170817 is very close to the center of NGC 4993, as displayed in Fig. 6.
Globular clusters in NGC 4993 where GW170817, a gravitational wave source (binary neutron stars), was detected. At the same location, the gamma ray burst GRB170817A and the kilonova AT2017gfo were detected. (a) Location of the globular cluster candidates (red symbols) detected in the HST/ACS F606W images of NGC 4993. (b) F606W-band luminosity function of the globular cluster candidates. The bottom panel displays the results after subtracting the background contribution. (c) (F606W-F814W) vs. F814W magnitude diagram of the point sources detected in the deeper HST/WCS3 images. The red symbols denote the globular cluster candidates. (Figure sources: Figures 1 and 5 in Lee et al. (Reference Lee, Kang and Im2018) and Kim & Lee (Reference Kim and Lee2020)).

Lee et al. (Reference Lee, Kang and Im2018) detected globular cluster candidates in the HST/ACS/F606W image of NGC 4993, as shown in Fig. 6. Then they derived a F606W luminosity function of the globular clusters, and estimated the distance to this galaxy from the peak luminosity of the globular clusters:
 $d=41.65\pm3.00$
Mpc, which is consistent with other distance estimates in the literature. Later Kim & Lee (Reference Kim and Lee2020) presented a color-magnitude gram of the point sources detected in the deeper HST/WFC3 F606W/F814W images, as shown in Fig. 6. The red symbol sources are mostly globular clusters of this galaxy.
Is GW170817 associated with any globular cluster in NGC 4993? Later Fong et al. (Reference Fong, Blanchard and Alexander2019); Kilpatrick et al. (Reference Kilpatrick, Fong and Blanchard2022) tried to estimate the possibility that the progenitor of AT2017gfo is in any globular cluster. They used the deepest HST images obtained from 2017 and 2021 and the globular cluster luminosity function (Lee et al. Reference Lee, Kang and Im2018), and concluded that there is little chance that AT2017gfo is associated with any globular cluster.
5. Globular Clusters in Galaxy Clusters
There are two types of globular clusters in galaxy clusters (and groups). One is the galactic globular clusters which are bound to galaxies, and the other is the intracluster (intragroup) globular clusters which are found between galaxies. The intracluster globular clusters are governed by the gravitational potential of their host galaxy cluster, rather than that of any galaxy.
Globular clusters are found from nearby galaxy clusters to distant galaxy clusters. The nearest sample is the Virgo cluster at the distance of 16.5 Mpc. Fig. 7 displays the spatial distribution of the bright globular clusters in the entire Virgo cluster(Lee et al. Reference Lee, Park and Hwang2010). The largest component of the globular clusters is seen at the Virgo core, and several smaller substructures are also noted around galaxy groups. A deep image of diffuse stellar light in the Virgo core (Mihos et al. (Reference Mihos, Harding and Feldmeier2005)) is also shown for comparison. The spatial distribution of the intracluster globular clusters is consistent with that of the diffuse intracluster light. A majority of the intracluster gblular clusters in the outer region of Virgo are metal-poor, indicating that their major origin is low-mass dwarf galaxies (Lee et al. Reference Lee, Park and Hwang2010; Ko et al. Reference Ko, Peng and Côté2022). However it is noted also that there exist some metal-rich intracluster globular clusters, showing that another origin of these globular clusters is massive galaxies.
Spatial distribution of the globular clusters in the Virgo cluster (middle panel) (Lee et al. Reference Lee, Park and Hwang2010). The right panels show the images of M49, the brightest galaxy in the Virgo cluster and M80, the Milky Way globular cluster. The left panel displays the distribution of diffuse stellar light in the central region of the Virgo cluster (Mihos et al. Reference Mihos, Harding and Feldmeier2005).

With the advent of the HST and James Webb Space Telescope (JWST), the surveys of intracluster globular clusters have been extended to more distant galaxy clusters (see, e.g., Lee et al. (Reference Lee, Bae and Jang2022); Berkheimer et al. (Reference Berkheimer, Windhorst and Harris2025) and references therein).
One example is SMACSJ0723.3-7327 (SMACS 0723) which is a massive galaxy cluster at
 $z=0.39$
. Fig. 8 displays the JWST/NIR images of the central region of SMACS 0723(Pontoppidan et al. Reference Pontoppidan, Barrientes and Blome2022). In the figure the point sources in the cluster core region (marked by the large ellipse) are mostly globular clusters in SMACS 0723. In addition, the left rectangle shows a small number of red compact sources aligned along the long red galaxy. This long red galaxy is a gravitationally lensed image of the Sparkler galaxy at
 $z=1.38$
. These red compact sources are globular clusters of the Sparkler (Mowla et al. Reference Mowla, Iyer and Desprez2022), showing the younger stage of the globular clusters. Thus massive galaxy clusters like SMACS 0723 enable us to investigate not only the intracluster globular clusters but also the globular cluster-like sources in the lensed images of the background galaxies at high redshifts.
JWST color image of the central region of SMACSJ0723.3-7327, a massive galaxy cluster at
 $z=0.39$
(Pontoppidan et al. Reference Pontoppidan, Barrientes and Blome2022). The yellow point sources inside the large ellipse are mostly globular clusters of the galaxy cluster at
 $z=0.39$
(Lee et al. Reference Lee, Bae and Jang2022), while the red point sources are distant globular clusters in the Sparkler, a gravitationally lensed galaxy at
 $z=1.38$
(Mowla et al. Reference Mowla, Iyer and Desprez2022).

Fig. 9 displays a comparison of spatial distributions of stellar light, globular clusters (Lee et al. Reference Lee, Bae and Jang2022), dark matter mass based on the gravitational lensing analysis (Mahler et al. Reference Mahler, Jauzac and Richard2023), and CXO X-ray emission in SMACS 0723. The spatial distributions of the globular clusters are similar to those of the diffuse stellar light and lensing mass, but they show a notable difference from the X-ray map (Lee et al. Reference Lee, Bae and Jang2022).
Comparison of spatial distributions of diffuse stellar light, globular clusters, dark matter mass based on the gravitational lensing analysis, and X-ray emission in SMACS 0723. (a) JWST color image of the stellar light. (b) the yellow contours denote the number density map of the globular clusters (Lee et al. Reference Lee, Bae and Jang2022). (c) The pseudo color map denotes the relative mass distribution derived from strong lensing analysis (Mahler et al. Reference Mahler, Jauzac and Richard2023), while the contour lines show the globular cluster map. (d) The pseudo color map denotes the X-ray luminosity based on the CXO image. while the contour lines show the globular cluster map. (Figure source: Lee et al. (Reference Lee, Bae and Jang2022)).

6. Proto-globular clusters at High redshift
When and where did the globular clusters form? Critical clues to answer these questions are being provided by the recent JWST observations of gravitationally lensed galaxies at high redshift. Gravitational lensing enables us to see fainter and smaller objects, and new discoveries of the compact stellar systems at
 $z=1-12$
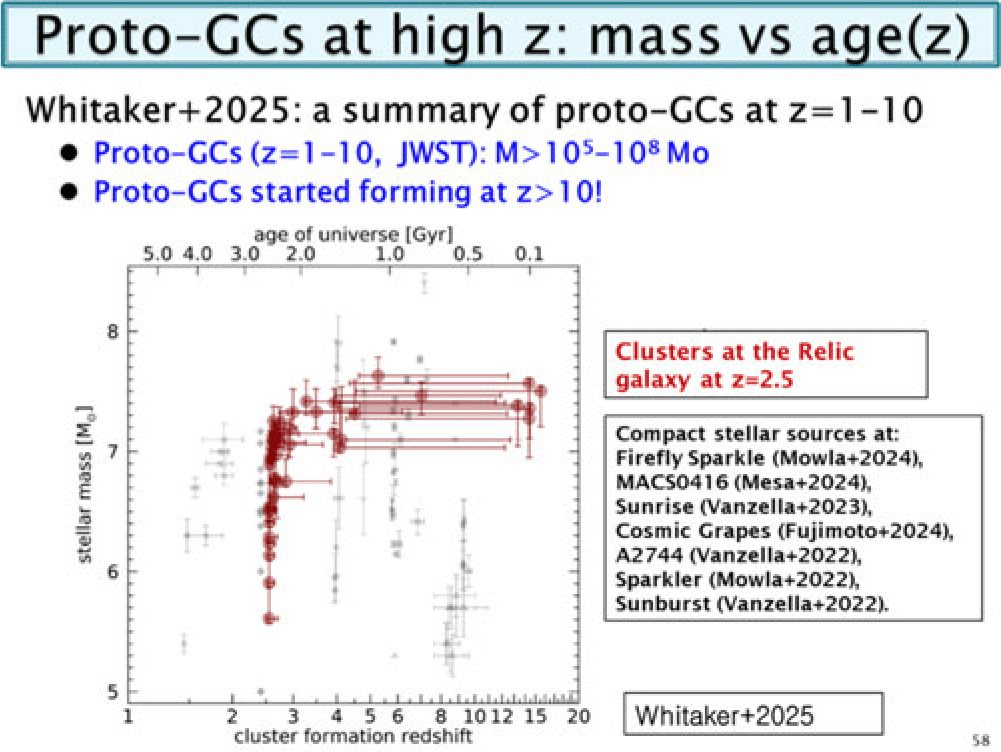
from the JWST observations are being made (see Adamo et al. (Reference Adamo, Atek and Bagley2025) and references therein). Fig. 10 displays stellar mass vs. redshift (and corresponding age) of the compact stellar objects in lensed galaxies and galaxy clusters at high redshifts (Firefly Sparkle, MACS0416, Sunrise, Cosmic Grapes, A2744, Sparkler, and Sunburst), summarized by Whitaker et al. (Reference Whitaker, Cutler and Chandar2025) (see the original references for individual sources). The formation ages of these compact stellar systems are 0.1 to 4 Gyr showing the compact stellar systems started forming within the first Gyr. These ages are consistent with ages of the old Milky Way globular clusters. The stellar masses of these compact stellar systems are
 $10^5 \lt M/M_\odot \lt 10^8$
, much larger than the current masses of the Milky Way globular clusters. Thus these compact stellar systems are considered to be the progenitors of the old globular clusters in the local universe.
Stellar mass vs. cluster formation redshift (age of the universe in the top axis) of the compact stellar systems in the lensed high-redshift galaxies found from the recent JWST observations (gray symbols). The marron circles denote the clusters in the Relic galaxy at
 $z=2.5$
(Whitaker et al. Reference Whitaker, Cutler and Chandar2025). (Figure source: Fig. 7 of Whitaker et al. (Reference Whitaker, Cutler and Chandar2025)).

7. Summary
Globular clusters are ubiquitously found from the local universe to the distant universe. They are found from dwarf galaxies to giant galaxies. They are not only in galaxies, but also in galaxy clusters (galaxy groups). They host a large number compact objects and binaries, being a potential target of gravitation wave observations. A majority of the Milky Way globular clusters formed about 13 Gyr ago (at the corresponding redshift
 $z\approx 6$
) and some later. It is consistent with recent JWST observations of lensed high-redshift galaxies. The massive compact stellar systems at high redshift (
 $z=1-10$
) found from the recent JWST observations are probably the progenitors of the old globular clusters in the local universe. It is remarkable that we are today witnessing young globular clusters forming in the high redshift galaxies, as well as the ancient globular clusters in the Milky Way!
Acknowledgements
This work was supported by the National Research Foundation grant funded by the Korean Government (RS-2024-00340832).
 MV
 MV


 ω
 MBH>8200M⊙



 z=0.39
 z=0.39
 z=1.38

 z=2.5

 Open access

