Introduction
The cow's individual feed intake and, consequently, feed efficiency are traits with a high economic value for the farmer. Even a small improvement in efficiency will have a major effect for the farmer (Lassen et al. Reference Lassen, Thomasen, Hansen, Nielsen, Olsen, Stentebjerg, Hansen, Søren and Blair2018). Information about the feed intake of a specific cow defines its effectiveness in terms of feed conversion (NRC, 2001, 2007; Volden, Reference Volden2011). Since cattle feed is a significant portion of farm expenses, recognizing and replacing inefficient cows can increase a farm's overall feed efficiency (Vandehaar, Reference Vandehaar1998; Herd et al. Reference Herd, Archer and Arthur2003; Buza et al. Reference Buza, Holden, White and Ishler2014; Halachmi et al. Reference Halachmi, Meir, Miron and Maltz2016). In addition, changes in feed intake may reflect health status or diet fluctuations (Gonzalez et al. Reference Gonzalez, Tolkamp, Coffey, Ferret and Kyriazakis2008).
Nowadays, feed intake measuring systems utilize individual weighing stations including electronic scales in the feeding stalls to measure the feed consumed by each cow. These weighing systems have been used by numerous researchers, such as Bach et al. (Reference Bach, Iglesias and Busto2004); Chapinal et al. (Reference Chapinal, Veira, Weary and von Keyserlingk2007); DeVries et al. (Reference DeVries, von Keyserlingk, Weary and Beauchemin2003); Ferris et al. (Reference Ferris, Keady, Gordon and Kilpatrick2006); Halachmi et al. (Reference Halachmi, Edan, Maltz, Peiper, Moallem and Brukental1998); Krawczel et al. (Reference Krawczel, Klaiber, Thibeau and Dann2012); Mendes et al. (Reference Mendes, Carstens, Tedeschi, Pinchak and Friend2011), but as yet have not been applied in commercial barns. Self-designed weighing systems as well as commercial systems (Wang et al. Reference Wang, Nkrumah, Li, Basarab, Goonewardene, Okine, Crews and Moore2006; Stajnko et al. Reference Stajnko, Vindiš, Marjan and Maksimiljan2015) have been developed and are marketed to research institutions. However, their prices are too high for most farmers, and they are used almost exclusively for research purposes. In addition, the weighted feed containers often require additional infrastructure and time consuming maintenance, e.g. cleaning the containers, cleaning the feed remains near and below the containers, adapting the feed distribution system or elevating the distribution wagon.
A camera-based method for feed mass evaluation utilizes an image processing algorithm instead of weighing stations. Camera-based evaluations in dairy housing were done either visually with the help of specific lighting conditions (Shelley, Reference Shelley2013), by applying Light Detection and Ranging (LIDAR) sensing methods (Shelley et al. Reference Shelley, Lau, Stone and Bewley2016) or 3D Time-of-Flight camera when shielded from sunlight (as sunlight contains infrared light naturally) (Borchersen et al. Reference Borchersen, Hansen and Borggaard2018; Lassen et al. Reference Lassen, Thomasen, Hansen, Nielsen, Olsen, Stentebjerg, Hansen, Søren and Blair2018). However, because of the sensitivity to sun light and other reasons, these camera-based evaluation systems are not yet implemented in commercial farms. Unlike the 3D and LIDAR methods, photogrammetry (Mikhail et al. Reference Mikhail, Bethel and McGlone2001) creates a 3D model of the object surface using a number of pictures of the object, taken from various perspectives by RGB (red, green, blue) cameras placed in different locations. This is possible because RGB pictures are less sensitive to sunlight. Specialized software is used to process the images. Features (tie points) that are common to a number of pictures are identified and triangulated to find their coordinates in the space photographed. The result is a point cloud of the animal feed heap surface, which is then used to estimate the feed volume. The feed volume together with feed density is then used to estimate feed mass, i.e. cow feed intakes in kilograms. The goal of this study was to develop a photogrammetry system for evaluating an individual's cow feed intake, and test the best system accuracy and the accuracy under typical cowshed conditions with low cost equipment. We addressed the hypothesis that the proposed photogrammetry method can estimate the feed mass with an error of less than 0·5 kg for feed heaps up to 7 kg.
Material and methods
Sensitivity analysis; factors influencing the photogrammetry's precision
A number of factors affect the precision of the considered method. The controlled factors include input, i.e. the number and quality of feed images, environmental conditions (lighting, possible sites and angles from which to photograph) sensors (camera type and resolution) and the software used to model the feed heap, scale and trim the images and background and calculate volume. In this study, a number of experiments were conducted to measure the effect of the following controlled factors on the precision of the feed mass evaluation: camera type, lighting conditions, display resolution and number of images. The purpose of each experiment is described below.
The feed density is uncontrolled, varies over time, and depends on the level of humidity, the feed ingredients and the processing time in the mixing wagon.
Camera type experiment
Cameras differ by their quality, resolution and cost. A tradeoff exists between the camera quality, which affects the precision with which the feed is measured, and the camera's cost, which influences the number of cameras along the feed lane. The following three cameras were tested.
(1) The Nikon D7000 is of high quality (resolution 2464 × 1632, sensor size 23·6 × 15·6 mm), though it is expensive and unsuitable for outdoor use.
(2) The GoPro Hero 3 wide range action camera (resolution 4608 × 3456, sensor size 4·5 × 3·4 mm), which is suitable for outdoor use. However, it has a fish eye distortion.
(3) The HikVision DS-2CD2652F-I security camera (resolution 2560 × 1920, sensor size 4·5 × 3·4 mm) is suitable for outdoor use and easy for operation.
Lighting conditions experiment
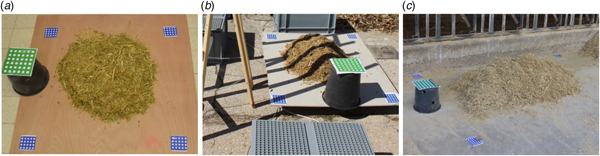
The lighting conditions can vary between cowsheds and can change throughout a day. To simulate the cowshed conditions, three lighting conditions were tested: fluorescent lights (FL), sun (S) and sun with shadows (SS). The FL lighting was provided in a 7 × 10 m room, with ten 50-watt fluorescent lights installed on the ceiling at a height of 4 m (Fig. 1a). FL simulates a closed cowshed (barn) with constant artificial lights. The S and SS experiments were conducted outdoors, simulating the conditions in an open cowshed without walls, where the feeding lanes can be exposed to the sun and shadowed by the cowshed (Fig. 1b); such open-sided barns are common in countries located in warm climates (Halachmi et al. Reference Halachmi, Meir, Miron and Maltz2016).
Different photographing conditions: fluorescent lamps at laboratory (a), sun and shadow strips (b), and the cowshed's feed lane conditions (c).

Display resolution experiment
The display resolution sets the amount of information used by the modelling software, and thus affects the precision of measuring the feed. In this study, the display resolution was defined as the size in millimetres of an object (feed) comprising the image taken by the camera, represented by one pixel. The display resolution depends on the camera's resolution, its aperture angle and the distance between the camera and the object being photographed. The first two parameters are defined by the camera type, discussed above. The distance of the camera from the object depends on the camera's placement in the cowshed. To design an optimal feed measuring system, the display resolution was analysed using the Nikon camera.
Number of images experiment
The number of images of a single node defines the amount of information used by the modelling software and thus affects its precision. This number depends on the location of the cameras. The experiment tested the relationship between the precision of the volume calculation and the number of images used for the modelling. The Nikon camera was used for this part of the study.
Camera locations
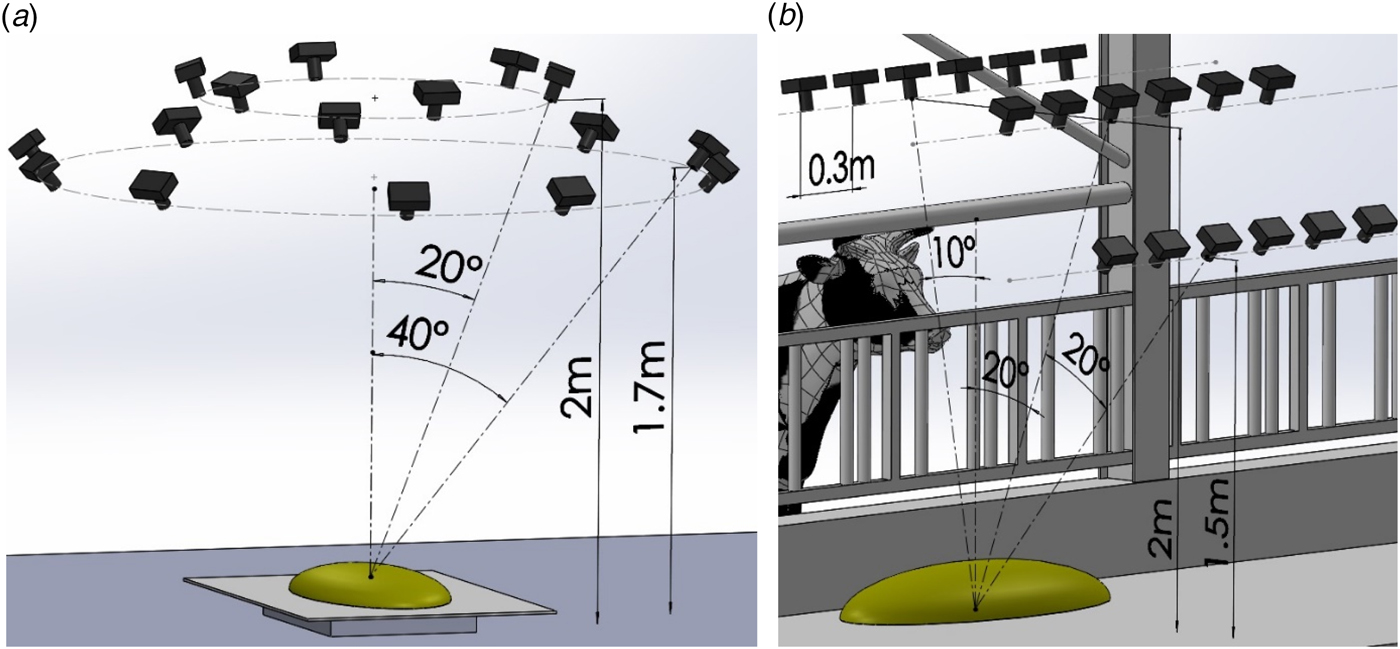
In the laboratory, the camera was uniformly distributed in sixteen locations around the heaps on two heights as shown in Fig. 2a. In the cowshed, the camera was located as shown in Fig. 2b, simulating a camera moving on a rail along the feed lane. Eighteen locations simulated six stops of three cameras with intervals of 0·3 m.
Camera orientation around the cow feed heap (a), and in practice in the cowshed (b).

Variations in the photographing conditions
A number of controlled factors were tested in this study: three different cameras (Nikon, GoPro, HikVision) that had the same display resolution of 1 mm/pixel, three light conditions (FL, S, SS); seven distances (from 2 to 8 m in metre increments) corresponding to the display resolutions 1, 1·4, 1·9, 2·4, 2·9, 3·4, 3·9 mm/pixel and five options for the number of images (8, 10, 12, 16, 32). For each combination of factors, five sets of photographs were taken of the feed heap. The combinations of the controlled factors for each experiment are described in online Supplementary File Table S1.
Experiments in laboratory and cowshed conditions
The correlation between photographed feed volume and measured feed mass was conducted by two experiments: in laboratory and in cowshed. The volume and mass of various feed heaps with different masses and shapes were measured and compared.
The goal of the laboratory experiment was to find the upper-limit (‘best’) precision of the method. Thus, the most suitable conditions were set: FL lighting, uniformly distributed viewpoints around the feed, stable positions using tripod. The photographing distances were 1·7 and 2 m, resulting in 1·2 and 1 mm/pix photographing resolution. 125 feed heaps were tested.
In the cowshed, the actual conditions were tested. The lighting was S and SS type. The photography was performed manually simulating instability and oscillations of a camera driven system. The photographing distances were 2 and 1·5 m resulting in the photographing resolution 1·5 and 1·2 mm/pix. 60 feed heaps were tested.
The mass was weighed using a Yaohua A12 digital scale indicator, with an L6G central load cell (Zemic Europe B.V., Etten-Leur, The Netherlands), precise to 50 g.
Photogrammetry software
In this study, the photogrammetry software, PhotoModeler Scanner (Eos Systems Inc.) was applied. PhotoModeler can process more than 50 images of a modelled body.
Point cloud processing
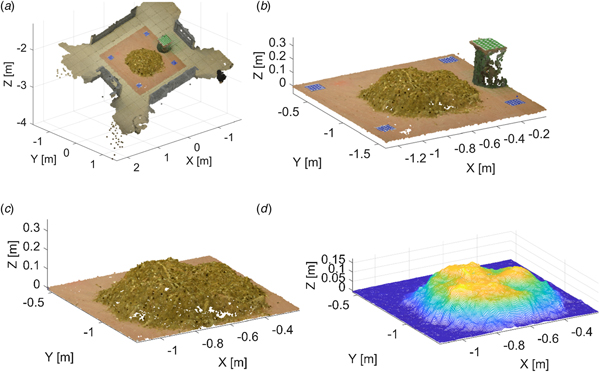
The PhotoModeler produces a point cloud model of the surface of a feed heap. The point cloud was saved as a text file, with the list of the point coordinates and colours, and was processed by an algorithm implemented on MATLAB. To transform the point cloud to the needed location and orientation (plate at the XY plane) and unit (m), easily distinguishable blue and green markers were used as reference points (Fig. 1). The stages of the point cloud processing are presented in Fig. 3. The location and orientation of the floor plane was found by the blue markers. The distance between the floor and the green marker (0·28 m) was used for scaling. Afterwards, the points of the floor and background were eliminated (Fig. 3b, c). The surface of the heap was triangulated by Delaunay method (Fig. 3d). The volume of the heap was calculated as the integral under the surface (Fig. 3d).
Stages in the point cloud processing: (a) original point cloud opened by MATLAB; (b) translated and scaled point cloud including the plate with the heap; (c) separated heap; (d) heap surface reconstructed by interpolation and ready for the volume calculation.

Statistical analysis
To test the factors influencing the precision of the photogrammetry method, a repeatability test was performed. Feed was placed in a heap on a floor surrounded by markers, as in Fig. 1. The heap sank 1 min until it stabilized. The heap was photographed 16 times from different locations around the heap. The photographs of the heap were processed using the modelling software and the volume of the heap was calculated. The entire procedure, i.e. photographing, modelling and calculating, was repeated five times for the heap under each of the photography conditions. The five volumes thus obtained were used to calculate the standard deviation (sd) and the relative standard deviation (RSD) of the repeated volume calculations. The lower the sd, the higher the precision under a specific condition, although the sd does not define the precision itself. Thus, the sd was used to only compare the precision of the method under different conditions.
To estimate the precision of the method, linear regression between the calculated volume and the feed mass was used. The distribution of the residuals between the regression line and the volumes was calculated, and the 3σ rule was used to define the limits of possible residuals.
Cow feed density
Feed components and water content define the feed density, which, in turn, can have an effect on the precision of the photogrammetry method. The components of the typical feed used in this experiment are listed in online Supplementary File Table S2. To test the effect of feed density on the system's accuracy, the mass and the volume of the feed were manually measured. A vessel with a volume of 12 l was filled with feed and its mass measured on a scale with 50 g precision; this process was repeated 30 times. To evaluate the principal limits of the feed density, two extreme cases were tested. To find the maximum density, the feed was compressed in the vessel by a force of 100 kg applied on an area of 0·03 m2. To find the minimum density, the feed was thrown inside the vessel and weighed before it sank.
Results
The correlation of the photographed feed volume and the feed mass
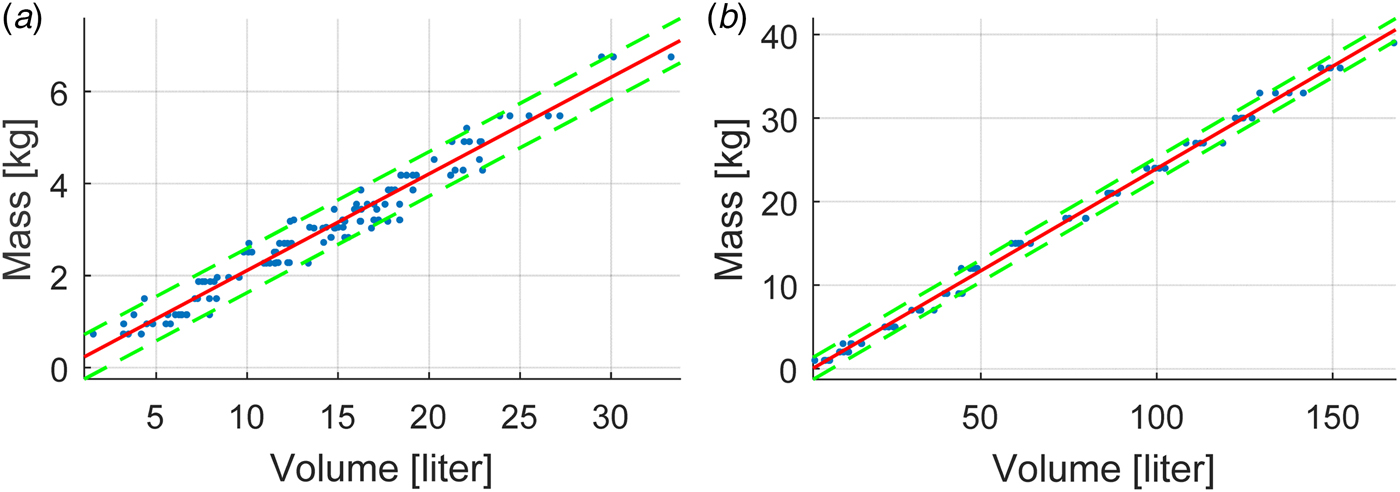
The dots in Fig. 4 represent the feed heaps with the measured mass (y-axis) and the calculated volume based on the photographs (x-axis) for the laboratory (a) and cowshed (b) experiments. The regression coefficients for the volume-mass relationship are Mass = 0·12[kg/l] × Volume + 0·056 [kg.] with R 2 = 0·994 for the laboratory experiment, and Mass = 0·24[kg/l] × Volume − 0·53 [kg] with R 2 = 0·997 for the cowshed experiment. The sd from the regression line for the laboratory experiment is 0·16 kg. Thus, using the rule of 3σ, the estimation error for calculating the mass is 0·483 kg for heaps up to 7 kg. The sd for the estimation error for the cowshed experiment is 0·44 kg, resulting in total method error of 1·32 kg for heaps up to 40 kg.
The correlation between calculated feed volume and measured feed mass in the laboratory (a) and cowshed conditions (b). Each dot represents a feed heap with a measured mass and calculated volume. The regression line and the error boundary strip are shown by lines. The 3σ error estimation was 0·483 kg for the laboratory experiment and 1·24 kg fop the cowshed experiment.

Sensitivity analysis for the photographing conditions
Camera type
The feed heap models based on the images obtained by the three different cameras used are presented in online Supplementary File Fig. S1. The GoPro camera was unsuitable for calculating volume because significant areas appeared as holes. The sd for the Nikon camera was 0·17 l and RSD 0·91%; for the HikVision camera, the sd was 5·3 l and RSD 27%.
Lighting conditions
The sd (RSD) for the volume calculated in different lighting conditions are as follows: 0·16 (1·2%) for FL, 0·2 (1·7%) for S and 0·21 (1·7%) for SS, showing that the FL lighting was preferred, although the differences were not significant.
Display resolution
The dependence between the feed volume and the display resolution is presented in online Supplementary File Table S3. The sd and RSD of the volume calculated increase as the display resolution increases. Above 5 m and 3·1 mm/pixel, the sd and RSD become unacceptable. The display resolution experiment indicates that the camera should be as close as possible to the feed heap, and not more than 5 m from it.
Number of images
The dependence between the feed volume and the number of images is presented in online Supplementary File Table S4. It was found that fewer than eight images were insufficient to calculate the volume. Calculations for more than 32 images take an unacceptably long time, i.e. more than an hour for a single feed heap. In general, sd and RSD for the volume calculations decrease as the number of images increases. The number of images experiment suggests that no significant improvement in accuracy was achieved, i.e. the calculation error does not decrease, if more than 16 images are used.
Cow feed density
The sd of the distribution of the measured feed filling a constant volume was 0·083 kg. Using the 3σ rule, the deviation of the mass in this experiment was found to be 0·25 kg for 3·4 kg. The upper boundary of the feed mass (maximum density) was 4·5 kg. The lower boundary of the feed mass (minimum density) was 2·8 kg.
Discussion
The photogrammetry method in evaluating the cow's individual feed intake offers a number of advantages over other methods: the equipment and cameras are relatively inexpensive; the barn's original infrastructure, including the existing lighting, can be maintained with no changes; the feed measuring system is simple and user-friendly. All of these advantages potentially make measuring feed intake affordable for dairy farmers.
The principle finding of this study is that the error in the feed mass evaluation by the photogrammetry method is 0·483 kg, which is better than 0·5 kg (1σ error for heaps up to 22·68 kg) at Shelley et al. (Reference Shelley, Lau, Stone and Bewley2016). This error value supports the hypothesis. However, this finding was obtained under laboratory conditions, and additional research is required to adapt the method to fit the cowshed conditions.
The test of which camera was most useful for this purpose indicates that the Nikon camera achieved the most precise results. The GoPro camera was unsuitable: the images it produced of the feed heaps were incomplete. Under our conditions, the HikVision was insufficiently precise for this purpose. Nevertheless, a camera of quality similar to the Nikon camera would have a relatively high cost, for example, higher than the 3D IR scanner PrimeSense used by Shelley et al. (Reference Shelley, Lau, Stone and Bewley2016).
The test of lighting conditions found that the FL lighting was best, although the differences were not significant. Use of lights during night should be tested in further research. Nevertheless, the photogrammetry method requires much less effort than elimination of sun influence for the IR scanner (Shelley et al. Reference Shelley, Lau, Stone and Bewley2016) or special projector for structural light (Shelley, Reference Shelley2013).
The cowshed experiment was designed to validate the photogrammetry method under practical conditions in a cowshed, where the camera locations were restricted by the cowshed constructions, distance cows are able to gain and clearance for movement of farm vehicles. The controlled factors were based on the results of the sensitivity experiments: the camera with the best performance, the distance between the cameras and the heap that provided the display resolution of less than 1 mm/pixel; 18 pictures were taken, photography using natural lighting conditions without additional lights. Further study should examine the ideal conditions necessary for achieving the required precision in evaluating the mass, particularly in finding a camera that is of sufficient quality to achieve the precision necessary, and nevertheless inexpensive.
Feed density can be directly measured in real-time in a farm with a feed measuring scale (Bach et al. Reference Bach, Iglesias and Busto2004; Halachmi et al. Reference Halachmi, Meir, Miron and Maltz2016) located in a controlled feed station below cameras. Only few scales are required in the cowsheds to measure the feed density depending on different moisture conditions and feed mixture. A future stage in this research may be a development of low-cost scales affordable for commercial farms.
A number of caveats need to be made. The feed in a cowshed is distributed in a line, i.e. a single unseparated long heap placed along the feeding lane. To find the mass of the eaten feed, the actual eating area of one cow needs to be separated from her neighbouring cows. This separation could be either physical or programmatic. A physical separation by thin walls interferes with the feed lane cleaning and should be low enough to avoid restricting the camera's view. A programme-based separation requires further development of the algorithms. When eating, a cow might dig long narrow holes, restricting the camera's view. To test this, a more thorough experiment in working cowsheds should be conducted.
Two methods of installing the cameras are possible: (a) static cameras can be installed in chosen locations, each one covering a substantial length of the feeding lane; or (b) a camera or cameras moving along the feeding area. Both methods have pros and cons. Static cameras provide reliability and simplicity, although a large number of cameras are needed to cover a long feeding lane. A moving camera can be of high quality and takes advantage of a shorter distance from the feed heap. However, a mechanism necessary to move the cameras complicates the process, and decreases its reliability. In this study, 16 images were found to be necessary to obtain the predefined required precision, which is rather high. This implies that installing static cameras along the feedline is impractical, because of the large number of cameras needed. Thus, we conclude that high-quality moving cameras along the feeding lane would be the best means of utilizing the photogrammetry method. The moving cameras must be sent to an area where the cow has just finished eating. However, if a number of cows finish eating simultaneously, this method can be ineffective. Planned research will address this issue, and a suitable system for moving the camera may be developed. The time needed for the images to be processed by the software presents a challenge: 20–30 min to produce each model. Additional research is necessary to address this issue; among the solutions to be examined are offline computations and utilizing several processors simultaneously.
The coloured markers used in this study for the point cloud processing would not be effective in a cowshed on a working farm. Dirt can change their colours and they can be inadvertently detached from the floor and walls by tractors. Thus, in actual application, the point cloud processing should be based on recognition of the existing cowshed infrastructure: floor, walls and constructions.
Conclusions
A photogrammetry method for evaluating cow feed mass was designed and validated. The results of the sensitivity analysis suggest that under ambient lighting, a resolution of 1 mm per pixel, and 16 images per feed zone and high quality camera, the system accuracy was better than 0·3 kg in laboratory and 1·24 kg in cowshed conditions. Additional research should be undertaken to validate the method under cowshed conditions. Appropriate sufficiently accurate and not prohibitively expensive cameras should be found and tested. Additional subsystems should be developed, including methods for moving the cameras, software to manage the images and division of the feed lane into separate stations.
Supplementary material
The supplementary material for this article can be found at https://doi.org/10.1017/S0022029918000882
This study was support by grants of the Israeli Chief Scientist of Agriculture, projects 459-451415 (‘Kendel’) and 459-4490, and we gratefully thank all members of the Precision Livestock Farming (PLF) Lab. The authors thank Udi Ram for the ideas, and Dr Joshua Miron and the staff of the Volcani research cowshed for assistance in the study.