1 Introduction
Many social scientists use the two-way fixed effects (2FE) regression, or linear regression with unit and time fixed effects, as the default methodology for estimating causal effects from panel data. Applied researchers often use the 2FE regression to adjust for unobserved unit-specific and time-specific confounders at the same time. Unfortunately, we show that the 2FE’s ability to simultaneously adjust for the two types of unobserved confounders critically hinges upon the assumption of linear additive effects. Another common justification is based on the fact that the 2FE estimator is equivalent to the difference-in-differences estimator under the simplest setting with two groups and two time periods (e.g., Bertrand, Duflo, and Mullainathan Reference Bertrand, Duflo and Mullainathan2004; Angrist and Pischke Reference Angrist and Pischke2009). However, we show that this equivalence does not hold under more general settings frequently encountered in applied research. All together, we show that in contrast to the popular belief, the 2FE estimator does not represent a design-based, nonparametric estimation strategy for causal inference. Instead, its validity fundamentally rests on the modeling assumptions.
Our work builds on the growing literature about causal inference with panel data. In particular, we extend the matching representation of one-way fixed effects regression estimator (Imai and Kim Reference Imai and Kim2019) to the 2FE estimator in order to understand the causal interpretation of these widely used estimators within the nonparametric framework (see, e.g., Humphreys Reference Humphreys2009; Aronow and Samii Reference Aronow and Samii2015; Solon, Haider, and Wooldridge Reference Solon, Haider and Wooldridge2015, for related work on causal inference with cross-sectional data). In addition, a number of scholars have recently considered causal interpretations of the standard 2FE estimator (see, e.g., Borusyak and Jaravel Reference Borusyak and Jaravel2017; Abraham and Sun Reference Abraham and Sun2018; Athey and Imbens Reference Athey and Imbens2018; Chaisemartin and D’Haultfœuille Reference Chaisemartin and D’Haultfœuille2018; Goodman-Bacon Reference Goodman-Bacon2018). While many of these studies assume staggered adoption, our analysis extends to a more general case, in which units can go in and out of the treatment condition at different points in time. Finally, we emphasize that the goal of this paper is to shed new light on two common misunderstandings of the FE estimator rather than to propose an alternative estimator.
2 The Two-way Fixed Effects Regression Estimator
Suppose that we have a panel data set of N units and T time periods. Although our results readily extend to the case of unbalanced panel, for the sake of notational simplicity, we assume a balanced panel data set. Let
 $X_{it}$
and
 $Y_{it}$
represent the binary treatment indicator and observed outcome variables for unit i at time t, respectively. We consider the following two-way linear fixed effects (2FE) regression model,
 $$ \begin{align} Y_{it} =& \alpha_i + \gamma_t + \beta X_{it} + \epsilon_{it} \end{align} $$
for
 $i=1,2,\ldots ,N$
and
 $t=1,2,\ldots ,T$
where
 $\alpha _i$
and
 $\gamma _t$
are unit and time fixed effects, respectively.
The inclusion of unit and time fixed effects accounts for both unit-specific (but time-invariant) and time-specific (but unit-invariant) unobserved confounders in a flexible manner. Specifically, we can define unit and time fixed effects as
 $\alpha _i = h({\mathbf {U}}_i)$
and
 $\gamma _t = f({\mathbf {V}}_t)$
, where
 ${\mathbf {U}}_i$
and
 ${\mathbf {V}}_t$
represent these unit-specific and time-specific unobserved confounders that are common causes of the outcome and treatment variables. In addition,
 $h(\cdot )$
and
 $f(\cdot )$
are arbitrary functions unknown to researchers. Thus, although the interaction between these two types of unobserved confounders is assumed to be absent, there is no functional-form restriction on
 $h(\cdot )$
and
 $f(\cdot )$
. In other words, since the treatment is binary, the model makes no restriction other than the additivity and separability of the two types of unobserved confounders.
The least squares estimate of
 $\beta $
can be computed efficiently by transforming the outcome and treatment variables and then regressing the former on the latter. Formally, the estimator is given by,
 $$ \begin{align} \hat\beta \ = \ \operatorname*{\mathrm{argmin}}_{\beta} \sum_{i=1}^N \sum_{t=1}^T [\{(Y_{it} - \overline{Y}) - (\overline{Y}_i - \overline{Y}) - (\overline{Y}_t - \overline{Y})\} - \beta\{(X_{it}-\overline{X}) - (\overline{X}_i-\overline{X}) - (\overline{X}_t - \overline{X})\}]^2 \end{align} $$
where
 $\overline {Y}_i=\sum _{t=1}^T Y_{it}/T$
and
 $\overline {X}_i=\sum _{t=1}^T X_{it}/T$
are unit-specific means,
 $\overline {Y}_t=\sum _{i=1}^n Y_{it}/N$
and
 $\overline {X}_t=\sum _{i=1}^n X_{it}/N$
are time-specific means, and
 $\overline {Y} = \sum _{i=1}^N \sum _{t=1}^T Y_{it}/NT$
and
 $\overline {X} = \sum _{i=1}^N \sum _{t=1}^T X_{it}/NT$
are overall means. Equation (2) shows how the 2FE estimator exploits the covariation in the outcome and treatment variables. Specifically, the equation shows that least squares estimation is applied after the within-unit and within-time variations are subtracted from the overall variation for both outcome and treatment variables.
3 Adjustment for Unobserved Confounders
Many applied researchers justify the use of the 2FE estimator by its ability to simultaneously adjust for unit-specific and time-specific unobserved confounders. We show below that such a justification is unwarranted without critically relying on the functional-form assumption. Indeed, by extending the matching framework of Imai and Kim (Reference Imai and Kim2019), we show that the simultaneous adjustment for the two types of unobserved confounders cannot be done nonparametrically under the 2FE framework.
3.1 The Matching Framework
To establish the impossibility of nonparametric adjustment for unit-specific and time-specific unobserved confounders, it is useful to consider the 2FE estimator as a matching estimator (Imai and Kim Reference Imai and Kim2019). An intuitive explanation of this result is as follows. Although one could nonparametrically adjust for unit-specific (time-specific) unobserved confounders by matching a treated observation with control observations of the same unit (time period), no other observation shares the same unit and time indices. Thus, the 2FE estimator critically relies upon the linearity assumption for its simultaneous adjustment for the two types of unobserved confounders. The following proposition formalizes this argument.
Proposition 1 The Two-way Fixed Effects Regression Estimator as a Two-way Matching Estimator
The two-way fixed effects estimator defined in Equation (2) is equivalent to the following matching estimator,
 $$ \begin{align*} \hat{\beta} & = \frac{1}{K}\left[\frac{1}{NT} \sum_{i=1}^N \sum_{t=1}^T \left\{X_{it} \left(Y_{it} - \widehat{Y_{it}(0)} \right) + (1-X_{it}) \left( \widehat{Y_{it}(1)} -Y_{it} \right) \right\}\right] \end{align*} $$
where for
 $x=0,1$
, the estimate of the potential outcome
 $Y_{it}(x)$
for unit i at time t under the treatment status
 $X_{it} = x$
is given by,
 $$ \begin{align*} \widehat{Y_{it}(x)} & = \frac{1}{T-1}\sum_{t^{\prime} \neq t} Y_{it^{\prime}} + \frac{1}{N-1}\sum_{i^{\prime} \neq i} Y_{i^{\prime}t} - \frac{1}{(T-1)(N-1)}\sum_{i^{\prime} \neq i} \sum_{t^{\prime} \neq t} Y_{i^{\prime}t^{\prime}} \\ K & = \frac{1}{NT} \sum_{i=1}^N \sum_{t=1}^T \left\{X_{it}\left(\frac{\sum_{t^{\prime}\neq t} (1-X_{it^{\prime}})}{T-1} + \frac{\sum_{i^{\prime} \neq i} (1-X_{i^{\prime}t})}{N-1} - \frac{\sum_{i^{\prime} \neq i} \sum_{t^{\prime} \neq t} (1-X_{i^{\prime}t^{\prime}})}{(T-1)(N-1)}\right) \right.\nonumber \\ & \quad+ \left. (1-X_{it})\left( \frac{\sum_{t^{\prime} \neq t} X_{it^{\prime}}}{T-1} + \frac{\sum_{i^{\prime}\neq i} X_{i^{\prime}t}}{N-1} - \frac{\sum_{i^{\prime} \neq i} \sum_{t^{\prime} \neq t} X_{i^{\prime}t^{\prime}}}{(T-1)(N-1)}\right)\right\}. \end{align*} $$
Proof is given in Online Supplementary Information. The proposition shows that the estimated counterfactual outcome of a given observation, that is,
 $\widehat {Y_{it}(1-X_{it})}$
, is a function of three averages. First, the average of all the other observations from the same unit, that is,
 $\sum _{t^{\prime } \ne t} Y_{it^{\prime }}/(T-1)$
, and the average of all the other observations from the same time period, that is,
 $\sum _{i^{\prime } \ne i} Y_{i^{\prime } t}/(N-1)$
, are added together. We call them the within-unit matched set
 ${\mathcal {M}}_{it}$
and the within-time matched set
 ${\mathcal {N}}_{it}$
, respectively, and formally define them as,
 $$ \begin{align} {\mathcal{M}}_{it} & = \{(i^{\prime}, t^{\prime}): i^{\prime} = i, t^{\prime} \ne t\}, \quad \text{and} \quad {\mathcal{N}}_{it} \ = \ \{(i^{\prime}, t^{\prime}): i^{\prime} \ne i, t^{\prime} = t\}. \end{align} $$
The 2FE estimator then adjusts for unit-specific and time-specific unobserved confounders by using observations that share the same unit or time as those in
 ${\mathcal {N}}_{it}$
and
 ${\mathcal {M}}_{it}$
, respectively, and subtracting their mean, that is,
 $\sum _{i^{\prime } \ne i} \sum _{t^{\prime } \ne t} Y_{i^{\prime } t^{\prime }}/(T-1)(N-1)$
, from this sum. We use
 ${\mathcal {A}}_{it}$
to denote this group of observations and call it the adjustment set for observation
 $(i,t)$
with the following definition,
 $$ \begin{align} {\mathcal{A}}_{it} & = \{(i^{\prime}, t^{\prime}): i^{\prime} \ne i, t^{\prime} \ne t, (i, t^{\prime}) \in {\mathcal{M}}_{it}, (i^{\prime}, t) \in {\mathcal{N}}_{it} \}. \end{align} $$
By construction, the number of observations in
 ${\mathcal {A}}_{it}$
equals the product of the number of observations in the within-unit and within-time matched sets, that is,
 $|{\mathcal {A}}_{it}| = |{\mathcal {M}}_{it}| \cdot |{\mathcal {N}}_{it}|$
.
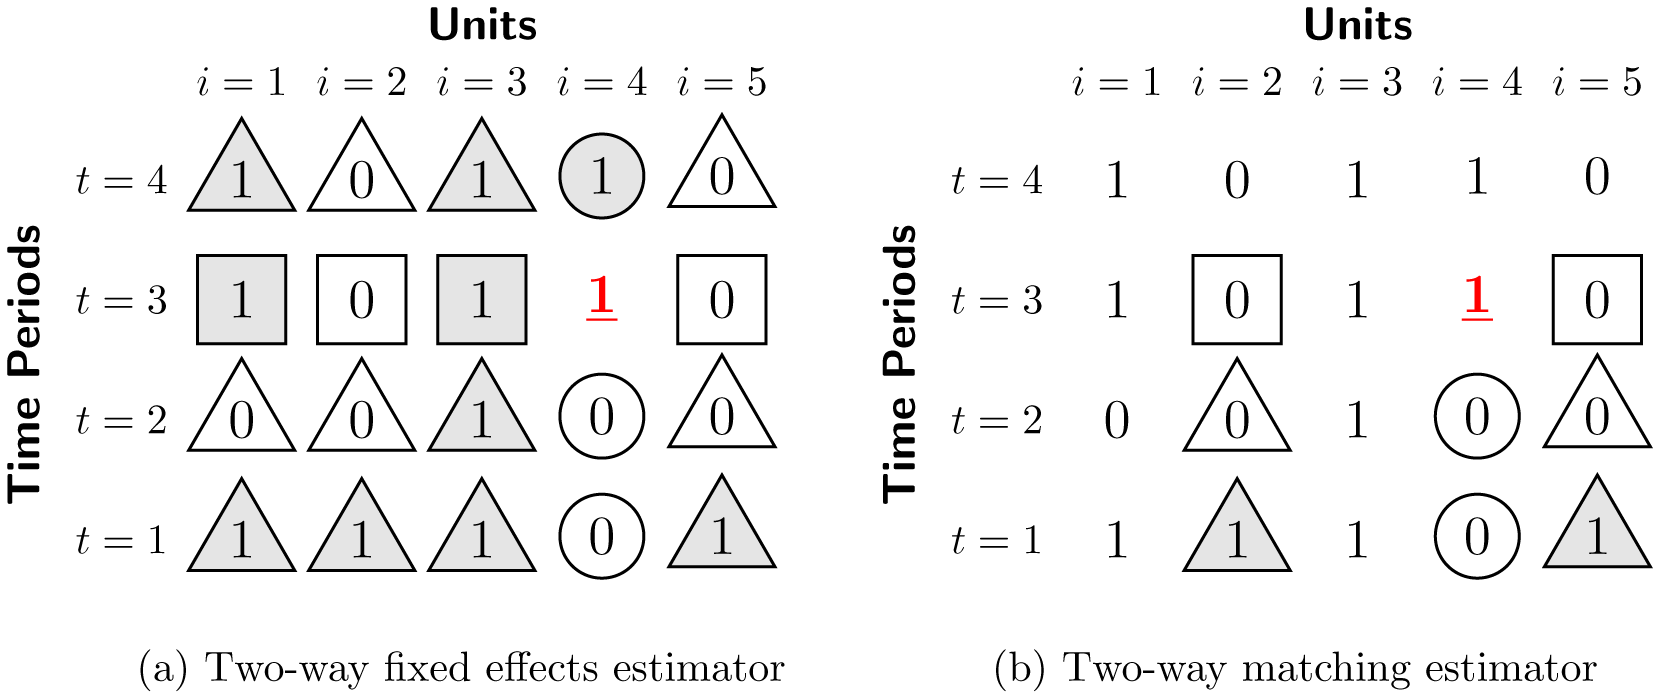
Panel (a) of Figure 1 presents an example of the binary treatment matrix with five units and four time periods, that is,
 $N=5$
and
 $T = 4$
. In the figure, the red underlined
 $\color{red}{}\underline{1} $
entry represents a treated observation of interest, for which the counterfactual outcome
 $Y_{it}(0)$
needs to be estimated using other observations. This counterfactual quantity is estimated as the average of control observations from the same unit
 ${\mathcal {M}}_{it}$
(circles in the figure), plus the average of control observations from the same time period
 ${\mathcal {N}}_{it}$
(squares), minus the average of adjustment observations,
 ${\mathcal {A}}_{it}$
(triangles).
An Example of the Binary Treatment Matrix with Five Units and Four Time Periods. Panels (a) and (b) illustrate how observations (i, t) are used to estimate counterfactual outcomes for the two-way fixed effects estimator (Proposition 1) and the adjusted matching estimator (Proposition 2), respectively. In the figures, the red underlined
$\color{red}{}\underline{1} $
entry (4,3) represents the treated observation, for which the counterfactual outcome
 $Y_{it}(0)$
needs to be estimated. Circles indicate the set of matched observations—(4,1), (4,2), (4,4) in Panel (a) and (4,1), (4,2) in Panel (b)—that are from the same unit, whereas squares indicate those—(1,3), (2,3), (3,3), (5,3) in Panel (a) and (2,3), (5,3) in Panel (b)—from the same time period. Finally, triangles represent the set of observations—(1,1), (1,2), (1,4), (2,1), (2,2), (2,4), (3,1), (3,2), (3,4), (5,1), (5,2), (5,4) in Panel (a) and (2,1), (2,2), (5,1), (5,2) in Panel (b)—that are used to make adjustment for unit and time effects. The shaded grey symbols represent the “mismatches” with the same treatment status, which are prevalent in the two-way fixed effects estimator. The matching estimator in Panel (b) is designed to eliminate the attenuation bias within unit and time, although the adjustment set may still include mismatches (shaded triangles).

Note that all of these three averages may include units with the same treatment status as the observation whose counterfactual outcome is being estimated. We refer to these observations as “mismatches” (shaded grey entries in the figure) because for the estimation of causal effects, an observation must be matched with another observation with the opposite treatment status. Therefore, mismatches imply the (partial) comparison of observations with the same treatment status, which generally leads to an attenuation bias. The 2FE estimator adjusts for this bias via the factor K, which is equal to the net proportion of proper matches between the observations of opposite treatment status. For example, for a treated observation with
 $X_{it}=1$
, we compute the proportion of matched control observations in the within-unit matched set, that is,
 $\sum _{t^{\prime } \ne t}{}(1-X_{it^{\prime }})/(T-1)$
, and the proportion of matched control observations in the within-time matched set, that is,
 $\sum _{i^{\prime } \ne i} (1-X_{i^{\prime } t})/(N-1)$
, and subtract from their sum the proportion of matched control observations in the adjustment set, that is,
 $\sum _{i^{\prime } \ne i} \sum _{t^{\prime } \ne t}(1-X_{i^{\prime } t^{\prime }})/(T-1)(N-1)$
.
3.2 The Impossibility of Nonparametric Adjustment
Given this result, it is natural to ask whether we can eliminate the mismatches and the adjustment set all together within the two-way fixed effects framework. We show below that this is generally impossible. In particular, although we can construct a weighted 2FE estimator that has fewer mismatches, this estimator in general still suffers from some mismatches and has an adjustment set.
To develop a weighted 2FE estimator with fewer mismatches, we begin by matching each observation only with other observations of the opposite treatment status to estimate the counterfactual outcome. That is, we use the following within-unit matched set
 ${\mathcal {M}}_{it}^\ast $
, which consists of the observations within the same unit but with the opposite treatment status,
 $$ \begin{align} {\mathcal{M}}_{it}^\ast \ = \ \{(i^{\prime}, t^{\prime}): i^{\prime} = i, X_{i^{\prime} t^{\prime}} = 1 - X_{it}\}. \end{align} $$
Similarly, we restrict the within-time matched set so that its observations belong to the same time period t but have the opposite treatment status,
 $$ \begin{align} {\mathcal{N}}_{it}^\ast & = \{(i^{\prime}, t^{\prime}): t^{\prime} = t, X_{i^{\prime} t^{\prime}} = 1-X_{it} \}. \end{align} $$
Then, using Equation (4), we can define the corresponding adjustment set
 ${\mathcal {A}}_{it}^\ast $
.
 $$ \begin{align} {\mathcal{A}}_{it}^\ast & = \{(i^{\prime}, t^{\prime}): i^{\prime} \ne i, t^{\prime} \ne t, (i, t^{\prime}) \in {\mathcal{M}}_{it}^\ast, (i^{\prime}, t) \in {\mathcal{N}}_{it}^\ast \}. \end{align} $$
The next proposition establishes that this two-way matching estimator, which eliminates mismatches within-unit and within-time dimension, can be written as a weighted 2FE estimator.
Proposition 2 The Two-way Matching Estimator with Fewer Mismatches as a Weighted Two-way Fixed Effects Regression Estimator
Assume that the treatment varies within each unit as well as within each time period, that is,
 $0 < \sum _{t=1}^T X_{it} < T$
for each i and
 $0 < \sum _{i=1}^N X_{it} < N$
for each t. Consider the following matching estimator,
 $$ \begin{align*} \hat\beta^\ast & = \frac{1}{\sum_{i=1}^N \sum_{t=1}^T D_{it}} \sum_{i=1}^N \sum_{t=1}^T \frac{D_{it}}{K_{it}} \left\{X_{it}\left(Y_{it}- \widehat{Y_{it}(0)} \right) + (1-X_{it})\left(\widehat{Y_{it}(1)} - Y_{it}\right)\right\} \end{align*} $$
where
 $D_{it} = \mathbf {1}\{|{\mathcal {M}}_{it}^\ast |\cdot |{\mathcal {N}}_{it}^\ast |> 0\}$
, and for
 $x=0,1$
,
 $$ \begin{align*} \widehat{Y_{it}(x)} & = \frac{1}{|{\mathcal{M}}_{it}^\ast|}\sum_{(i,t^{\prime})\in {\mathcal{M}}_{it}^\ast}Y_{it^{\prime}} + \frac{1}{|{\mathcal{N}}_{it}^\ast|}\sum_{(i^{\prime},t)\in {\mathcal{N}}_{it}^\ast}Y_{i^{\prime}t} - \frac{1}{|{\mathcal{A}}_{it}^\ast|}\sum_{(i^{\prime}, t^{\prime})\in {\mathcal{A}}_{it}^\ast}Y_{i^{\prime}t^{\prime}} \\ K_{it} & = 1 + \frac{a_{it}}{|{\mathcal{A}}_{it}^\ast|} \end{align*} $$
and
 $a_{it} = |\{(i^{\prime }, t^{\prime }) \in {\mathcal {A}}_{it}^\ast : X_{i^{\prime } t^{\prime }} = X_{it} \}|$
. Then, this matching estimator is equivalent to the following weighted two-way fixed effects estimator,
 $$ \begin{align*} \hat\beta^\ast & = \operatorname*{\mathrm{argmin}}_{\beta} \sum_{i=1}^N \sum_{t=1}^T W_{it} \{(Y_{it} - \overline{Y}_i^\ast - \overline{Y}_t^\ast + \overline{Y}^\ast) - \beta(X_{it} - \overline{X}_i^\ast - \overline{X}_t^\ast + \overline{X}^\ast)\}^2 \end{align*} $$
where the asterisks indicate weighted averages, that is,
 $\overline {Y}_i^\ast = \sum _{t=1}^T W_{it} Y_{it}/\sum _{t=1}^T W_{it}$
,
 $\overline {Y}_t^\ast = \sum _{i=1}^N W_{it} Y_{it}/\sum _{i=1}^N W_{it}$
,
 $\overline {X}_i^\ast = \sum _{t=1}^T W_{it} X_{it}/\sum _{t=1}^T W_{it}$
,
 $\overline {X}_t^\ast = \sum _{i=1}^N W_{it} X_{it}/\sum _{i=1}^N W_{it}$
,
 $\overline {Y}^\ast = \sum _{i=1}^N \sum _{t=1}^T W_{it} {} Y_{it}/\sum _{i=1}^N \sum _{t=1}^T W_{it}$
,
 $\overline {X}^\ast = \sum _{i=1}^N \sum _{t=1}^T W_{it} X_{it}/\sum _{i=1}^N \sum _{t=1}^T W_{it}$
, and
 $$ \begin{align*} W_{it} & = \sum_{i^{\prime}=1}^N \sum_{t^{\prime} = 1}^T w_{it}^{i^{\prime} t^{\prime}} \quad \text{and} \quad w_{it}^{i^{\prime} t^{\prime}} \ = \ \left\{ \begin{array}{cl} \frac{D_{i^{\prime} t^{\prime}}}{K_{i^{\prime} t^{\prime}}} & \text{if} \ (i,t) = (i^{\prime},t^{\prime}) \\ \frac{D_{i^{\prime} t^{\prime}}}{ K_{i^{\prime} t^{\prime}}\cdot|{\mathcal{M}}_{i^{\prime} t^{\prime}}^\ast|} & \text{if} \ (i,t) \in {\mathcal{M}}_{i^{\prime} t^{\prime}}^\ast \\ \frac{D_{i^{\prime} t^{\prime}}}{K_{i^{\prime} t^{\prime}}\cdot|{\mathcal{N}}_{i^{\prime} t^{\prime}}^\ast|} & \text{if} \ (i,t) \in {\mathcal{N}}_{i^{\prime} t^{\prime}}^\ast \\ \frac{D_{i^{\prime} t^{\prime}}(2X_{i t} - 1) (2X_{i^{\prime} t^{\prime}} - 1)}{K_{i^{\prime} t^{\prime}} \cdot |{\mathcal{A}}_{i^{\prime} t^{\prime}}^\ast |} & \text{if} \ (i,t) \in {\mathcal{A}}_{i^{\prime} t^{\prime}}^\ast \\ 0 & \text{otherwise.} \end{array} \right. \end{align*} $$
Proof is given in Online Supplementary Information. Unlike Proposition 1, the adjustment is done by deflating the estimated treatment effect for each treated observation
 $(i,t)$
by
 $1/K_{it}$
. This is because the attenuation bias from
 ${\mathcal {A}}_{it}^\ast $
(the “pooled” part) is subtracted from the sum of two estimates from
 ${\mathcal {M}}_{it}^\ast $
and
 ${\mathcal {N}}_{it}^\ast $
, inflating the estimated treatment effect for a given observation
 $(i,t)$
. In the example of Panel (b) of Figure 1,
 ${\mathcal {A}}_{it}^\ast $
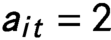
contains two mismatches (shaded grey entries in triangles), that is,
 $a_{it} = 2$
, and hence the adjustment factor is
 $K_{it}=3/2=1 + 2/4$
. Note that such adjustment is not necessary (i.e.,
 $K_{it} = 1$
) when there are no mismatches in the adjustment set, that is,
 $a_{it} = 0$
.
The algebraic equivalence result given in Proposition 2 clarifies the set of observations that are used to estimate the counterfactual for each unit and how the adjustments due to mismatches are reflected in the weighted two-way fixed effects estimator. Specifically, it shows that each observation
 $(i,t)$
is weighted differently according to the number of times it serves as a control unit. For example, if an observation
 $(i,t)$
has the treatment status opposite to another observation within-unit
 $(i^{\prime }, t^{\prime })$
, that is,
 $(i,t) \in {\mathcal {M}}_{i^{\prime } t^{\prime }}^\ast $
, then its overall weight
 $W_{it}$
is increased by
 $1/|{\mathcal {M}}_{i^{\prime } t^{\prime }}^\ast |$
along with other observations in the within-unit matched set. This contribution to the weight is then deflated by the adjustment factor
 $K_{i^{\prime } t^{\prime }}$
, correcting the attenuation bias due to mismatches (see the formula for computing
 $w_{it}^{i^{\prime } t^{\prime }}$
in the proposition).
Unfortunately, we cannot eliminate mismatches in
 ${\mathcal {A}}_{it}^\ast $
without additional restrictions on the matched sets,
 ${\mathcal {M}}_{it}^\ast $
and
 ${\mathcal {N}}_{it}^\ast $
(see Section 4.1). This point is illustrated by Panel (b) of Figure 1 where the adjustment set
 ${\mathcal {A}}_{it}^\ast $
(triangles) still includes the observations of the same treatment status. Therefore, even the weighted 2FE estimator, which has fewer mismatches than the standard 2FE estimator, suffers from some mismatches. The estimator also has an adjustment set whose observations belong to neither the same unit nor the same time period as the observation being matched with. This implies that it is impossible to simultaneously and nonparametrically adjust for unit-specific and time-specific unobserved confounders under the two-way fixed effects framework.
4 The Difference-in-Differences Design
Although it is generally impossible to eliminate all mismatches, in this section we show that we can do so under the difference-in-differences (DiD) design. In contrast to a common belief among applied researchers, we also show that under the general panel data settings, the DiD estimator is not equivalent to the standard 2FE estimator. Instead, the multi-period DiD estimator is equal to the weighted 2FE estimator with some observations having negative regression weights. This implies that the equivalence between the 2FE estimator and the DiD estimator critically hinges on the linearity assumption.
4.1 The Multi-period Difference-in-Differences Estimator
To establish the relations between the 2FE and DiD estimators, we begin by considering the following parallel trend assumption,
Assumption 1 Parallel Trend
For
 $i=1,2,\dots ,N$
and
 $t=2,\dots ,T$
,
 $$ \begin{align*} {\mathbb{E}}(Y_{it}(0) - Y_{i,t-1}(0) \mid X_{it} = 1, X_{i,t-1} = 0) & = {\mathbb{E}}(Y_{it}(0) - Y_{i,t-1}(0) \mid X_{it} = X_{i,t-1} = 0). \end{align*} $$
We emphasize that this assumption may not be credible in some settings (see, e.g., Bilinski and Hatfield Reference Bilinski and Hatfield2018; Kahn-Lang and Lang Reference Kahn-Lang and Lang2019; Rambachan and Roth Reference Rambachan and Roth2019). The goal of our analysis, however, is to shed new light on a popular justification of the 2FE estimator as the DiD estimator under the simplest setting.Footnote 1 Under this parallel trend assumption, the estimand is the average treatment effect for the treated (ATT),
 $$ \begin{align} \tau \ = \ {\mathbb{E}}(Y_{it}(1) - Y_{it}(0) \mid X_{it} = 1, X_{i,t-1} = 0). \end{align} $$
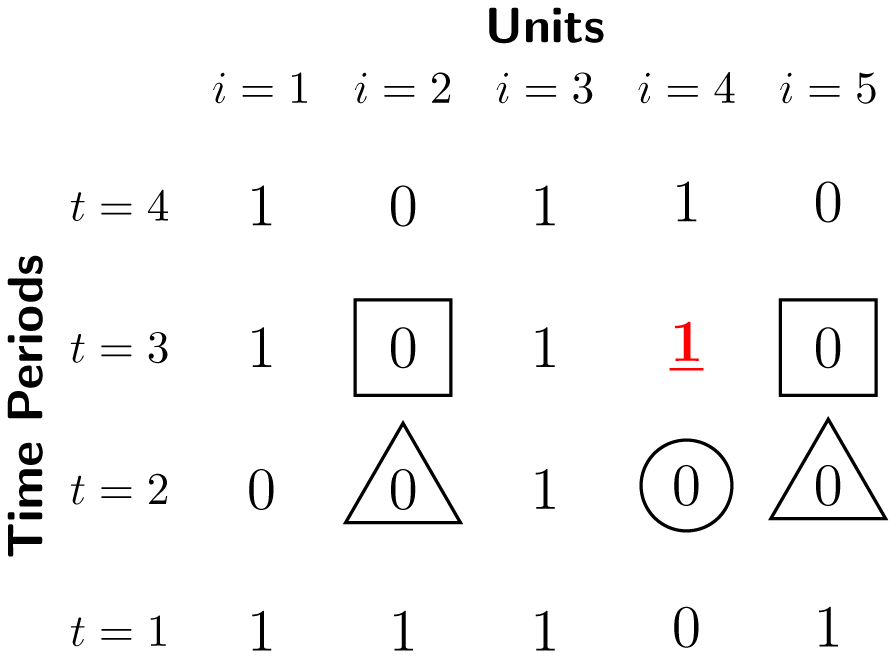
To formulate a multi-period DiD estimator under the 2FE estimator framework, we follow the analytical strategy used in the previous section and define three sets of observations as illustrated in Figure 2—the within-unit matched set (represented by a circle), within-time matched set (represented by squares), and adjustment set (represented by triangles)—for a treated observation
 $(4, 3)$
(represented by the red underlined
$\color{red}{}\underline{1} $
). We next show that the DiD design eliminates mismatches from these three sets.
Illustration of how observations are used to estimate counterfactual outcomes for the DiD estimator (Equation (12)). The red underlined
$\color{red}{}\underline{1} $
entry represents the treated observation
 $(4,3)$
, for which the counterfactual outcome
 $Y_{it}(0)$
needs to be estimated. Circle indicates the matched observation (4,2) within the same unit,
 ${\mathcal {M}}_{it}^{\textsf {DiD}}$
, whereas squares—(2,3) and (5,3)—indicate those from the same time period,
 ${\mathcal {N}}_{it}^{\textsf {DiD}}$
. Finally, triangles—(2,2) and (5,2)—represent the set of observations that are used to make adjustment for unit and time effects,
 ${\mathcal {A}}_{it}^{\textsf {DiD}}$
. Unlike the examples in Figure 1,
 ${\mathcal {A}}_{it}^{\textsf {DiD}}$
only contains control observations and hence no mismatches (i.e., shaded grey triangles) exist.

Formally, the within-unit matched set contains the observation of the same unit from the previous time period if it is under the control condition, and to be an empty set otherwise,
 $$ \begin{align} {\mathcal{M}}_{it}^{\textsf{DiD}} & = \{(i^{\prime}, t^{\prime}): i^{\prime} = i, t^{\prime} = t-1, X_{i^{\prime} t^{\prime}} = 0\}. \end{align} $$
Similarly, the within-time matched set is defined as a group of control observations in the same time period whose prior observations are also under the control condition,
 $$ \begin{align} {\mathcal{N}}_{it}^{\textsf{DiD}} & = \{(i^{\prime}, t^{\prime}): i^{\prime} \ne i, t^{\prime} = t, X_{i^{\prime} t^{\prime}} = X_{i^{\prime}, t^{\prime} - 1} = 0 \}. \end{align} $$
Finally, we define the adjustment set
 ${\mathcal {A}}_{it}^{\textsf {DiD}}$
, which contains the control observations in the previous period that share the same unit as those in
 ${\mathcal {N}}_{it}^{\textsf {DiD}}$
,
 $$ \begin{align} {\mathcal{A}}_{it}^{\textsf{DiD}} & = \{(i^{\prime}, t^{\prime}): i^{\prime} \neq i, t^{\prime} = t-1, X_{i^{\prime} t^{\prime}} = X_{i^{\prime} t} = 0 \}. \end{align} $$
Thus, the number of observations in this adjustment set is the same as that in
 ${\mathcal {N}}_{it}^{\textsf {DiD}}$
. It is worth noting that all three sets only contain control observations, thereby eliminating all mismatches.
Using these matched and adjustment sets, we can define the multi-period DiD estimator as the average of two-time-period two-group DiD estimators applied whenever there is a change from the control condition to the treatment condition,
 $$ \begin{align} \hat\tau & = \frac{1}{\sum_{i=1}^N \sum_{t=1}^T D_{it}} \sum_{i=1}^N \sum_{t=1}^T D_{it} \left(Y_{it} - \widehat{Y_{it}(0)} \right) \end{align} $$
where
 $D_{i1}=0$
for all i,
 $D_{it} = X_{it} \cdot \mathbf {1}\{|{\mathcal {M}}_{it}^{\textsf {DiD}}| \cdot |{\mathcal {N}}_{it}^{\textsf {DiD}}|> 0 \}$
for
 $t> 1$
, and for
 $D_{it} = 1$
, we define,
 $$ \begin{align} \widehat{Y_{it}(0)} & = Y_{i,t-1} + \frac{1}{|{\mathcal{N}}_{it}^{\textsf{DiD}}|}\sum_{(i^{\prime},t)\in {\mathcal{N}}_{it}^{\textsf{DiD}}}Y_{i^{\prime}t} - \frac{1}{|{\mathcal{A}}_{it}^{\textsf{DiD}}|}\sum_{(i^{\prime}, t^{\prime})\in {\mathcal{A}}_{it}^{\textsf{DiD}}}Y_{i^{\prime}t^{\prime}} \end{align} $$
Thus, when the treatment status of a unit changes from the control condition at time
 $t-1$
to the treatment condition at time t (and there exists at least one unit
 $i^{\prime }$
whose treatment status does not change during the same time periods, that is,
 $D_{it}=1$
), the counterfactual outcome for observation
 $(i,t)$
is estimated as follows. We subtract from
 $Y_{it}$
its own observed outcome of the previous period
 $Y_{i,t-1}$
as well as the average outcome difference between the same two time periods among the other units whose treatment status remains unchanged as the control condition.
4.2 Equivalence to the Weighted Two-way Fixed Effects Estimator with Some Negative Regression Weights
It is well known that the standard nonparametric DiD estimator is numerically equivalent to the 2FE estimator in the simplest setting, in which there are only two time periods and the treatment is administered only to one group of units in the second time period. Unfortunately, we show that this equivalence result does not generalize to the current multi-period DiD design, in which the number of time periods may exceed two and different units may switch in and out of the treatment condition multiple times and at different points in time.Footnote 2 Instead, the following theorem establishes that the general multi-period DiD estimator given in Equation (12) is equivalent to a weighted two-way fixed effects regression estimator.
Theorem 1 Difference-in-Differences Estimator as a Weighted Two-way Fixed Effects Estimator
Assume that there is at least one treated and control unit, that is,
 $0 < \sum _{i=1}^N \sum _{t=1}^T X_{it} < NT$
, and that there is at least one unit with
 $D_{it} =1$
, that is,
 $0 < \sum _{i=1}^N \sum _{t=1}^T D_{it}$
. The difference-in-differences estimator
 $\hat \tau $
, defined in Equation (12), is equivalent to the following weighted two-way fixed effects regression estimator,
 $$ \begin{align*} \hat\tau \ = \ \hat\beta_{{\textsf{WFE2}}} & = \operatorname*{\mathrm{argmin}}_\beta \sum_{i=1}^N \sum_{t=1}^T W_{it} \{(Y_{it} - \overline{Y}_i^\ast - \overline{Y}_t^\ast + \overline{Y}^\ast) - \beta (X_{it} - \overline{X}_i^\ast - \overline{X}_t^\ast + \overline{X}^\ast)\}^2 \end{align*} $$
where the asterisks indicate weighted averages, and the weights are given by,
 $$ \begin{align*} W_{it} & = \sum_{i^{\prime}=1}^N \sum_{t^{\prime} = 1}^T D_{i^{\prime} t^{\prime}} \cdot w_{it}^{i^{\prime} t^{\prime}} \quad \text{and} \quad w_{it}^{i^{\prime} t^{\prime}} \ = \ \left\{ \begin{array}{cl} 1 & \text{if} \ (i,t) = (i^{\prime},t^{\prime}) \\ 1/|{\mathcal{M}}_{i^{\prime} t^{\prime}}^{\textsf{DiD}}| & \text{if} \ (i,t) \in {\mathcal{M}}_{i^{\prime} t^{\prime}}^{\textsf{DiD}} \\ 1/|{\mathcal{N}}_{i^{\prime} t^{\prime}}^{\textsf{DiD}}| & \text{if} \ (i,t) \in {\mathcal{N}}_{i^{\prime} t^{\prime}}^{\textsf{DiD}} \\ (2X_{i t} - 1) (2X_{i^{\prime} t^{\prime}} - 1)/|{\mathcal{A}}_{i^{\prime} t^{\prime}}^{\textsf{DiD}}| & \text{if} \ (i,t) \in {\mathcal{A}}_{i^{\prime} t^{\prime}}^{\textsf{DiD}} \\ 0 & \text{otherwise.} \end{array} \right. \end{align*} $$
Proof is in Appendix A. Theorem 1 shows that the DiD estimator can be obtained by calculating the weighted linear two-way fixed effects regression estimator.
Theorem 1 has two important implications. First, in contrast to a common belief held among applied researchers, the (unweighted) 2FE estimator is not in general equivalent to the multi-period DiD estimator. Second, although the multi-period DiD estimator can be shown to be equivalent to the weighted 2FE estimator, some control observations will have negative regression weights. This occurs when they frequently enter into the adjustment set,
 ${\mathcal {A}}_{i^{\prime } t^{\prime }}^{\textsf {DiD}}$
, for multiple treated observations (i.e.,
 $(2X_{i t} - 1) (2X_{i^{\prime } t^{\prime }} - 1) = -1$
). Since the regression weights should generally positive, the results of this section shows that the justification of the 2FE estimator as the DiD estimator is not warranted unless the linearity assumption is imposed.
5 Concluding Remarks
In this paper, we study the use of linear regression models with unit and time fixed effects for causal inference with panel data. Although these models have been used extensively in applied research, little has been understood about how these models can be used to identify causal effects. We show that contrary to the common belief, the standard two-way fixed effects regression estimator does not represent a design-based, nonparametric causal estimator. It is impossible to simultaneously adjust for unobserved unit-specific and time-specific confounders. In addition, a general multi-period difference-in-differences estimator is equivalent to the weighted two-way fixed effects regression estimator, but some observations have invalid (i.e., negative) weights.
Given the problems of the standard two-way fixed effects regression estimator identified in this paper, future research should develop design-based estimators for causal inference with panel data. Recently, a number of researchers have extended the synthetical control method of Abadie, Diamond, and Hainmueller (Reference Abadie, Diamond and Hainmueller2010) to more general settings (e.g., Xu Reference Xu2017; Ben-Michael, Feller, and Rothstein Reference Ben-Michael, Feller and Rothstein2019). In a separate paper, we have also generalized the multi-period difference-in-differences estimator introduced in this paper and proposed matching and weighting methods that are applicable to panel data (Imai, Kim, and Wang Reference Imai, Kim and Wang2018). In that paper, we show how to apply matching methods to time-series cross section data by explicitly comparing each treated observation with a set of control observations that are matched based on certain criteria. An advantage of such a method is the fact that it allows researchers to assess the quality of matches by examining the balance of confounders. Much research is needed to improve the existing methods for causal inference with panel data. While we have focused on a binary treatment variable, causal inference with general treatment regimes in panel data settings is of particular interest to many researchers.
Appendix A
Proof of Theorem 1
The proof of this theorem follows directly from Proposition 2 as the within-unit and within-time matched sets are subsets of
 ${\mathcal {M}}_{it}^\ast $
and
 ${\mathcal {N}}_{it}^\ast $
. Specifically,
 ${\mathcal {M}}_{it}^{\textsf {DiD}}$
consists of up to one observation
 $(i,t-1)$
that is under the opposite treatment status, that is,
 $\{(i^{\prime }, t^{\prime }): i^{\prime } = i, t^{\prime } = t-1, X_{i^{\prime } t^{\prime }} = 0\}$
, while
 ${\mathcal {N}}_{it}^{\textsf {DiD}}$
is limited to the observations in the same time period whose prior observation is also under the control condition.
 $$ \begin{align*} \hat\beta_{\textsf{DiD}} & = \frac{\sum_{i=1}^N\sum_{t=1}^T W_{it} (X_{it} -\overline{X}^\ast_i -\overline{X}^\ast_t + \overline{X}^\ast) (Y_{it} - \overline{Y}^\ast_i - \overline{Y}^\ast_t + \overline{Y}^\ast) }{\sum_{i=1}^N\sum_{t=1}^T W_{it} (X_{it} - \overline{X}^\ast_i -\overline{X}^\ast_t + \overline{X}^\ast)^2}\\ & = \frac{\frac{1}{2}\sum_{i=1}^N\sum_{t=1}^T W_{it} (2X_{it} -1) (Y_{it} - \overline{Y}^\ast_i - \overline{Y}^\ast_t + \overline{Y}^\ast) }{\frac{1}{4}\sum_{i=1}^N\sum_{t=1}^T W_{it}}\\ & = \frac{1}{\sum_{i=1}^N\sum_{t=1}^T D_{it}}\sum_{i=1}^N\sum_{t=1}^T W_{it} (2X_{it}-1) (Y_{it} - \overline{Y}^\ast_i - \overline{Y}^\ast_t + \overline{Y}^\ast) \\ & = \frac{1}{\sum_{i=1}^N\sum_{t=1}^T D_{it}}\sum_{i=1}^N\sum_{t=1}^T W_{it} (2X_{it}-1)Y_{it} \\ & = \frac{1}{\sum_{i=1}^N\sum_{t=1}^T D_{it}} \sum_{i=1}^N \sum_{t=1}^T \left\{\left(\sum_{i^{\prime}=1}^N \sum_{t^{\prime}=1}^T w_{it}^{i^{\prime} t^{\prime}} \right) (2X_{it}-1)Y_{it} \right\} \\ & = \frac{1}{\sum_{i=1}^N\sum_{t=1}^T D_{it}} \sum_{i^{\prime}=1}^N \sum_{t^{\prime}=1}^T \left\{ X_{i^{\prime} t^{\prime}} \left(\sum_{i=1}^N \sum_{t=1}^T w_{it}^{i^{\prime} t^{\prime}} (2X_{it}-1)Y_{it} \right) + (1-X_{i^{\prime} t^{\prime}}) \left(\sum_{i=1}^N \sum_{t=1}^T w_{it}^{i^{\prime} t^{\prime}} (2X_{it}-1)Y_{it} \right)\right\} \\ & = \frac{1}{\sum_{i=1}^N \sum_{t=1}^T D_{it}} \sum_{i^{\prime}=1}^N \sum_{t^{\prime}=1}^T D_{i^{\prime} t^{\prime}}\left\{X_{i^{\prime} t^{\prime}} \left( Y_{i^{\prime} t^{\prime}} - Y_{i^{\prime}, t^{\prime}-1} - \frac{\sum_{(i,t^{\prime})\in {\mathcal{N}}^{\textsf{DiD}}_{i^{\prime} t^{\prime}}}Y_{it^{\prime}}}{\# {\mathcal{N}}^{\textsf{DiD}}_{i^{\prime} t^{\prime}}} + \frac{\sum_{(i,t) \in {\mathcal{A}}^{\textsf{DiD}}_{i^{\prime} t^{\prime}}} Y_{it}}{\# {\mathcal{A}}^{\textsf{DiD}}_{i^{\prime} t^{\prime}}}\right)\right. \nonumber \\ & \quad+ \left. (1-X_{i^{\prime} t^{\prime}}) \left( Y_{i^{\prime}, t^{\prime}-1} + \frac{\sum_{(i,t^{\prime})\in {\mathcal{N}}^{\textsf{DiD}}_{i^{\prime} t^{\prime}}}Y_{it^{\prime}}}{\# {\mathcal{N}}^{\textsf{DiD}}_{i^{\prime} t^{\prime}}} - \frac{\sum_{(i,t) \in {\mathcal{A}}^{\textsf{DiD}}_{i^{\prime} t^{\prime}}} Y_{it}}{\# {\mathcal{A}}^{\textsf{DiD}}_{i^{\prime} t^{\prime}}} - Y_{i^{\prime} t^{\prime}} \right)\right\}\\ & = \frac{1}{\sum_{i=1}^N \sum_{t=1}^T D_{it}} \sum_{i=1}^N \sum_{t=1}^T D_{it} (\widehat{Y_{it}(1)} - \widehat{Y_{it}(0)}) = \hat\tau_{{\textsf{DiD}}} \end{align*} $$
where the seventh equality follows from the fact that, given
 ${\mathcal {M}}_{i^{\prime } t^{\prime }}^{\textsf {DiD}}$
and
 ${\mathcal {N}}_{i^{\prime } t^{\prime }}^{\textsf {DiD}}$
, all the units in
 ${\mathcal {A}}^{\textsf {DiD}}_{i^{\prime } t^{\prime }}$
are under the opposite treatment status (i.e.,
 $a_{i^{\prime } t^{\prime }}=0$
), and thus
 $K_{i^{\prime } t^{\prime }}=1$
(see Proposition 2).
Acknowledgments
The methods described in this paper can be implemented via the open-source statistical software, wfe: Weighted Linear Fixed Effects Estimators for Causal Inference, available through the Comprehensive R Archive Network (https://cran.r-project.org/package=wfe). Earlier versions of this paper were entitled, “Understanding and Improving Linear Fixed Effects Regression Models for Causal Inference,” and “On the Use of Linear Fixed Effects Regression Estimators for Causal Inference.” (Imai and Kim Reference Imai and Kim2011). We thank Clement de Chaisemartin and anonymous reviewers for helpful comments.
Supplementary material
For supplementary material accompanying this paper, please visit https://doi.org/10.1017/pan.2020.33.