The interactions between non-esterified fatty acids (NEFA), insulin and glucose in animals in general and dairy cows in particular have been extensively investigated (Frohl & Blum, Reference Frohl and Blum1988; Sechen et al. Reference Sechen, McCutcheon and Bauman1989; Lemsoquet et al. Reference Lemsoquet, Rideau, Rulquin, Faverdin, Simon and Verite1997) but a quantitative approach is required to gauge the relative importance of the various interactions. Kinetic compartmental models of systems are useful since they not only enable quantification of the processes involved, but also facilitate the conceptualization of the system under consideration and may enable new insights into the physiological system. The glucose minimal model is a good example of a model that has facilitated advances in understanding of the interaction between glucose and insulin (Bergman et al. Reference Bergman, Ider, Bowden and Cobelli1979; Bergman & Bowden, Reference Bergman, Bowden, Cobelli and Bergman1981; Opsomer et al. Reference Opsomer, Wensing, Laevens, Coryn and de Kruif1999).
A similar type of minimal model to describe NEFA kinetics could produce parameters related to the rate of NEFA production and disposal and might have application in understanding such phenomena as low milk-fat syndrome, fatty liver syndrome, the metabolic control of body condition score change and the genetic control of high milk-fat production. Recently, Thomaseth & Pavan (Reference Thomaseth, Pavan, Hargrove and Berdanier2003) presented a minimal model type compartmental model which aimed to describe the dynamic short term changes that occur (in vivo) in plasma NEFA concentrations in response to an intravenous glucose tolerance test (IVGTT). This model (hereafter called the Thomaseth model) has been employed to describe the time-course of plasma NEFA concentrations in man following either a standard IVGTT, an insulin-modified IVGTT, or an oral glucose tolerance test. Moate et al. (Reference Moate, Roche, Chagas and Boston2007), evaluated the usefulness of the Thomaseth model for describing NEFA kinetics in lactating cows and concluded that there were aspects that made it unsuitable for describing NEFA kinetics in lactating dairy cows.
A further attempt at modelling NEFA kinetics in man was recently undertaken by Roy & Parker (Reference Roy and Parker2006). Their model, hereafter called the Roy model, is certainly an extension of Bergman's glucose minimal model. However, the Roy model cannot be described as ‘minimal’ since the authors extended the glucose minimal model by introducing five additional compartments and eight additional rate constants. The Roy model employs six differential equations to describe: plasma glucose concentration, plasma insulin concentration, insulin action (related to action on glucose), remote insulin concentration (related to insulin action on NEFA utilization), plasma NEFA concentration, and non-accessible NEFA (which affects glucose uptake in the hepatic and peripheral tissues).
A meritorious feature of the Roy model over that described by Thomaseth & Pavan (Reference Thomaseth, Pavan, Hargrove and Berdanier2003) is the concept of a new and separate remote insulin compartment, Y(t), to describe the specific effect of insulin on the rate of change of plasma NEFA. However, the Roy model has insulin action increasing the rate of disappearance of NEFA from the plasma, when it is generally accepted that one of the main effects of elevated plasma insulin concentrations with respect to NEFA is the inhibition of lipolysis within adipocytes and the associated cessation of NEFA flow into circulation (Frayn et al. Reference Frayn, Coppack, Fielding and Humphreys1995; Ferrannini et al. Reference Ferrannini, Camastra, Coppack, Flisher, Golay and Mitrakou1997). Whilst it is beyond the scope of this article to fully describe the complexities of the Thomaseth and Roy models, it appears that major deficiencies of both models are structures that are incapable of describing the supra-basal rebound in the plasma concentration of NEFA that occurs during the terminal phase of an IVGTT.
The principal aim of the present work was the development of a novel ‘minimal model’ which is consistent with physiological processes and is capable of accurately describing all of the dynamic features present in the NEFA response to an IVGTT in dairy cows.
Materials and Methods
NEFA model
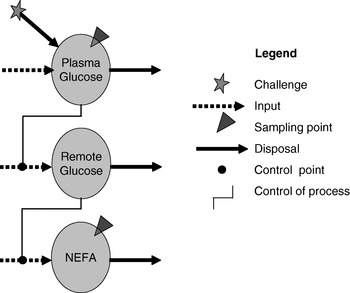
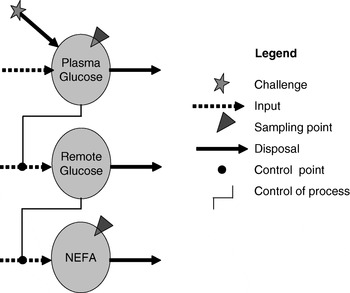
The NEFA compartmental model presented here (henceforth called the Boston model) is encapsulated in the following differential and ancillary equations. A schematic of the model is presented in Fig. 1.
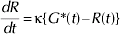






where t represents the time in min after an intravenous injection of glucose; G(t) [mmol/l] is a function describing the plasma glucose concentration and it is obtained by linear interpolation of the plasma glucose data; Gb [mmol/l] is the initial or basal glucose concentration, g s [mmol/l] is a parameter which defines a threshold or ‘set-point’ in plasma glucose concentration above which elevated levels of plasma glucose result in entry of plasma glucose into a ‘remote’ or inaccessible glucose compartment denoted by R(t) [mmol/l]. The constant κ [min−1] is a fractional rate constant describing the movement of plasma glucose (above g s) into a remote compartment; NEFA(t) represents the plasma NEFA concentration [μmol/l] at time t. The unit-less function h(t) which takes values between 0 and 1, is calculated by an equation which describes the inhibition of NEFA production as a proportion of the NEFA production which occurs when remote glucose is zero. The parameter Φ [mmol/l] is a Michaelis Menten type affinity constant which modulates the extent to which remote glucose inhibits the provision of NEFA to the plasma pool. The initial remote glucose concentration, R(0) is assumed to be zero and the initial NEFA concentration, NEFA 0 [μmol/l] is the NEFA concentration measured at time zero, while NEFA END [μmol/l] is the NEFA concentration measured at 240 min. The two main parameters which can be obtained from this model are S FFA [μmol l−1 min−1] and K FFA [min−1]. The parameter S FFA describes the rate of provision of NEFA to the plasma pool, and it must therefore represent a combination of the rate of lipolysis and the rate at which NEFA appear in blood as a result of intestinal absorption; K FFA is a fractional rate constant describing the rate at which NEFA leaves the plasma pool, and K FFA must therefore represent both oxidation of fatty acids, the sequestration of fatty acids into adipose tissue and the uptake of fatty acids by the mammary gland for the production of milk fat.
A schematic of the mechanistic model developed to describe the pattern of change in plasma NEFA concentrations following an intravenous glucose tolerance test.
Experimental data
The experimental data used to evaluate this model were the same as those used to evaluate the Thomaseth model (Moate et al. Reference Moate, Roche, Chagas and Boston2007). Briefly, ten multiparous Holstein-Friesian dairy cows (4·6±1·43 years old and weighing 539±72·6 kg; mean±sd) from two diverse genetic strains (North American, n=3; or New Zealand, n=7) and three feeding treatments (a generous allowance of pasture plus a daily allowance of 0, 3 or 6 kg concentrate dry matter/cow; n=5, 3 and 2 cows, respectively) and producing 31·9±5·96 kg milk/d, 1·4±0·19 kg fat/d, 1·1±0·20 kg protein/d and 1·6±0·28 kg lactose/d (4·46±0·655%, 3·43±0·094% and 4·87±0·115% fat, protein and lactose, respectively) were subjected to a standard IVGTT without exogenous insulin. The cows were in early lactation (35±2·3 days in milk) and were intentionally selected for a diversity of origin and nutrition treatments to ensure as far as possible, a diverse range of NEFA responses.
Indwelling catheters were placed in the left jugular vein of each cow 24 h before the IVGTT, and cows were fasted for 12 h before glucose infusion. Glucose (300 mg/kg body weight) was infused via the left jugular vein into each cow over a 2-min period and the line was flushed with saline solution. Blood samples from each cow were withdrawn 5 min before (−5 min) and immediately prior to (0 min) glucose infusion. Further samples were collected at 2, 4, 6, 8, 10, 12, 15, 18, 20, 23, 26, 30, 35, 40, 50, 60, 90, 120, 150, 180, 210 and 240 min relative to the time of infusion. Blood was collected in 10-ml heparin-coated blood tubes (100 i.u. heparin/ml blood), centrifuged at 1120 g at 4°C for 10 min, plasma extracted and frozen until analysed for glucose and NEFA. Analyses for NEFA (colorimetric method) and glucose (hexakinase method) were performed on a Hitachi 717 analyzer (Roche, Basel, Switzerland) at 30°C by Alpha Scientific Ltd., Hamilton, New Zealand. The inter-assay and intra-assay CV was <2%.
Model fitting
The model was implemented using WinSAAM (http://www.winsaam.org) and the model was fitted to the NEFA and glucose data using generalized least squares (Stefanovski et al. Reference Stefanovski, Moate and Boston2003). In fitting the model to the data, G b and NEFA 0 were fixed at the time zero values for plasma glucose and NEFA respectively. The five adjustable variables in the model were: κ, S FFA, K FFA, g s and Φ.
Results and Discussion
Our objective was to develop a novel ‘minimal model’ for NEFA kinetics, which is consistent with physiological processes and is capable of accurately describing all of the dynamic features present in the NEFA response to an IVGTT in dairy cows. The reported model is truly ‘minimal’ in that it employs a minimal number of compartments and parameters (the principle of parsimony) to describe the dynamic NEFA response to an IVGTT. This feature distinguishes it from the model described by Roy & Parker (Reference Roy and Parker2006) which contains five additional compartments, four additional differential equations and eight additional rate constants compared with the Bergman minimal model.
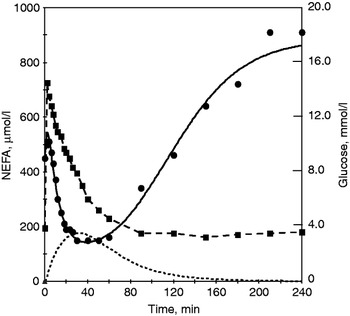
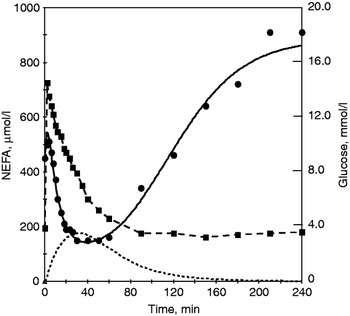
The Boston model is novel in that it employs a ‘remote’ or inaccessible glucose compartment as a driver of NEFA kinetics, in comparison to the Thomaseth model which utilizes plasma insulin. Furthermore, the Boston model was able to accurately describe the plasma NEFA response up to 240 min following a glucose challenge in all ten of the cow data sets that were examined. In comparison, the Thomaseth model, when applied to the same datasets, failed to describe the supra-basal NEFA concentrations observed after approximately 150 min (Moate et al. Reference Moate, Roche, Chagas and Boston2007). Figure 2 presents a typical example of how well the model predicts the NEFA response to an IVGTT challenge. Table 1 presents the best fit mean estimates of the model parameters for lactating dairy cows.
A typical example of plasma glucose data (boxes), plasma NEFA data (dots), model predictions of plasma NEFA (solid line) and remote glucose, R(t) (dotted line) for an individual cow. The parameter estimates (±CV %) for this cow are: κ=0·0289 (±5·84) [min−1], S FFA=151·4 (±10·77) [μmol l−1 min−1], K FFA=0·171 (±9·43) [min−1], g s=3·98 (±3·824) [mmol/l], NEFA 0=450 [μmol/l], NEFA END=910 [μmol/l], Gb=3·9 [mmol/l], Φ=0·65 (±0·051) [mmol/l].
Parameter estimates for the model of NEFA kinetics in lactating dairy cows subjected to an intravenous glucose tolerance test

The Boston model has a number of compelling features. It can describe the general shape of all of the NEFA response curves that we have examined (Fig. 2). It can describe the initial latency period apparent in some particular datasets (see Fig. 2), whereas the Thomaseth model is unable to describe this latency phase. The presence of a latency phase in the NEFA response of some individuals has previously been reported in man (Sumner et al. Reference Sumner, Bergman, Vega, Genovese, Cochran, Pacak, Watanabe and Boston2004) and dairy cows (Moate et al. Reference Moate, Roche, Chagas and Boston2007). There is a sound physiological reason for the observed latency period, and a model's ability to accurately account for it is important. Failure of the Thomaseth model to account for this latency period is likely to cause inaccurate estimation of K FFA.
The Boston model can, in all cases, describe the initial down-slope which reflects the rate of removal of NEFA, and it can well describe the extended nadir which occurs in some instances (see Fig. 2). Furthermore, it can well describe the rebound phase in NEFA kinetics, especially the plateau phase which in some cases is more than three-times the initial NEFA concentration. This capability is in contrast to the Thomaseth model, which predicts that NEFA concentrations can only rebound as high as the initial NEFA concentration. Although able to describe this supra-initial NEFA concentration, one limitation of the model is that it predicts that NEFA concentrations remain indefinitely at this plateau concentration equivalent to S FFA/K FFA. Thus, an assumption inherent in this model is that the plateau NEFA concentration (NEFAEND) is more representative than NEFA0 of the true ‘steady state’ concentration of NEFA. In support of this contention, it can be seen in Fig. 2 that for the first 10 min after the glucose challenge, the plasma NEFA concentration was rising steeply demonstrating that at time zero, this cow was not in steady state with respect to NEFA. This was also the case for several other cows in the investigation. In most compartmental models that describe the homeostatic mechanisms controlling physiological systems, the challenged system eventually returns to basal conditions. However, in the case of the glucose challenge, although plasma concentrations of glucose and insulin usually return to basal concentrations within 4 h, the concentration of NEFA may remain at a supra-initial NEFA concentration, i.e. the plateau for level, many hours after the glucose challenge. Indeed, since the protocol for an IVGTT specifies that the test subject should be fasted for 12 h prior to the challenge and for the duration of the challenge, it is not certain that in dairy cows, NEFA concentrations would return to the pre-challenge concentration. In support of this possibility, Oikawa & Oetzel (Reference Oikawa and Oetzel2006) showed in dairy cows that plasma NEFA concentrations more than doubled in response to fasting for 24 h. Further research is needed to elucidate the detailed pattern of the NEFA concentrations out to 24 h.
The Boston model provides three parameters (K FFA, S FFA and g s) to quantify NEFA metabolism (Table 1). Usually, in the scientific literature, only limited analysis has been carried out of NEFA response curves to IVGTT, and this largely prevents a detailed comparison of values of kinetic parameters obtained from the Boston model with those obtained by others. Nevertheless, in the lactating cows in this investigation, K FFA, the mean fractional rate of utilization of NEFA, was 0·148±0·046 [min−1], and this value is similar to the value of 0·10±0·04 reported for non-lactating women (Sumner et al. Reference Sumner, Bergman, Vega, Genovese, Cochran, Pacak, Watanabe and Boston2004) but substantially higher than the median value of 0·05 for non-lactating women reported by Thomaseth & Pavan (Reference Thomaseth, Pavan, Hargrove and Berdanier2003). We estimate that the mean rate of provision of fatty acids to the plasma pool was 207±78 [μmol l−1 min−1]. In comparison, Dunshea et al. (Reference Dunshea, Bell and Trigg1990) using a tracer technique in lactating goats, reported a mean NEFA ‘rate of entry’ of 345 μmol kg−1 h−1. Assuming that goats have 50 ml of plasma per kg bodyweight, this equates to 115 μmol l−1 min−1. From the median K FFA and the NEFA 0 reported by Thomaseth & Pavan (Reference Thomaseth, Pavan, Hargrove and Berdanier2003) the rate of provision of NEFA to the non-lactating women in their investigation can be estimated to have been approximately 35 μmol l−1 min−1. In contrast, in King penguins, an animal that during long periods of fasting must rely on extensive mobilization of stored body fat, the rate of entry of NEFA has been estimated at approximately 30 μmol kg−1 min−1 or 600 μmol l−1 min−1 (Bernard et al. Reference Bernard, Orvoine and Groscolas2003). Thus our estimate of the rate of entry or the rate of provision of NEFA is consistent with data from the scientific literature.
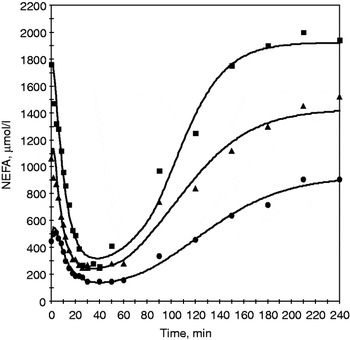
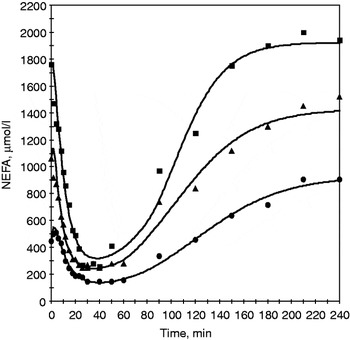
All of the parameters of the model were well identified and there were no problems with estimating these parameters. For each individual cow, all parameters had CV<15% of the corresponding estimated parameter value. Overall, 80% of parameters had CV<10% of their estimated parameter value. The model was able to be fitted to all datasets examined. In 9 out of 10 cases the R 2 values were in excess of 0·98 and the rmse when expressed as a percentage of NEFAEND (rmse %) were all less than 6%. In the worst fitted case, the R 2 was 0·96 and the RMSE % was 8%. Figure 3 depicts three diverse examples showing typical goodness of fit of model predictions to plasma NEFA data.
Three examples showing typical goodness of fit of model predictions to plasma NEFA data.
The model was robust in terms of ease of estimating parameters. For example, for an individual cow's data, even when initial estimates of all model parameters were set at either one-fifth of their final value, or five-times their final value, the model would essentially converge on practically identical estimates of all parameters.
The Boston model relies on a concept of a pool of remote glucose which can inhibit the provision of NEFA to the plasma pool. There are considerable data in the scientific literature supporting the theory that when insulin concentrations within the adipose cells are elevated, then the action of hormone-sensitive lipase (HSL) is reduced and lipolysis inhibited (Ferrannini et al. Reference Frayn, Coppack, Fielding and Humphreys1995). Furthermore, when plasma concentrations of insulin are elevated at the luminal surface of capillaries feeding adipocytes, the action of lipoprotein lipase (LPL) is enhanced resulting in a net increase in the flux of NEFA out of blood into the adipocyte (Frayn et al. Reference Frayn, Coppack, Fielding and Humphreys1995). We consider that elevated levels of remote glucose may be a proxy for elevated concentrations of insulin within the adipose cells and within the capillaries feeding the adipocytes, and this could account for the precipitous decline that occurs in plasma NEFA concentrations soon after the administration of the glucose challenge. Alternatively, there is evidence that elevated glucose concentration per se can inhibit lipolysis within adipose tissue (Park et al. Reference Park, Rhee, Lee, Lee, Koh and Min1990).
As well as elevated concentrations of insulin in plasma, an IVGTT is well known to trigger an extensive cascade of metabolite and hormonal regulatory and counter-regulatory responses. In addition to NEFA, some significant responses occur in glucagon, glycerol and triglycerides (Kerr et al. Reference Kerr, MacDonald and Tattersall1989; Sechen et al. Reference Sechen, McCutcheon and Bauman1989; Lemsoquet et al. Reference Lemsoquet, Rideau, Rulquin, Faverdin, Simon and Verite1997). Besides insulin, the important hormonal responses include HSL, LPL, adrenaline, cortisol and growth hormone (Sechen et al. Reference Sechen, McCutcheon and Bauman1989; Ferrannini et al. Reference Frayn, Coppack, Fielding and Humphreys1995). Some of these hormones almost certainly influence either all or specific phases of the NEFA response to a glucose challenge. However, rather than arbitrarily cherry pick from this extensive group of hormones a single hormone to act as driver for the NEFA kinetic model, we considered that it would be more logical to utilize the plasma glucose concentration per se because, in the IVGTT, it is the plasma glucose signal which triggers the cascade of all the other hormones. The use of elevated remote glucose to inhibit NEFA provision to the plasma pool is perhaps the first time that the concepts inherent in the Randle's Glucose Fatty Acid cycle (Randle et al. Reference Randle, Garland, Hales and Newsholme1963) have been directly employed in a whole-body dynamic model of NEFA kinetics.
The fact that the Boston model utilizes plasma glucose data instead of plasma insulin data to drive the prediction of plasma NEFA concentrations has practical relevance because the measurement of plasma glucose is much simpler and much less expensive than the measurement of plasma insulin.
Ascertaining accurate absolute estimates for whole body rates of NEFA production and utilization is a difficult undertaking and in the current work, without a gold standard, it is not possible to say whether the Boston model produced accurate estimates for these processes. Nevertheless, even without this type of validation, the Boston model can provide relative estimates of NEFA production and utilization and could be used to compare the effects of treatments over time within subjects or between subjects.
Recently, Boston et al. (Reference Boston, Moate and Stefanovski2006) pointed out that the insulin response of lactating dairy cows to an IVGTT is remarkably similar to that which occurs in man and that the parameters of the glucose (Bergman) minimal model measured in dairy cows are of similar magnitude to those measured in man. It has not escaped our attention that the profile of the NEFA response to an IVGTT in dairy cows (Moate et al. Reference Moate, Roche, Chagas and Boston2007) is also remarkably similar to that obtained in man (Sumner et al. Reference Sumner, Bergman, Vega, Genovese, Cochran, Pacak, Watanabe and Boston2004). These surprisingly similar responses in two quite different species indicate that the IVGTT is able to expose fundamental attributes of the system of energy metabolism in these species. The consequences of this similarity are that lessons learned from the elucidation of energy metabolism in man may have some applications in ruminants and that ruminants may be useful models for elucidating human energy metabolism (Allen et al. Reference Allen, Bradford and Harvatine2005). It is therefore appropriate to speculate that although the Boston NEFA model was developed primarily for use in lactating dairy cows, it may also have application in man in the elucidation of disordered glucose and NEFA metabolism that occurs in diabetes, metabolic syndrome and obesity.
Conclusion
We have presented a novel compartmental model to describe NEFA kinetics in lactating cows. The model was consistent with physiological processes, it described all of the major features of the NEFA response to an IVGTT and it provided a number of parameters that can be used to quantify NEFA production and utilization. All parameters were well identified and for individual animals, parameters usually had CV<10% of the estimated parameter values. It is concluded that this model is suitable for describing NEFA kinetics in lactating dairy cows. Further research is foreshadowed in which stage of lactation, genetic production potential and nutritional status are examined for their effects on the parameters of the model.
The authors thank LM Chagas from Dexcel, NewZealand, for making available to us the plasma glucose and NEFA data used to develop this model. We acknowledge the technical assistance of A Sheahan, J Lee, K Watkins, P Gore and P Aspin, the help provided by Dexcel's Lye dairy farm staff, and the laboratory expertise of Alpha Scientific, Hamilton New Zealand. This work was partly funded by New Zealand Dairy Farmers, through the Dairy InSight research fund. RC Boston is partly funded by the Translational Medical Research Project of the University of Pennsylvania.