1. INTRODUCTION
The identification, assessment and mitigation of risk are the central safety responsibilities of ports and harbour authorities. Risk assessments in the maritime industry in the UK have traditionally sought to identify and measure this risk through judgement and expertise; and are ultimately, therefore, limited by their subjectivity. Without quantifiable analysis and scientific rigour this assessment of risk is open to all the human frailties that can contribute to that risk; e.g. assumptions, familiarity and complacency. The ubiquity of AIS has enabled a paradigm of quantitative analysis and modelling techniques to be more readily applied within maritime risk assessments.
The River Thames is one of the busiest waterways in the world and the Port of London Authority (PLA) “has as its primary responsibility the safety of navigation on the tidal Thames” (Port of London Authority, 2011). In the build-up to the London 2012 Olympic Games and a growing demand for increasing the traffic capacity on the Thames it was necessary to conduct a quantitative study to model the traffic risk profile. As part of this study a domain analysis approach was used to model the number of encounters between navigating vessels at peak and non-peak levels of exposure.
1.1. Formal Safety Assessment
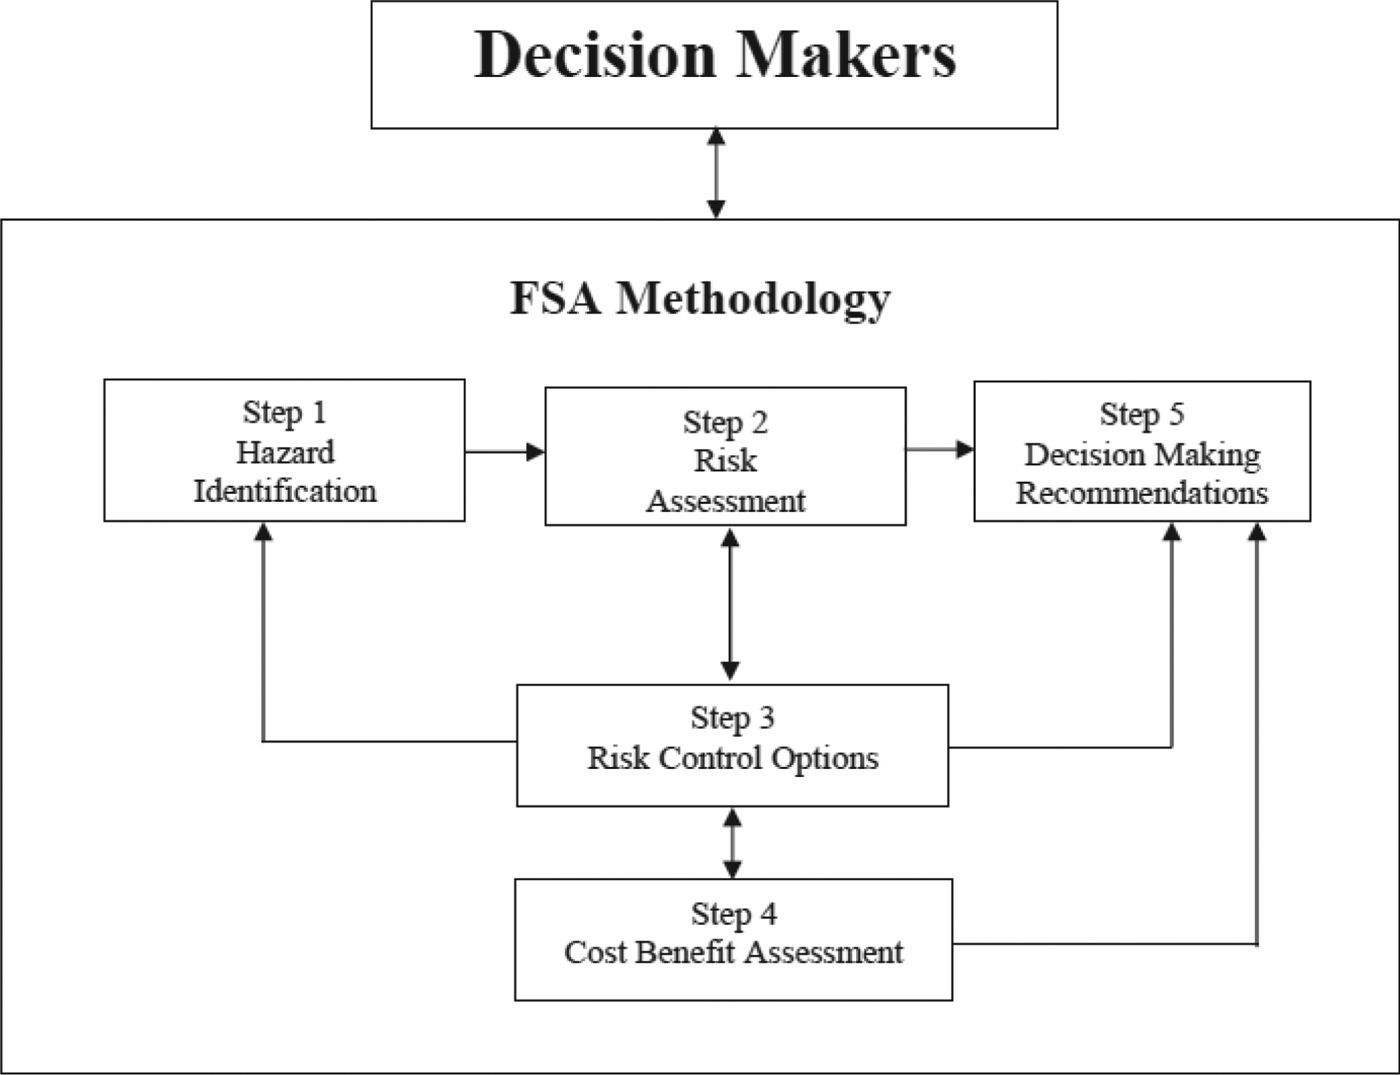
Maritime risk assessments have traditionally been conducted utilising the Formal Safety Assessment (FSA) introduced by the International Maritime Organization (IMO) in 2002 (IMO, 2007). The FSA is a “structured and systematic methodology, aimed at enhancing safety, including protection of life, health, the marine environment and property, by using risk analysis and cost benefit assessment” (IMO, 2007. P.3). The FSA is a five-stage approach developed by the IMO following the reviews of a number of maritime casualties during the 1990s, including the Piper Alpha explosion and the Herald of Free Enterprise sinking. In summary, the approach involves identifying hazards, assessing the risks, identifying appropriate risk mitigation measures, undertaking a cost benefit assessment and, finally, presenting recommendations (Figure 1).
The IMO's Formal Safety Assessment Methodology.

The FSA recommends that the “characterization of hazards and risks should be both qualitative and quantitative, and both descriptive and mathematical, consistent with the available data” (IMO, 2007. P.5). A central recommendation of hazard identification is a review of a port's historical incident records with regard to location, type and characteristics to determine if any patterns exist. The use of historical records to predict future risk is fraught with difficulty and has been widely explored in the general literature (Adams, Reference Adams1995). This approach is inherently limited to the accuracy and completeness of the port's incident records, and the widespread underreporting of near misses in all industries (ibid.). Maritime incidents are also rare events and so prohibit the analytical approaches favoured by road risk assessments. Furthermore where no incident has been recorded there may still be a significant risk (Kontovas and Psaraftis, Reference Kontovas and Psaraftis2009) and where incidents have been recorded it does not dictate that it is more likely that an incident will occur there again. For example masters will compensate to a perceived area of risk of collision by slowing down or keeping a more alert watch. Similarly the statistical phenomenon of regression to the mean suggests that normal fluctuations in incident numbers exist and incident hot spots may naturally dissipate (Adams, Reference Adams1995). The FSA recognises these limitations and, in the absence of available datasets, “expert judgement, physical models, simulations and analytical models may be used to achieve valuable results” (IMO, 2007. P.6).
1.2. Risk Assessments in UK Ports Industry
Within the United Kingdom the Department for Transport (DfT) has published good practice guidelines in the form of the Port Marine Safety Code (PMSC). The PMSC is flexible and non-mandatory, and “aims to enhance safety for those who use or work in ports, their ships, passengers and the environment [using] the well-established principles of risk assessment” (DfT, 2012. P.6). Part of this code recognises that a risk assessment of the safety of navigation should be undertaken and regularly reviewed. “The process of assessment is continuous, so that new hazards to navigation and marine operations and changed risks are properly identified and addressed” (ibid. P.19).
Risk assessments undertaken by ports are mostly qualitative, relying on expert judgement for a number of reasons. Firstly, the industry workforce lacks the appropriate skills and training required to undertake computer modelling or quantitative analysis, and where that capability exists there is often insufficient data. Secondly, the employment of sufficiently qualified personnel with the resources and software to undertake quantitative analysis is a significant overhead for the ports sector, especially when there is no legislative requirement for them to do so. Thirdly, where external support is required to undertake these studies, they can become ‘one-offs’ with no regular review.
1.3. Study Objective
The principal objective of the study was to improve the assessment of navigational risk through quantitative analysis. The study area is of particular concern to the PLA as it constitutes the busiest area of the river in terms of traffic movements and, as such, has the highest perceived risk profile. There is considerable commercial pressure to increase the capacity of traffic on the river and to consent to new waterfront developments; however not at the expense of navigational safety. Furthermore it is within this section that London's worst maritime disaster in recent years occurred when the Marchioness, a late night party boat, was struck by a dredger, killing fifty-one people (MAIB, 1990).
1.4. Study Area
The scope for this project was to analyse the traffic profile of a three nautical mile stretch of the River Thames in Central London extending from Lambeth Bridge to Wapping Ness (Figure 2). These limits were chosen as Lambeth Bridge marks the upstream limit of High Speed Craft (HSC) ferry operations, and Wapping Ness marks the downstream limit of an advisory 12 knot speed limit. This stretch of the river is navigationally complex with eleven arched bridges, multiple piers and moorings, and strong tidal streams. A multitude of river users include passenger craft, high speed ferries, tugs with towed barges and sightseers travelling between the multiple piers, operating on different timetables. In addition the area is used by various types of recreational craft varying from narrow boats and motor cruisers to rowing boats and canoes, the vast majority of which do not have AIS.
Study area with selected features.
2. METHODOLOGY
The project utilised a number of quantitative analysis techniques centred on vessel traffic analysis and statistical analysis of historical incident records. In this paper we focus on the use of domain analysis to measure collision risk. This section will briefly outline the theoretical underpinnings of domain analysis and how this approach was practically applied in this study.
2.1. Domain Analysis
The concept of a ship domain is one that has been widely discussed in the academic literature, much within this journal. The work originates in Japan in the 1960s and 1970s with Fujii and Tanaka (Reference Fujii and Tanaka1971). Goodwin (Reference Goodwin1975) describes a vessel domain as “the surrounding effective waters which the navigator of a ship wants to keep clear of other ships or fixed objects” with the contravention of the respective domains between two vessels representing a threat to navigational safety (Pietrzykowski and Uriasz, Reference Pietrzykowski and Uriasz2009) and reasonably able to be used to indicate the risk of collision.
There are a plethora of proposals as to the design, size and shape of a ship's domain (Fujii and Tanaka, Reference Fujii and Tanaka1971; Goodwin, Reference Goodwin1975; Pietrzykowshi and Uriasz, Reference Pietrzykowski and Uriasz2009; Wang, Reference Wang2013; Hansen et al., Reference Hansen, Jensen, Lehn-Schiøler, Melchild, Rasmussen and Ennemark2013). Wang et al. (Reference Wang, Meng, Xu and Wang2009) and Jingsong et al. (Reference Jingsong, Zhaolin and Fengchen1993) provide particularly good comparisons of the varying domain methodologies. These domains can range from simple circular buffers to more complex, segmented and dynamic shapes. The size and shape can change depending on several factors including the physical characteristics of the vessels, the COLREGS situation, manoeuvrability, the human element, met ocean conditions and fairway characteristics.
2.2. Domain Design Employed
Due to the characteristics of the study area it was necessary to develop a more appropriate domain methodology than that proposed in the literature. Consultation was undertaken with stakeholders (e.g. PLA staff, river users and other navigational experts) to develop a domain that best characterises navigation on the Thames. The domain concept developed consists of a fixed seven-metre buffer around each vessel with a dynamic ‘nose’ that extends forward dependent upon a reaction distance (Figure 3). The consultation identified that due to the high concentration of vessels and current practice of mariners who regularly operate in close quarters, the average beam of a Thames passenger vessel (7 metres) should be used as the minimum distance. A reaction distance as opposed to a stopping distance was chosen for a number of reasons that better reflected the navigation of vessels on the river. Firstly, a vessel would be far more likely to alter course to avoid a collision than to fully stop, and therefore the distance is comparatively less. Secondly, the accurate computation of stopping distance without access to either design drawings or specific vessel characteristics is difficult. Thirdly, the considerable tidal stream speeds in the study area inhibit the ability of vessels to stop, thus complicating the calculation of the vessel's actual stopping distance. Precedents exist in the literature on vehicle reaction distances but also in the use of a “Moving Prohibited Zone of 1000 metres ahead and 100 metres to either side” for commercial vessels entering or departing Southampton through the Solent (Port of Southampton, 2013. P.15).
Proposed domain shape surrounding a vessel outline. Nose extends forward depending on type of vessel and speed over ground.
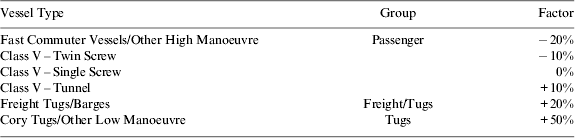
The reaction distance represented by the ‘nose’ forward was calculated by multiplying the distance that a vessel would travel in ten seconds, given its current speed over ground, by a vessel manoeuvrability factor represented with a percentage (Table 1). An assessment meeting was undertaken with local stakeholders to grade the comparative manoeuvrability of a number of different types of vessels navigating the Thames, including those not categorised in Table 1. Thereby a single screw passenger ferry transiting at ten knots would travel 51 metres in ten seconds, as would a tug with towed barge. However the latter is considered less manoeuvrable and so a factor of +50% was applied to increase the reaction distance to 75 metres. A minimum ‘nose’ length of seven metres is required to maintain a consistent buffer for vessels transiting at very slow speeds or moored alongside.
Vessel type factors.
2.3. Automatic Identification System (AIS)
The principal input used for the construction of vessel domains for this study was AIS data provided by the PLA's Vessel Traffic Services (VTS). AIS datasets are commonly recorded by port authorities and overcome many of the difficulties of radar (Goodwin, Reference Goodwin1975). Several data quality issues were encountered when utilising AIS data for domain analysis (see further details in Section 4.3). AIS is a time-division multiple access scheme broadcasting information over Very High Frequency (VHF) radio waves, where vessels transmit packets of dynamic and static information at different time-slots. Static data of vessel information such as vessel type, dimensions and name are broadcast every six minutes, and dynamic information such as position and course are broadcast at intervals, dependent upon the speed and navigational status of that vessel. AIS exists in two forms, Class A and Class B. Class A is fitted on vessels that are required to carry AIS under SOLAS Chapter V (IMO, 2002) and Class B is fitted to other vessels, generally of a smaller size. The PLA have local byelaws in place that govern the carriage of a local derivative of Class A AIS for use by regular River Thames vessels (Port of London Authority, 2006).
The normal reporting intervals for Class A AIS are: (IMO, 1998):
• 3 minutes for a vessel at anchor (speed of less than 3 knots);
• 10 seconds for a vessel on transit (speed less than 14 knots);
• 4 seconds for a vessel on transit and changing course;
• 6 seconds for a vessel on transit (speed between 14 and 23 knots); and
• 2 seconds for a vessel on transit (speed greater than 23 knots) or changing course (speed greater than 14 knots).
Class B AIS transmits at three minutes for a vessel at anchor or 30 seconds for a vessel in transit. Furthermore, the AIS transmission slots are self-organising and so fluctuations will occur in the established reporting intervals. There is therefore a huge differential within any AIS dataset over which transmissions are sent. In order to undertake domain analysis, directly comparing vessel positions at identical times, it was therefore necessary to standardise the temporal interval. To achieve this standardisation, an algorithm was created that interpolated AIS positions to an interval of ten seconds, in line with Class A reporting with a speed of less than 14 knots, representative of normal navigation within the study area (Figure 4). Interpolation was stopped if a vessel left the study area or if no transmission was received for five minutes.
Interpolation methodology for AIS data to standardise domain analysis.
2.4. Creation of model
Twenty-two hours of data were analysed during peak and non-peak summer traffic periods representing different times of day, states of tide and vessel exposure. The AIS information was entered into a Geographical Information System (GIS) and interpolated to ten second intervals, and vessel outlines with a representative bow shape were constructed using the dimensions in AIS Message 5 orientated by the vessel's heading, or if unavailable her course (see Section 4.3). Domains were created around each vessel outline using a seven metre buffer and dynamic nose. Each vessel outline and domain was given the attributes of the interpolated AIS position from which it was created.
Example output from domain model at Tower Pier showing vessel domain encounters highlighted in red.
An ArcObjects-based GIS script was created that cycled through each ten second time stamp of each vessel position, to calculate whether a contravention (in which two domains overlap) had occurred, and store key characteristics regarding that encounter. In particular the following information was extracted and stored in a database with an encounter time and location:
• The type and name of vessels involved in the contravention;
• The distance between vessels;
• The speed of the encountering vessels;
• The type of encounter; overtaking, crossing or head-on; and
• Whether the contravention was a prolonged encounter, whereby the same two vessels had encountered in the previous ten-second time stamp.
Initial trial runs of this analysis extracted a considerable number of encounters that were not navigationally significant, such as two vessels moored alongside. A filter was therefore employed to discount any encounter between two moored vessels: defined as two vessels within 40 metres of a berth or mooring with a speed over ground of less than half a knot. Secondly, where a series of prolonged encounters occurred, only the encounter at the closest distance was retained. Without filtering, the results showed a considerable number of overtaking encounters whose prolonged occurrence extended for more than several hundred metres and made the interpretation of the results difficult.
3. RESULTS
The results of the analysis were presented in four ways, both geographically and statistically. Firstly, a fast time video of traffic was created for each model run to provide an overview (Figure 5). Secondly, the cumulative density for all model runs was calculated (Figure 6). Thirdly, each period was plotted to show the locations of contraventions and the encounter distance, average speed of vessels at encounter and encounter type (Figure 7). Finally, statistical analysis was undertaken on the results to analyse relationships between traffic levels, time of day and tidal state with the numbers and locations of encounters.
Total number of encounters for twenty-two hours of analysis.
Domain analysis results from 15 July 2011.
The cumulative plot of total contraventions in all study slots shows a concentration of encounters within two distinct areas; namely between Tower Pier and HMS Belfast, and the London Eye and Westminster Pier (Figure 6). Of the contraventions recorded, 49% were overtaking situations and 41% were head on, which, given the longitudinal nature of traffic on the Thames, was in line with expectation.
Encounters at Tower and Westminster are particularly concentrated for a number of reasons. These are the busiest piers (in terms of total movements) within the study area and are also at the narrowest parts of the river, excluding bridges. As the busiest piers, they are most likely to reach full capacity, requiring vessels to wait within the navigational channel for a vessel to leave before they can come alongside, thereby possibly obstructing other navigating vessels. At Tower Pier the distance between the pier and HMS Belfast is only 115 metres. With a cruise ship or warship moored alongside HMS Belfast and vessels alongside Tower Pier, as was the case in several of the model analysis periods, this distance is reduced to as little as 85 metres. Both these sites therefore represent considerable squeeze points in traffic flow along the river. Furthermore, Tower Bridge is one of London's most popular tourist attractions and passenger vessels on regular sightseeing trips will often perform a slow turn in the vicinity to allow photographs to be taken, becoming obstacles for other navigating vessels.
Plots produced for each slot also indicated a spatial difference in the severity of the contraventions. Those encounters that occurred away from piers were generally of higher speed and were comparatively less close than those located near the piers (Figure 7). However, a notable exception to this rule is apparent when comparing the encounter speeds from Tower Pier to Westminster Pier. Westminster Pier is the upstream limit of operation for a number of passenger vessels and this greatly reduces the number of through traffic movements. Tower Pier is, however, within the operational range of the majority of London's passenger boat services. This results in vessels transiting at 12 knots past other vessels waiting at slow speed near to Tower Bridge and Tower Pier. This speed differential poses a significant difference in the potential consequences for vessel collisions between these locations for which the number of encounters was broadly similar.
Statistical analysis was undertaken on the results of each model run to compare the number of contraventions to the total exposure of all vessels transiting in the study area. To measure the relative numbers of vessels in each model we used the concept of exposure rather than number of transit movements. Vessel movements are often used to produce an accident rate; so, if an incident occurred, and there were ten ship transits, then logic dictates that there is a one in ten probability that a vessel will have an incident. However a slow vessel may transit a channel at six knots taking one hour, and a fast vessel may transit at 12 knots taking half an hour. It could therefore be argued that as the slower vessel has twice the transit time, her exposure to risk is twice as great. Similarly, a movement assumes a simple linear track; however vessels in London have far more complex behaviour. This approach has been used historically, partly through a lack of a method to calculate exposure, as ports will typically keep detailed records of vessel movements for billing purposes. We use AIS to overcome this difficulty and calculate the exposure of all vessels within the study area for each hour slot by counting the total number of interpolated positions for all ships. Therefore, the total exposure of a vessel with six interpolated ten-second positions is one minute.
A positive relationship between exposure and the number of contraventions was shown; however, the relationship seems to be non-linear, indicating that increasing the capacity of the river traffic in Central London disproportionately increases the number of contraventions (Figure 8).
It is not possible to elicit further details from this relationship from the analysis undertaken due to the limited sample size and distribution of exposure hours.
Relationship between total vessel exposure and number of contraventions for each hour of the study periods.
4. DISCUSSION
The methodology and results we have presented above show how a quantitative analysis technique can be used to assess the risk of collision between vessels and then relate that to port capacity. In this section we highlight the advantages that a domain analysis approach can contribute to the analysis of maritime risk to support the Formal Safety Assessment. However, we also identify three conceptual issues that were encountered during this study that must be accounted for during the methodological design of domain analysis.
4.1. Domain Analysis as a Risk Assessment Tool
Previous attempts to quantify the collision risk between vessels within a port using the FSA approach have typically relied upon historical accident statistics that, as mentioned above, have limitations when used in isolation. Where quantitative techniques have been used the studies are often limited to static displays of vessel tracks recorded by AIS, without any further analysis and relying on expert comment to assess the risk. Within the study area this approach provides little meaning due to the concentration of tracks, making both individual tracks and collective patterns indistinguishable. One method to overcome the latter of these issues is to undertake density analysis whereby a Cartesian grid network is characterised by the total number of vessel transits that intersect it and will highlight localised vessel concentrations. Figure 9 shows marked concentrations of traffic in the middle of the river and a dramatic reduction in density upstream of Westminster Bridge. Furthermore the starboard-side traffic patterns are visible in a number of areas but become convoluted at Westminster and Tower Piers, suggesting localised concentrations of vessel activity. These areas of concentration suggest vessels navigating in close proximity but unlike through Domain Analysis, give no indication of actual encounters as the temporal element is ignored.
Vessel transit density for two weeks in July 2011.
The same conclusions can be reached utilising ‘Gate’ Analysis whereby a transect is created across a linear traffic flow and frequency distributions of track intersections graphed. Figure 10 below shows frequency gates on the Thames including a typical near-normal distribution of starboard side traffic flow for upstream and downstream navigating vessels with some slight overlap in the middle of the channel for overtaking vessels. However at Westminster Pier this distribution has a more uniform shape resulting from non-transit vessels turning and coming alongside the pier.
Gate analysis undertaken for two weeks of July 2011 in different parts of the River Thames. (Wapping Ness Top, and Westminster Pier Bottom)
The analysis techniques described above provide only static views of macro traffic patterns and therefore fail to reflect the dynamic temporal nature of maritime navigation at the scale of an individual vessel. As such, the techniques fall foul of the ecological fallacy, the system-wide traffic profile is analysed and is deemed to be representative of individual vessels. It is often the master who navigates abnormally who puts his vessel most at risk. Domain analysis is able to provide a temporal dimension to risk analysis, taking into account the navigation of each individual vessel, and their relationships with other water users, to provide a more nuanced appreciation of risk than other methodologies.
4.2. Local Sensitivity
For Domain Analysis to provide meaningful results, the methodology must be tailored to the geography and objectives of the study. The literature on domain analysis proposes domains between 0·85 nautical miles (Goodwin, Reference Goodwin1975) and three times the ship length (Fujii and Tanaka, Reference Fujii and Tanaka1971). Such an approach is clearly inadequate in the Central London environment, as contraventions would occur between any passing vessels. The designs of domains for ocean navigation often use vessel turning circles as a lateral design parameter, extending the domain laterally a considerable distance. The Thames in Central London can be less than 100 metres wide with up to three vessels transiting abeam; any domain that extended laterally to this degree would likely contravene with any other passing vessel on the river.
The size and shape of a domain should also take into account the local customs of navigation in the study area. Different places have different perceptions of collision risk; two VLCCs within three ship lengths are not comparable to two Thames passenger vessels at the same relative distance. The masters of vessels on the Thames are aware that they operate in some of the most confined and busiest waterways in the world and will likely compensate for this perceived risk, for example by keeping a better lookout or reducing speed. The domains do not therefore need to be as large as in offshore areas where the perceived risk is perhaps lower. Therefore, the use of a global, ubiquitous domain design without local sensitivity would not provide meaningful results of interest to a harbour authority.
4.3. Data Availability and Quality
A major consideration in a domain study design concerns data issues, particularly the unavailability and any limitations concerning its quality. The approaches outlined in the literature require a considerable amount of detailed information concerning the vessel and its environment in order to calculate the domain shapes and sizes (Wang et al., Reference Wang, Meng, Xu and Wang2009; Jingsong et al., Reference Jingsong, Zhaolin and Fengchen1993). The accurate computation of vessel turning circles, for example, requires access to agent specifications, the forces experienced on board requires specialist sensors, and environmental characteristics require recording of hydrodynamic and meteorological conditions. A harbour authority would have neither the resources nor the legislative power to extract much of this information from an individual vessel that transits through its waters. In this study the analysis utilised an AIS dataset collected and recorded by the PLA's VTS. AIS is a ubiquitous and readily available transponder system whose datasets can provide sufficient information to design a robust and fit-for-purpose domain including; speed, heading, course, draught, length, beam and type. The availability of AIS datasets, as well as the type of data fields they provide is the most suited input to any domain analysis study.
AIS is not legally required on all vessels however, with a significant number of smaller craft effectively ignored in this analysis. In particular, small motorboats, kayaks and rowers are a significant and unrepresented collision hazard, both directly with commercial vessels and indirectly, encounters between commercial vessels taking third party avoidance of unrecorded small craft. The collection of a comparable dataset of small craft positions within a study area would require a dedicated survey team to undertake a traffic survey by radar, entering vessel attributes manually. This is a significant limitation in terms of the cost required to support long durations of monitoring, as well as the tracking accuracy of radar and the completeness of attribute data. Furthermore, within Central London the segmentation of the river with bridges would be a barrier to radar returns and would render this method difficult to administer.
Where AIS data is recorded, the accuracy of this dataset should be assessed, both in terms of completeness and consistency. In this study the fine degree of navigation, analysed at a scale of metres, would amplify the impact minor data errors would have, compared to other studies, using scales in nautical miles. The completeness of the dataset is a measure of quantity of received data. Poor reception quality through missed transmissions or incomplete strings must be assessed to undertake a robust study and, where necessary, be mitigated by incorporation into the study design. To attempt domain analysis beyond the operational range of an AIS receiver or through an area with no reception would interpolate vessels across paths that they may not have taken, distorting the results. This analysis compared the number of received AIS transmissions to the expected number sent, to rate reception quality across the study area. PLA's VTS has full AIS coverage of the study area and the results showed generally high quality reception. However, several local specific issues were noted that warranted attention; namely positional accuracy under bridges and GPS errors alongside HMS Belfast.
The majority of bridges in Central London are of solid construction and can degrade satellite GPS coverage for vessels navigating underneath. This had the effect that major course alterations were experienced and positional jumping led to several false encounters.
A second issue regarded larger vessels that moored alongside HMS Belfast. HMS Belfast is a retired naval warship that is moored on the Thames as a tourist attraction. The hull seemed to cause a GPS position reflection within AIS up to 100 metres to the north. This phenomenon necessitated manual removal of the offending data points (Figure 11).
Issues encountered during study. Reflection of AIS data alongside HMS Belfast (Top) and vessel orientation at slow speeds without heading (Bottom).
A significant limitation of this particular study was the unavailability of vessel heading information for a number of vessels. Thames AIS does not require Class V Passenger Vessels to carry an AIS-linked compass. Course was therefore used as a substitute but this does not accurately orientate a vessel's heading. The difference between heading – the orientated direction of a vessel – and the course – the direction in which the vessel travels – becomes greatest when the vessel is stopped. Any wake from other vessels or slight variation in GPS positioning can cause a perceived change in the orientation of the vessel in multiple directions, possibly resulting in erroneous domain encounters with other vessels (Figure 11). To mitigate this limitation, each berth/pier in the study area was digitised into the GIS, and a buffer of 40 metres applied. All vessels that reached a slow speed threshold of half a knot within this buffer had their course altered to be parallel to the berth. More generally, smaller craft carrying Class B AIS rarely carry the equipment to transmit heading and so this issue should be anticipated in future studies.
AIS data accuracy is paramount to domain construction and any errors in relation to manual data entry can have significant effects on the study results. A number of AIS data fields in Message 5 static data require manual input and these include vessel type, destination, draught and dimensions. Input errors within these fields are well known (Harati-Mokhtari et al., Reference Harati-Mokhtari, Wall, Brooks and Wang2007) and before the analysis was undertaken a stakeholder panel reviewed the details to identify and correct any errors. Domain analysis in particular requires accurate AIS offset positions to generate vessel outlines. Where this information is missing or inaccurate, corroboration with a third party dataset is required.
A further localised issue concerned vessels apparently transiting over bridges. Amphibious craft known as ‘DUKWs’ tour Central London and the River Thames, often with their AIS still active. The methodology was required to distinguish this error and discount contraventions caused by DUKWs transiting over bridges but including those when the DUKW had entered the river.
4.4. Intended Audience
A final conceptual principle that must be considered when designing a domain methodology is that of the intended audience. The analysis undertaken will only be meaningful and have any impact if it can both inform and persuade stakeholder groups. Firstly, this requires the participation of the audience in making the study sensitive to local perceptions of risk, as previously mentioned, and will feed into the design of the domains themselves. Secondly, the approach must be simple to understand and describe. Risk assessments for complex systems necessarily involve the input of a large number of local users and harbour staff with a range of backgrounds and experiences. The more complex the domain design, the more dynamic its shape, the more variables required in its construction, and the less predictable it becomes for the lay user and the more suspicious they may be of the results. Domain designs that require complex mathematical formulae limit the input that a stakeholder can contribute to the study. There is therefore a compelling argument that domain designs should be simple, with few variables, in order that stakeholder “buy-in” to the approach can be achieved. In this study we limited the domain design to only two variables: vessel type and speed.
5. CONCLUSIONS
This paper has demonstrated the value that domain analysis can have in informing strategic marine risk assessments. In particular, this approach provides a powerful tool for locating areas of vessel-to-vessel encounters to identify collision risk and capacity problems. With the increasing availability of AIS datasets and GIS technology, port risk assessments can harness these techniques to better understand navigational risk and target appropriate mitigation measures more effectively.
However, there is considerable scope for the analyst to tailor domain analysis ad hoc to the individual situation and needs of each study. Account needs to be taken of data availability, its quality, the local geography and the local perceptions of risk in the study area before the analysis can be undertaken. However the intended audience should be of paramount concern to the study with serious consideration made of how to best inform and engage with stakeholders. Any analysis technique that is unable to bring together the concerns of regulators, scientists and mariners, and generate meaningful results that can inform the assessment of risk is doomed to failure, and it is at this ideal, that domain analysis should aim.
6. FURTHER RESEARCH
Two questions are left unanswered after the completion of this study. Firstly, to what extent can domain analysis be used as a predictive tool to assess the change in the number of contraventions, given new circumstances? This study has examined only the baseline situation of the current traffic profile on the River Thames; however it should be possible to re-run the analysis with a modified circumstance and compare the change. Agent-based modelling may be able to model future scenarios; however this has had little application in the marine environment and could only be done at great expense. Secondly, what is the exact relationship between the numbers of domain encounters, exposure frequency and the actual historical record of collisions? If domain analysis was undertaken over a longer time period such as a year, and the total number of contraventions compared to the historic collision rate, then a causation factor could be determined. What aggravating circumstances leads domain encounters to become actual collisions? This research would considerably improve the forecasting of collision frequencies for use in the FSA risk assessment approach.