INTRODUCTION
Mountains contain spatially compressed environmental gradients and associated diverse regional faunas and floras, making them natural laboratories for altitudinal studies that can elucidate past, present and future determinants of diversity. Studies investigating the relationship between species richness and altitude have yielded diverse patterns. Prevalent patterns globally include either a decrease in richness with altitude or a mid-elevation peak, i.e. a hump-shaped pattern (McCain Reference MCCAIN2007a, Rahbek Reference RAHBEK1995). The latter has been shown to be ubiquitous in non-volant small mammals (Brown Reference BROWN2001, McCain Reference MCCAIN2005, Rowe Reference ROWE2009). A variety of mechanisms have been proposed to explain hump-shaped patterns, from spatial hypotheses such as the mid-domain effect, MDE (Colwell & Lees Reference COLWELL and LEES2000, Colwell et al. Reference COLWELL, RAHBEK and GOTELLI2004, Jetz & Rahbek Reference JETZ and RAHBEK2001, McCain Reference MCCAIN2004, Reference MCCAIN2005, Reference MCCAIN2007a) to climatic hypotheses (Kryštufek et al. Reference KRYŠTUFEK, DONEV and SKOK2011, McCain Reference MCCAIN2007b, Williams et al. Reference WILLIAMS, SHOO, HENRIOD and PEARSON2010) and historical evolutionary filters (Clausnitzer & Kityo Reference CLAUSNITZER and KITYO2001, Colwell & Rangel Reference COLWELL and RANGEL2010, Heaney et al. Reference HEANEY, HEIDEMAN, RICKART, UTZURRUM and KLOMPEN1989, Williams et al. Reference WILLIAMS, SHOO, HENRIOD and PEARSON2010). Based on 13 rodent studies, Mena & Vázquez-Domínguez (Reference MENA and VÁZQUEZ-DOMÍNGUEZ2005) showed that beta-diversity (species turnover) was also highest at mid-elevations.
At the local scale, factors such as vegetation structure, habitat complexity and disturbance (e.g. successional effects of fire in grassland ecosystems) have been shown to be important determinants of small-mammal community structure changes along altitudinal gradients (Clausnitzer & Kityo Reference CLAUSNITZER and KITYO2001, Curran et al. Reference CURRAN, KOPP, BECK and FAHR2012, Denys et al. Reference DENYS, MISSOUP, TCHIENGUE, ACHOUNDONG, EKOBO, BILONG BILONG, LEMBE and NICOLAS2009, Goodman & Rasolonandrasana Reference GOODMAN and RASOLONANDRASANA2001, Happold & Happold Reference HAPPOLD and HAPPOLD1992, Kok et al. Reference KOK, PARKER and BARKER2012, Kryštufek et al. Reference KRYŠTUFEK, DONEV and SKOK2011, Linden et al. Reference LINDEN, WEIER, GAIGHER, KUIPERS, WETERINGS and TAYLOR2014, Mulungu et al. Reference MULUNGU, MAKUNDI, MASSAWE, MACHANG’U and MBIJE2008, Patterson et al. Reference PATTERSON, STOTZ, SOLARI, FITZPATRICK and PACHECO1998, Rowe-Rowe & Meester Reference ROWE-ROWE and MEESTER1982).
The Soutpansberg Mountains of northern South Africa run from west to east for some 210 km, rising above the flat landscape of the Limpopo Valley and ranging in altitude from approximately 800–900 m asl to the highest peak of 1748 m asl. Although not reaching the maximum altitude (>3000 m) found in the Drakensberg Range to the south, neighbouring mountain ranges of similar altitudinal range are found to the west (Blouberg), south (Waterberg) and north-east (Eastern Highlands of Zimbabwe). Biologically rich, the Soutpansberg represents a southern African centre of plant endemism located just north of the Tropic of Capricorn and having a high diversity of plants (>1000 genera and >3000 species) and animals (Berger et al. Reference BERGER, CRAFFORD, GAIGHER, GAIGHER, HAHN and MACDONALD2003, Foord et al. Reference FOORD, MAFADZA, DIPPENAAR-SCHOEMAN and VAN RENSBURG2008, Hahn Reference HAHN2002, Linden et al. Reference LINDEN, WEIER, GAIGHER, KUIPERS, WETERINGS and TAYLOR2014, Munyai & Foord Reference MUNYAI and FOORD2012, Taylor et al. Reference TAYLOR, SOWLER, SCHOEMAN and MONADJEM2013, Van Wyk & Smith Reference VAN WYK and SMITH2001). Previous altitudinal transects of the western Soutpansberg have revealed a hump-shaped pattern in ant richness on northern slopes contrasting with a peak at lower altitudes on the southern slopes (Munyai & Foord Reference MUNYAI and FOORD2012) as well as a significant decrease with altitude in richness and diversity of bats on the southern slopes (Linden et al. Reference LINDEN, WEIER, GAIGHER, KUIPERS, WETERINGS and TAYLOR2014).
Based on altitudinal patterns of small-mammal diversity found worldwide we hypothesize a hump-shaped pattern of species richness. Given the uniquity of Bergmann's Rule we predicted that body size of species widespread across a range of altitudes would repond positively to altitude (Yom-Tov & Geffen Reference YOM-TOV and GEFFEN2011, Yom-Tov et al. Reference YOM-TOV, YOM-TOV, WRIGHT, THORNE and DU FEU2006, Reference YOM-TOV, ROOS, MORTENSEN, WIIG, YOM-TOV and HEGGBERGET2010). Finally, due to reasonably marked seasonal differences in rainfall, and to a lesser extent temperature, we predicted that season would have a significant effect on abundance, diversity and body size.
METHODS
Study site
The Luvhondo Nature Reserve located in the southern aspect of the western part of the Soutpansberg range, Limpopo Province, has an area of about 5000 ha (Figure 1). During the course of the present study between August 2010 and June 2011 (11 mo), total rainfall of between 587 mm (at 1600 m asl) and 849 mm (at 1200 m asl) (mean of 689 mm) was recorded at different trapping sites, with distinct peaks recorded in January 2011 (mean of 249 mm) and April 2011 (mean of 159 mm). A weather station on the Lajuma Research Centre, within the reserve, recorded temperatures varying between 6.3°C and 36.7°C in the warm wet season and 4.6°C and 30.9°C in the cool dry season. Based on iButtons deployed at each trapping site, mean monthly temperatures for the duration of the study ranged from 15.9°C at 1747 m asl (ranging from −0.4°C to 29.6°C) to 19.4°C at 1000 m asl (ranging from 3.9°C–39.9°C).
Map showing the location of the Luvhondo Private Nature Reserve in Limpopo Province of South Africa (a) and a detailed vegetation map with farm boundaries included, showing the location of the five altitudinal sites (b). Vegetation types (from Mucina & Rutherford Reference MUCINA and RUTHERFORD2006) are indicated as follows: dark grey = Northern Mistbelt Forest; mid-grey = Soutpansberg Mountain Bushveld; light grey = Soutpansberg Summit Sourveld; white = Makhado Sweet Thornveld.

The reserve ranges in altitude from 800 to 1748 m asl and is made up mostly of sandstone and quartzite with small patches of basalt. There are several permanent streams and wetlands located within the nature reserve.
Trapping
Permanent trapping grids were set at five different altitudinal sites, namely 1000 m (23.0503°S, 29.46917°E), 1200 m (23.0493°S, 29.44722° E), 1400 m (23.03438°S, 29.43088º E), 1600 m (23.02258° S, 29.43388° E) and 1747 m asl (23. 25°S, 29.42917° E). Traps were set in Soutpansberg mountain bushveld (1000–1400 m asl) and Soutpansberg summit sourveld (1600–1747 m asl) (Mucina & Rutherford Reference MUCINA and RUTHERFORD2006; Figure 1). The sampling sites were chosen so that they had the same substrate, namely rocky areas. The extent of rock cover increased with increasing altitude. Forty-nine aluminium folding Sherman traps were placed 10 m apart on 7 × 7-fixed grids at each sampling site. Following Massawe et al. (Reference MASSAWE, MULUNGU, MAKUNDI, DLAMINI, EISEB, KIRSTEN, MAHLABA, MALEBANE, VON MALTITZ, MONADJEM, TAYLOR, TUTJAVI and BELMAIN2011), allowing for a 5-m buffer strip around the grid to account for short-term dispersal, our grid plots covered an area of 0.49 ha (rounded to 0.5 ha given imprecision in estimating rodent densities). The Sherman traps were baited with oats mixed with cooking oil and checked early in the morning and late in the afternoon.
Sampling at each of the five sites covered four nights per session and was repeated for four consecutive seasons leading to a total of 80 trapping nights (warm dry season: 29 August–3 October 2010; early warm wet season: 25 November 2010–3 February 2011; late warm wet season: 1 April–1 May 2011; cool dry season: 2–13 June 2011).
A permit to sample small mammals was obtained from the Limpopo Department of Environmental Affairs and Tourism (LEDET), Permit No. 001-CPM403–00010. Capture and handling followed the guidelines prescribed by the American Society of Mammalogists (Sikes, Gannon and the Animal Care and Use Committee Reference SIKES and GANNON2011). Captured individuals were marked by fur-clipping so that they could be recognized when recaptured during subsequent sampling periods. Individuals were weighed using a 100-g Pesola spring balance with 1-g precision. Species were identified in the field by external characteristics using the key of Newbery (Reference NEWBERY1999). Individuals which could not be identified with certainty in the field were euthanized and prepared as voucher specimens (skulls, skins and/or bodies stored in 70% ethanol), and lodged with the Durban Natural Science Museum. Recent literature and Monadjem et al. (in press) was consulted for current nomenclature. Rhabdomys from the Soutpansberg Mountains has been identified as R. dilectus, a species distinct from R. pumilio (Castiglia et al. Reference CASTIGLIA, SOLANO, MAKUNDI, HULSELMANS, VERHEYEN and COLANGELO2012, Du Toit et al. Reference DU TOIT, VAN VUUREN, MATTHEE and MATTHEE2012, Monadjem et al. in press). Dasymys from northern South Africa has been identified as D. robertsii distinct from D. incomtus (Mullin et al. Reference MULLIN, PILLAY and TAYLOR2005). Aethomys chrysophilus was identified from cytochrome-b sequences (C. Chimimba, unpubl. data) based on a single specimen collected during this study from 1600 m. This specimen was one of six Aethomys individuals sequenced from the study area; all other specimens were identified as A. ineptus. The Soutpansberg is clearly a contact zone between these two cryptic species as suggested by distribution maps in Linzey et al. (Reference LINZEY, KESNER, CHIMIMBA and NEWBERY2003). As the two cryptic species cannot be identified in the field and as most Aethomys specimens were released in our study, we could not distinguish the two species and they were treated as one for the purposes of analysis. Based on Taylor et al. (Reference TAYLOR, MAREE, SANDWYK, BAXTER and RAMBAU2009) and Engelbrecht et al. (Reference ENGELBRECHT, TAYLOR, DANIELS and RAMBAU2011) we used the name Otomys auratus for Limpopo populations. We follow Lecompte et al. (Reference LECOMPTE, APLIN, DENYS, CATZEFLIS, CHADES and CHEVRET2008) and Monadjem et al. (in press) in including namaquensis in the genus Micaelamys and not Aethomys.
Habitat and environmental variables
At each of the 49 Sherman traps a 5 × 5-m quadrat was laid. In each quadrat five microhabitat variables (plant height, % leaf litter, % bare soil, % rock cover, % canopy cover) were measured, following Williams et al. (Reference WILLIAMS, MARSH and WINTER2002) and Monadjem (Reference MONADJEM2005).
Shade temperature (mean, minimum and maximum monthly) was measured from August 2010 to June 2011 using Thermocron iButtons/data loggers attached to 1-m poles. Cold chain Thermodynamics software was used to download temperature data from data loggers. Monthly rainfall was recorded at each study site from August 2010 to June 2011 using rain gauges. Additional climatic data, including rainfall and temperature, was obtained from weather stations located at 1200 m and 1747 m asl. These weather stations were placed and monitored by the South African Environmental Observation Network (SAEON).
Data analysis
Small-mammal density was calculated as the minimum number of unique individuals known to be alive (i.e. excluding fur-clipped recaptures) per 7 × 7 trapping grid (approximately 0.5 ha). The statistical software Estimate-S (Version 8.2.0) was used to generate individual-based rarefaction (or species accumulation) curves as well as observed and expected values for small-mammal species richness at each sample session and site. Two richness estimators Chao 2 and Jackknife2 were selected because they are less biased to small samples. Estimate-S (Version 9.1.0, Robert K. Colwell, University of Connecticut, USA) was also used to calculate Simpson's (D) diversity index (Gotelli & Colwell Reference GOTELLI and COLWELL2001, Magurran Reference MAGURRAN2004).
In order to test the mid-domain effect (MDE), the programme RangeModel (Version 5.0, Robert K. Colwell, University of Connecticut, USA) was used to create a null model for a species saturation curve after 50000 simulations of empirical species ranges within the altitudinal bounds of the study (Colwell & Lees Reference COLWELL and LEES2000, McCain Reference MCCAIN2005). Regression of the empirical values onto predicted values for the 50000 simulations allowed a test of the fit of our data to the null model.
Using statistical software R 2.11.1 (R development Core Team, Vienna) (www.r-project.org), seven linear regression models were built in trying to test the influence of different spatial and environmental variables on small-mammal species richness, diversity and abundance for 20 sample sessions. Although count data (such as species richness and abundance) often display non-normal distributions and non-constant error variance, necessitating the use of generalized linear models, we tested for normality and non-constant variance by examining the distribution of residuals as well as using the Shapiro–Wilk normality test and the Breusch–Pagan test for non-constant error variance. In all variables, these tests were not significant (P > 0.05), justifying the use of linear models. The models tested the influence of several predictor variables including spatial effects (the mid-domain effect), altitude, season, vegetation type, climate (rainfall and temperature) and micro-habitat variables (grass cover, grass height, shrub cover, shrub height, tree cover, tree height, litter cover, rock cover). Initial analyses included all microhabitat variables but, due to high numbers of zero values and/or collinearity between variables, singularities resulted in the regression models making it impossible to calculate coefficients. For this reason, and because exploratory analyses showed no association with independent variables, we removed all microhabitat variables except for percentage of rock cover, which did not display statistical problems and which was shown to be an important determinant of species richness. Akaike's information criterion (AIC) was calculated and used to assess the best model that explained the drivers of species richness (both estimated and observed richness), diversity and abundance. The best model was shown by lowest AIC values (Symonds & Moussalli Reference SYMONDS and MOUSSALLI2011). We also computed AICc scores as these are more robust at smaller sample sizes.
Changes in body mass due to season and altitude were analysed using two-way ANOVAs to test for differences in altitude (as a factor variable) and season in four species which occurred in multiple altitudes and seasons (A. ineptus, M. namaquensis, R. dilectus and E. myurus). One-way ANOVA was used to test for significant variation in mass between seasons in A. spinossisimus, which was found only at 1000 m.
RESULTS
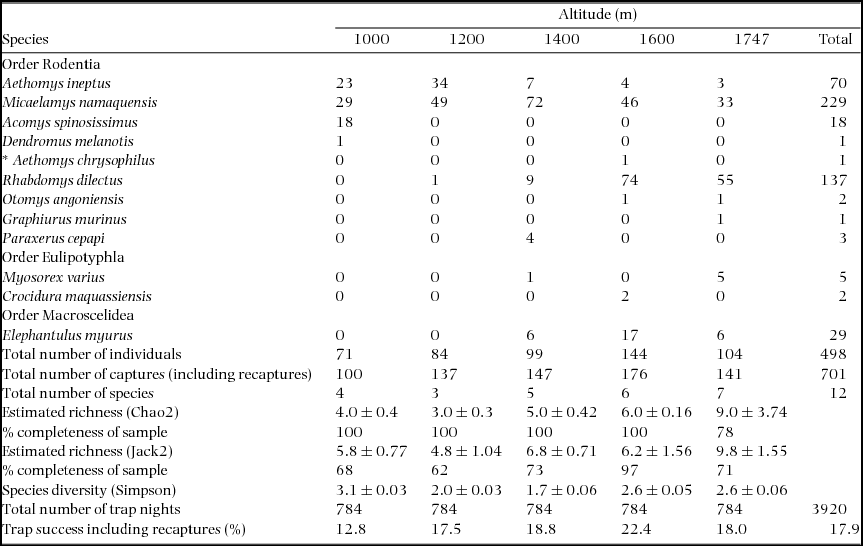
After 3920 trap nights, a total number of 701 captures for 498 unique individuals belonging to nine species of rodent, two shrew species and one elephant shrew species were sampled (Table 1). Overall trap success (including recaptures) was high (18%) and varied from 13% at 1000 m to 22% at 1600 m (Table 1).
Small-mammal species composition from five altitudinal samples in western Soutpansberg (Luvhondo Private Nature Reserve), indicating minimum number of individuals known to be alive (i.e. excluding recaptures) for 12 small-mammal species sampled over four consecutive seasons. Asterisk indicates identification based on DNA sequences only; since this species cannot be distinguished in the field from A. ineptus, records were combined for the purpose of all analyses.
Population responses to altitude and season
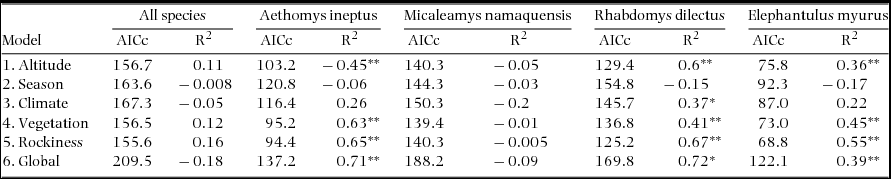
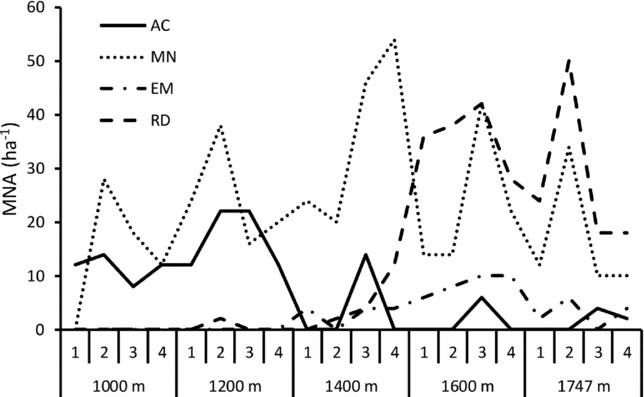
Of the four most widespread species, the three rodents (Micaelamys namaquensis, Aethomys ineptus and Rhabdomys dilectus) showed marked seasonal fluctuations in abundance (density) within altitudinal zones, reaching peaks densities of 50 ha−1 (R. dilectus), 54 ha−1 (M. namaquensis) and 22 ha−1 (A. ineptus), whilst the sengi (E. myurus) showed more stable population numbers and a peak density (at 1600 m) of around 10 ha−1 (Figure 2). Seasonal peaks in small-mammal abundance for the three most widespread rodents (M. namaquensis, A. ineptus and R. dilectus) were different at different altitudes. For example, in M. namaquensis, early warm-wet-season peaks in abundance occurred at the two lowest and the highest altitude whilst late warm-wet-season or cool-dry-season peaks occurred at 1400 m and 1600 m (Figure 2). Abundance of all species combined did not change significantly with altitude, season or any of the other environmental variables (Table 2). However, in the case of A. ineptus, R. dilectus and E. myurus (but not M. namaquensis) abundance (density) was significantly correlated with altitude, leading to a linear decrease (A. ineptus) or increase (R. dilectus, A. myurus) with increasing altitude. The model which best explained this relationship in all three cases (lowest AICc) was the one involving the single variable, percentage rock cover (Table 2).
Comparison of performance of six regression models testing for environmental predictors of abundance (Minimum Number Alive per 0.5 ha) for all small mammals combined and for the four most common species, over five altitudinal sites in the Soutpansberg Mountains, each sampled in all four seasons (n = 20 sample sessions each of four trap-nights). Best models indicated by lowest AICc scores and high adjusted R2 values. Significance of corresponding ANOVA F-values indicated as * (P < 0.05) or ** (P < 0.01). In models 1, 2, 4, and 5 single variables were tested. In model 3, four variables were tested and model 6 all eight variables were tested.
Abundance (Minimum Number Alive: MNA) of most common small mammals at different altitudinal sites over four seasons at Luvhondo Private Reserve in 2010–2011. AC (Aethomys ineptus) MN (Micaelamys namaquensis); EM (Elephantulus myurus); RD (Rhabdomys dilectus). Seasons abbreviated as follows: 1 = warm dry; 2 = early warm wet; 3 = late warm wet; 4 = cool dry.
Community responses to altitude and season
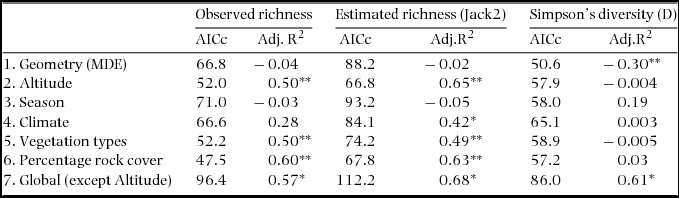
Season had no significant effect on measures of species richness, diversity and abundance (Tables 2 and 3). The small-mammal community comprised 12 species in total including a number of rarely recorded species occurring at only one or two sites, in addition to three rodent species (A. ineptus, M. namaquensis and R. dilectus) and one insectivore (E. myurus) that were abundant and widespread (Table 1). Our study sites occupied two vegetation types from two distinct biomes, with the lower three sites corresponding to Soutpansberg Mountain Bushveld (Savanna Biome) and the upper two corresponding to Soutpansberg Summit Sourveld (Grassland Biome) (Figure 1). As expected, grassland-associated species such as R. dilectus and M. varius were closely associated with the two upper grassland sites (Table 1). We expected to record the grassland-associated O. auratus associated with the grassland site but instead recorded O. angoniensis, a species typically associated with wetlands in savanna associations.
Comparison of performance of seven regression models testing for geometrical (mid-domain effect: MDE) and environmental predictors of observed and expected (Jack2) species richness and Simpson's diversity index (D) over five altitudinal sites, each sampled in all four seasons (n = 20 sample sessions each of four trap-nights). Best models indicated by lowest AICc scores and high adjusted R2 values. Significance of corresponding ANOVA F-values indicated as * (P < 0.05) or ** (P < 0.01). In models 1, 2, 3, 5 and 6 single variables were tested. In model 4, four variables were tested and model 7 eight variables were tested (all other predictor variables except altitude).
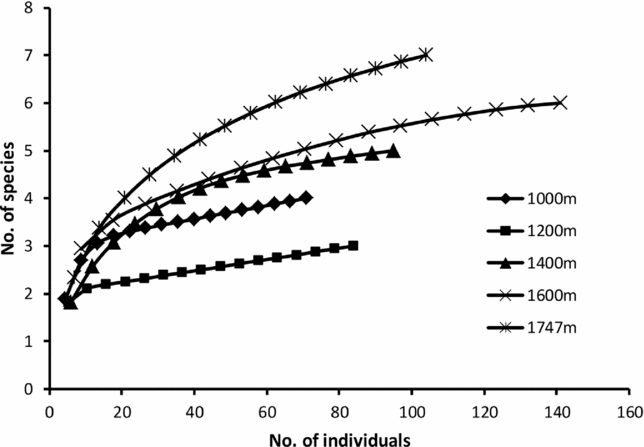
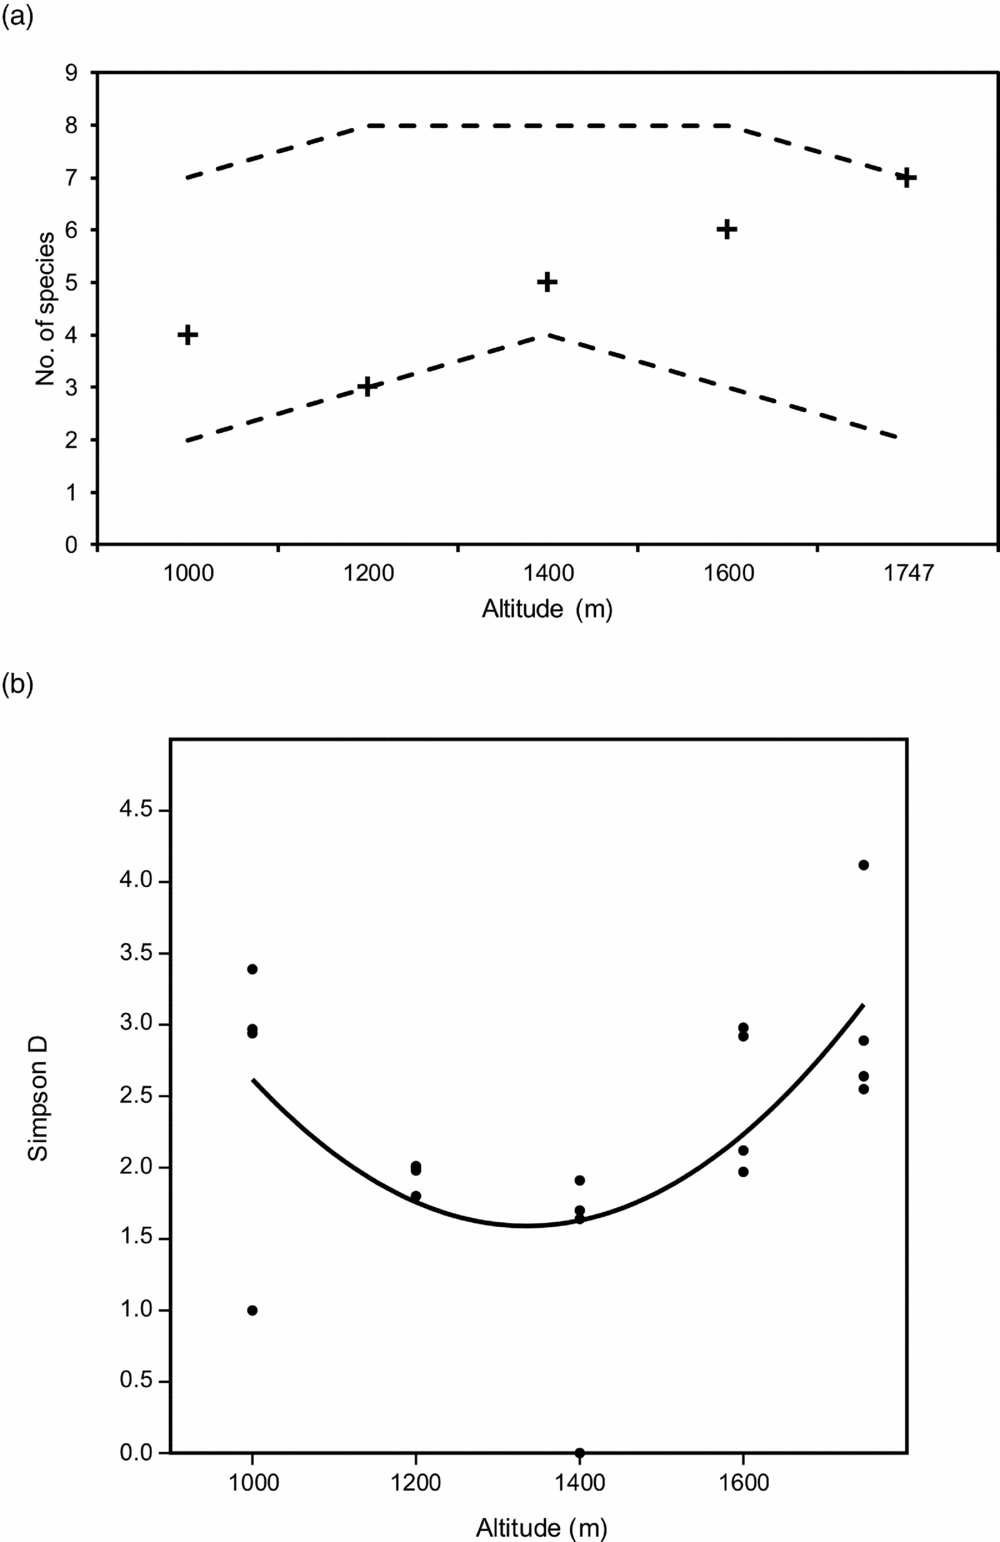
Based on individual-based rarefaction curves and estimated richness using the Chao2 and Jackknife2 estimators (Table 1, Figure 3), small-mammal communities at each altitude were fairly well to completely sampled (62–97% for Jackknife2 and 78–100% for Chao2). We found a significant linear increase in both observed and estimated (Jackknife2) species richness with altitude (Table 3, Figure 4a). Simpson's D instead showed a curvilinear, inverse hump-shaped relationship with altitude, having greatest diversity at both extremes of altitude (Figure 4b: r = 0.41, P < 0.05). The relationship could be explained by the formula
 \begin{eqnarray*}
{\rm D} &=& (9.15 \times 10^{ - 6} \times {\rm Altitude}^2 )\nonumber\\
&& -\, (0.0244 \times {\rm Altitude}) + 17.9.
\end{eqnarray*}
Individual based rarefaction curves of small-mammal species richness for each altitudinal sample for five sites sampled at Luvhondo Private Nature Reserve.
Empirical relationship between altitude and species richness in this study (mean values shown as crosses for each altitudinal site) shown against the predicted species richness based on the Mid-Domain Effect (MDE) estimated from null model with 50000 replications (dashed lines show 95% confidence limits of the model) (a); Polynomial (quadratic) regression describing reverse hump-shaped relationship between Simpson's diversity (D) and altitude. Points represent four seasonal trapping sessions per site (b). The curve shows the best-fit quadratic relationship (r2 = 0.041; P = 0.01) as defined by the equation:
Simpson's D = 0.000009 (altitude2) − 0.0244 (altitude) + 17.9.
The linear increase in observed and estimated (Jackknife2) richness with altitude was best explained (lowest AICc values) by a model comprising just one variable, % rock cover followed closely (slightly higher AICc) by a model involving only vegetation type (Table 3). Observed richness values for each sampled altitude did not follow the hump-shaped pattern predicted by MDE (Table 3: r2 = 0.04, P > 0.05). The only predictor variable which was significantly (inversely) correlated with Simpson's D was MDE (Table 3: r2 = 0.3, P < 0.01). The expected richness values for MDE produced a hump-shaped altitudinal profile, which was the inverse of the pattern for D which showed an inverse hump-shaped relationship with altitude (Figure 4b).
Phenotypic responses to altitude and season
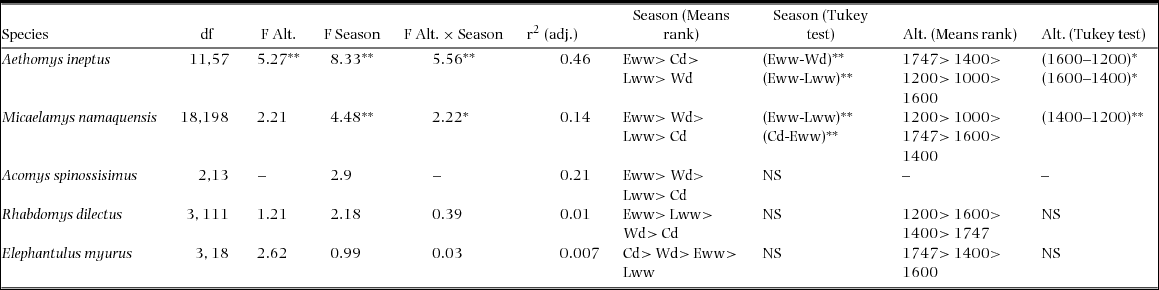
Apart from in the case of A. ineptus, where small sample size (n = 3) of the 1600-m sample appeared to have resulted in bias due to the inclusion of one small probably sub-adult individual, body mass did not vary significantly with altitude (Table 4). On the other hand, in all four rodent species tested, body weight was consistently highest in the early warm wet season and lowest in the late warm dry season or cool dry season; this relationship was significant in the case of A. ineptus and M. namaquensis but not R. dilectus or A. spinossisimus. In the insectivorous E. myurus, largest body size was attained in the cool dry season but there was no significant variation between seasons (Table 4).
Results of two-way analysis of variance (ANOVA) and one-way ANOVA (for Acomys spinossisimus) to test variation in body mass (g) in five small-mammal species due to altitude and season. Significance indicated by * (P < 0.05) and ** (P < 0.01). df = degree of freedom. Abbreviations: Eww = early warm wet season; Wd = warm dry season; Lww = late warm wet season Cd = cool dry season; Alt. = altitude (m); adj. = adjusted.
DISCUSSION
Seasonal variation in abundance, diversity and phenotype
The absence of significant seasonal effects in our study can be attributed to the mild cool season experienced in the study area. However, season had a significant effect on body mass in two rodent species (M. namaquensis and A. ineptus), resulting in reduced body mass during the dry season period of scarcer food availability relative to the wet season, as found also in the pouched mouse (Saccostomus campestris) from northern South Africa (Ellison et al. Reference ELLISON, BRONNER and TAYLOR1993). In the case of the pouched mouse, the cold dry season decline in body size was not due to seasonally varying age profiles but due to decline in mean body mass of the younger age classes due to poor nutrition (Ellison et al. Reference ELLISON, BRONNER and TAYLOR1993). This was probably also true for our study as juveniles were very few in number and occurred in all seasons in those two rodent species that showed significant seasonal differences in mass.
Although it has been shown that relative abundance (trap success) of small mammals is generally highest in the late rainy season or early dry season due to recruitment (Avenant & Cavallini Reference AVENANT and CAVALLINI2007, Avenant et al. Reference AVENANT, WATSON and SCHULZE2008), our data showed that different seasonal peaks in rodent densities occurred at different altitudes, cautioning against generalizations about optimal trapping times.
Altitudinal variation in abundance, diversity and phenotype
Alpha species richness (3–7 species per site) in the current study was comparable with that of other studies conducted at temperate climate sites along the South African Great Escarpment (Kok et al. Reference KOK, PARKER and BARKER2012). However, gamma diversity for the Luvhondo Private Nature Reserve in the western Soutpansberg (Munyai Reference MUNYAI2014, Nemakhavhani Reference NEMAKHAVHANI2014, I. Gaigher pers. comm. and records of the Durban Natural Science Museum; 27 species) was much higher than alpha diversity and comparable with the results of surveys conducted in tropical Afromontane regions such as the Cameroon Mountains (17 species: Denys et al. Reference DENYS, MISSOUP, TCHIENGUE, ACHOUNDONG, EKOBO, BILONG BILONG, LEMBE and NICOLAS2009), Bale Mountains (19 species: Yalden Reference YALDEN1988), Mt Kilimanjaro (20 species: Mulungu et al. Reference MULUNGU, MAKUNDI, MASSAWE, MACHANG’U and MBIJE2008), Mt Elgon National Park (34 species: Clausnitzer & Kityo Reference CLAUSNITZER and KITYO2001), Eastern Arc Range (23 species: Stanley & Hutterer Reference STANLEY and HUTTERER2007) and Mt Andringitra in Madagascar (27 species: Goodman & Rasolonandrasana Reference GOODMAN and RASOLONANDRASANA2001), but much lower than that recorded in the Rwenzori Mountains (67 species). The surprisingly high species richness of terrestrial small mammals in the Soutpansberg Mountains mirrors similar findings from the same region in other plants and animals, including bats (Linden et al. Reference LINDEN, WEIER, GAIGHER, KUIPERS, WETERINGS and TAYLOR2014, Taylor et al. Reference TAYLOR, SOWLER, SCHOEMAN and MONADJEM2013) and is probably at least in part due to high habitat heterogeneity resulting from the presence of grassland, forest and savanna biomes as well as strong east-west and north-south environmental gradients. Annual precipitation varies by almost an order of magnitude from just over 300 mm on northern slopes to >3000 mm at Entabeni on the south-eastern slopes (Berger et al. Reference BERGER, CRAFFORD, GAIGHER, GAIGHER, HAHN and MACDONALD2003).
Our study revealed a significant increase in species richness with altitude, similar to that shown in the Bale Mountains of Ethiopia (Yalden Reference YALDEN1988) and (for rodents but not shrews) in the Udzungwa Mountains of the Eastern Arc Range in Tanzania (Stanley & Hutterer Reference STANLEY and HUTTERER2007). On the other hand, declines in species richness at higher altitudes (usually above the treeline) have been shown in some studies of Afromontane terrestrial small mammals, e.g. in the Cameroon Mountains (Denys et al. Reference DENYS, MISSOUP, TCHIENGUE, ACHOUNDONG, EKOBO, BILONG BILONG, LEMBE and NICOLAS2009), Rwenzori Mountains (Kasangaki et al. Reference KASANGAKI, KITYO and KERBIS2003), Mt Elgon (Clausnitzer & Kityo Reference CLAUSNITZER and KITYO2001) and Mt Kilimanjaro (Mulungu et al. Reference MULUNGU, MAKUNDI, MASSAWE, MACHANG’U and MBIJE2008). No discernible altitudinal changes in richness or diversity were detected in the Zomba Plateau of Malawi (Happold & Happold Reference HAPPOLD and HAPPOLD1992), Drakensberg Mountains (Rowe-Rowe & Meester Reference ROWE-ROWE and MEESTER1982) or Cape Fold Belt Mountains (Bond et al. Reference BOND, FERGUSON and FORSYTH1980) of South Africa. A hump-shaped pattern was found at Andringitra Massif of Madagascar (Goodman & Rasolonandrasana Reference GOODMAN and RASOLONANDRASANA2001). Taken together, these data indicate that contrary to the global trend, hump-shaped altitudinal profiles are rare in Afromontane terrestrial small mammals.
In our study, variation in both abundance and species richness (but not diversity) was best explained by the percentage of rocky cover (rockiness) which increases with altitude. Perhaps because of their complexity and the shelter they provide for both rupicolous and non-rupicolous small mammals, rocky habitats are often found to have greatest abundance and diversity of small mammals (Bond et al. Reference BOND, FERGUSON and FORSYTH1980, Kok et al. Reference KOK, PARKER and BARKER2012, Rowe-Rowe & Meester Reference ROWE-ROWE and MEESTER1982). In addition, vegetation type was an important determinant of observed and estimated richness, whereby grassland biome habitats (Soutpansberg Summit Sourveld) were significantly richer in smaller mammals than savanna biome habitats (Soutpansberg Mountain Bushveld). Paradoxically, in tropical mountain systems montane and alpine grassland habitats are usually lower in small-mammal richness than the montane and tropical forests which occupy their lower slopes (Clausnitzer & Kityo Reference CLAUSNITZER and KITYO2001, Kasangaki et al. Reference KASANGAKI, KITYO and KERBIS2003, Mulungu et al. Reference MULUNGU, MAKUNDI, MASSAWE, MACHANG’U and MBIJE2008). This explains the predominant pattern of decline in richness with altitude in most Afrotropical studies compared with our results.
Species diversity is often assumed to follow the same pattern as species richness but in our study, species diversity followed an inverse hump-shaped pattern since evenness was reduced at mid-elevations due to domination of captures by M. namaquensis.
We expected to find differences in body mass consistent with Bergmann's Rule whereby populations from the highest altitude (lowest temperature) might be expected to be larger-sized than those from lower altitudes having warmer temperatures (Bergmann Reference BERGMANN1847). The absence of a significant correlation between body mass and altitude in our study may be partly due to the relatively small difference in altitude (1200–1747 m asl) associated with a difference of mean monthly temperature of only about 3.5°C (from 15.9°C at 1747 m asl to 19.4°C at 1000 m asl).
Conclusions and future prospects
Studies of altitudinal patterns in Afromontane small mammals seem to indicate a prevalent pattern of declining richness with altitude due to rich tropical and montane forests occurring on lower slopes and less rich grasslands and moorlands above the treeline. In temperate African studies (e.g. along the Great Escarpment of South Africa), grassland or fynbos habitats tend to prevail throughout all altitudes and altitudinal trends are not apparent; local factors such as the effects of fire seem to play an important role. In the Soutpansberg, savanna habitats prevail on the lower slopes whilst productive and complex grasslands (which include fynbos elements) occur at the summit, resulting in a unique pattern of increasing richness with altitude. The tropical location of the Soutpansberg ensures the occurrence of species such as the giant rat (Cricetomys gambianus) which are not found further south, contributing to the relatively higher richness of small mammals from the Soutpansberg compared with studies elsewhere on the Great Escarpment of South Africa.
ACKNOWLEDGEMENTS
The South African National Research Foundation and Department of Science & Technology (through the South African Research Chair on Biodiversity at University of Venda) and the University of Venda are thanked for financial support. Oldrich Van Schalkwyk at Lajuma is thanked for considerable assistance in the field. This work formed part of the MSc thesis of Aubrey Munyai at the University of Venda.