





Introduction
Major depressive disorder (MDD) is a prevalent mental illness characterized by persistent low mood, loss of interest, lack of pleasure, and self-harm or suicidal behavior. Antidepressant medication is the main choice for depression treatment, but more than one-third of patients fail to achieve remission with first-line treatment (Rush et al., Reference Rush, Trivedi, Wisniewski, Nierenberg, Stewart, Warden, Niederehe, Thase, Lavori, Lebowitz, McGrath, Rosenbaum, Sackeim, Kupfer, Luther and Fava2006; Trivedi et al., Reference Trivedi, Fava, Wisniewski, Thase, Quitkin, Warden and Rush2006). Electroconvulsive therapy (ECT) is recognized as an ideal option for fast remission of depression, particularly for patients with severe and treatment-resistant depression (Kraus et al., Reference Kraus, Kadriu, Lanzenberger, Zarate and Kasper2019; Sun et al., Reference Sun, Xu, Sun, Bai, Wang, Wang, Zhang and Tian2024a). However, its exact neurobiological mechanism of ECT for relief of depressive symptoms has not been fully elucidated.
ECT rapidly alters brain neural activity patterns through electrical stimulation, exerting broad effects on synaptic plasticity and neurogenesis processes, thereby effectively alleviating depressive symptoms. Multiple studies consistently report increased gray matter volume (GMV) in the brains of patients with depression following ECT. The hippocampus–amygdala complex is the most consistently reported region (Subramanian, Lopez, Zorumski, & Cristancho, Reference Subramanian, Lopez, Zorumski and Cristancho2022; Sun et al., Reference Sun, Bai, Zhang, Fan, Zhang, Zhang, Hu, Xu, Tian and Wang2024b), with increases in gray matter volume or cortical thickness also observed in the temporal cortex, insula, anterior cingulate cortex, and limbic cerebellum (Depping et al., Reference Depping, Nolte, Hirjak, Palm, Hofer, Stieltjes, Maier-Hein, Sambataro, Wolf and Thomann2017; Gryglewski et al., Reference Gryglewski, Baldinger-Melich, Seiger, Godbersen, Michenthaler, Klöbl, Spurny, Kautzky, Vanicek, Kasper, Frey and Lanzenberger2019; Pirnia et al., Reference Pirnia, Joshi, Leaver, Vasavada, Njau, Woods, Espinoza and Narr2016). In addition, ECT not only enhances dopaminergic, serotonergic, and adrenergic neurotransmission, but also regulates the balance between GABA and glutamatergic systems (Kellner et al., Reference Kellner, Greenberg, Murrough, Bryson, Briggs and Pasculli2012). Following ECT treatment in patients with MDD, the genes most significantly associated with GMV alterations are predominantly enriched in excitatory and inhibitory neurons (Liu, Niu, Liao, & Du, Reference Liu, Niu, Liao and Du2025; Sun et al., Reference Sun, Bai, Zhang, Fan, Zhang, Zhang, Hu, Xu, Tian and Wang2024b). A delicate balance between neuronal excitation (E) and inhibition (I) is essential for neuronal homeostasis and neuronal oscillations supporting the brain’s basic and higher-order cognitive functions (Gao, Peterson, & Voytek, Reference Gao, Peterson and Voytek2017). The dysregulation of the E/I balance has been widely reported in neuropsychiatric disorders, including autism spectrum disorder, schizophrenia, and depression, and is theorized as an important pathophysiological mechanism for mental disorders (Foss-Feig et al., Reference Foss-Feig, Adkinson, Ji, Yang, Srihari, McPartland, Krystal, Murray and Anticevic2017; Gao & Penzes, Reference Gao and Penzes2015). With non-invasive magnetic resonance imaging (fMRI) signals, Trakoshis et al. using the fractional integral process model demonstrate that the Hurst exponent estimated from BOLD signaling could reflect the underlying change in the synaptic E:I ratio (Trakoshis et al., Reference Trakoshis, Martínez-Cañada, Rocchi, Canella, You, Chakrabarti, Ruigrok, Bullmore, Suckling, Markicevic, Zerbi, Baron-Cohen, Gozzi, Lai, Panzeri and Lombardo2020). The Hurst exponent index derived from fMRI provides a new avenue to investigate the E/I patterns in diseases and with treatment. Given the important role of E/I balance in the neuropathology of neuropsychiatric disorders, delineating whether/how ECT re-sculpts the E/I balance and its associated molecular basis could better elucidate the neurobiological mechanisms of ECT for depression.
Genome-wide association studies have confirmed that neuroimaging-derived phenotypes such as GMV, cortical thickness, and functional connectivity (FC) exhibit high heritability (Sun et al., Reference Sun, Shuai, Wang, Yan, Lin, Li and Zhao2025). The Allen Human Brain Atlas (AHBA) and neurotransmitter density maps have provided powerful tools bridging the gap of neuroimaging changes associated transcriptome and neurotransmitters by identifying spatial correlations between gene expression profiles, neurotransmitters density maps and changes of structural or functional measurements (Arnatkeviciute, Fulcher, Bellgrove, & Fornito, Reference Arnatkeviciute, Fulcher, Bellgrove and Fornito2022; Li et al., Reference Li, Qiu, Chen, Chen, Chen, Wang, Sun, Su, Chen, Liu, Chu and Wang2025; Sun et al., Reference Sun, Zhu, Yang, Chen, Li, Shao, Wang, Xie and Wang2026). A large-scale MRI systematic study also revealed that cortical thickness differences between patients with various psychiatric disorders (including MDD) and healthy controls exhibit significant correlations with cell-type-specific gene expression patterns of pyramidal neurons, astrocytes, and microglia (Patel et al., Reference Patel, Parker, Shin, Howard, French, Thomopoulos and Paus2021). Oligodendrocyte gene markers drive cortical myelination by regulating transcriptional networks governing myelin spatial remodeling (Arnatkeviciute, Fulcher, Bellgrove, & Fornito, Reference Arnatkeviciute, Fulcher, Bellgrove and Fornito2022). The spatial heterogeneity of myelination not only correlates closely with the topological structure of FC networks in the cerebral cortex but also determines functional synchrony between brain regions (Hunt et al., Reference Hunt, Tewarie, Mougin, Geades, Jones, Singh, Morris, Gowland and Brookes2016; Huntenburg et al., Reference Huntenburg, Bazin, Goulas, Tardif, Villringer and Margulies2017). By utilizing the AHBA, neurotransmitter density maps, and T1w/T2w ratio maps, it becomes possible to elucidate the molecular mechanisms underlying ECT treatment for MDD across three levels: cell type-specific gene expression, myelin remodeling, and neurotransmitter system regulation.
In this study, we aimed to elucidate the neuromodulatory mechanisms of ECT for MDD from the perspective of E/I balance by integrating fMRI, myelin content mapping, glucose metabolism, neurotransmitter density maps, and transcriptome. With longitudinal resting-state fMRI data from 46 MDD patients and 46 healthy controls, we demonstrated for the first time that ECT can specifically modulate brain E/I balance and functional coupling in patients with MDD to alleviate depression load. In addition, the changes of E/I balance in MDD patients induced by ECT were spatially correlated with the cortical myelination patterns as well as glycolytic metabolic features. Moreover, we identified key neurotransmitters and regulatory genes for ECT-induced functional alterations in MDD patients to reveal its molecular basis.
Materials and methods
Subject
This study included longitudinal resting-state fMRI data from 46 MDD patients (9 males/37 females, age = 39.91 ± 12.25 years) and 46 age- and gender-matched healthy controls (HCs, 11 males/35 females, age = 35.48 ± 11.77 years). We excluded individuals with substance abuse or dependence, major physical diseases, organic neurological disorders, pregnant or lactating women, comorbid psychiatric disorders, and contraindications for MRI scanning. MDD patients maintained their original antidepressant medication regimen during the ECT treatment course to control for potential confounding effects of pharmacological factors on neuroplasticity changes. The standardized 17-item Hamilton Depression Rating Scale (HAMD-17) was administered at baseline (12–24 hours before the first ECT session) and at the end of intervention (24–72 hours after the last ECT session) to quantify depression severity. The study protocol was approved by the Ethics Committee of Anhui Medical University Affiliated Hospital (reference number: 20140072), and all participants provided written informed consent after full disclosure.
The study employed the Thymatron System IV ECT device (Somatics, Lake Bluff, IL, USA) configured at Anhui Mental Health Center, implementing a standardized modified bifrontal stimulation protocol. The treatment course consisted of three sessions per week (Monday, Wednesday, and Friday) with weekend breaks. The anesthesia protocol included intravenous propofol injection, with succinylcholine and atropine administered for muscle relaxation. Seizure activity was monitored via electroencephalography during the procedure. Stimulation intensity was initially set using an age-adjusted percentage method (e.g. 50% for 50-year-old patients) and increased in 5% increments of the maximum charge (~1,000 milli-Coulomb) until seizure induction was achieved. Detailed ECT procedures are described in our previous study (Sun et al., Reference Sun, Xu, Sun, Bai, Wang, Wang, Zhang and Tian2024a; Wang et al., Reference Wang, Wei, Wang, Zhang, Bai, Cheng, Tian and Wang2018a, Reference Wang, Wei, Yuan, Jiang, Xu, Zhou, Tian and Wang2018b).
Resting-state fMRI data acquisition and preprocessing
Resting-state fMRI (rs-fMRI) data were acquired using a 3.0 T GE MRI system (Discovery GE750w). Two scans were completed in the MDD group at baseline (12–24 hours before the first ECT, Pre_ECT) and at the end of the intervention (24–72 hours after the last ECT, Post_ECT), and healthy controls also completed baseline (HC_TP1) and follow-up (HC_TP2) scans to exclude the time effects on brain functions. Subjects were asked to remain awake and eyes closed during the scans. The rs-fMRI data were acquired using a standardized echo planar imaging (EPI) sequence using the following parameters: repetition time (TR)/echo time (TE) = 2400/30 ms, flip angle = 90°, field of view (FOV) = 192 × 192 mm2, matrix size = 64 × 64, voxel size = 3 × 3 × 3 mm3, 46 slices, and 217 volumes.
Preprocessing of rs-fMRI data includes: discarding the first 10 volumes, realignment and normalization to the Montreal Neurological Institute (MNI) template with 3 × 3 × 3 mm3, spatial smoothing with an 8-mm full-width at half-maximum (FWHM) Gaussian kernel, temporal band-pass filtering (0.01–0.1 Hz), regression of Friston-24 head motion parameters, white matter signals, global mean signal, and cerebrospinal fluid (CSF) signals. In addition, to exclude the head motion effects, scrubbing method with cubic spline interpolation was used to eliminate bad volumes with mean frame-wise displacement (FD) > 0.2 mm.
Hurst index (excitation–inhibition balance) analysis
The balance between synaptic excitation and inhibition (E/I ratio) refers to the relative proportion of excitatory and inhibitory synaptic inputs at the neuronal level, a ratio that is critical to the function and stability of neural circuits. It has been shown that changes in the E/I ratio can be captured by the spectral properties of electrophysiological signals, in particular the exponent of the 1/f spectral power (correlated with the Hurst index). This relationship was validated in simulated fMRI signal data and resting-state fMRI data in mice, meaning that an increase in the E/I ratio implies a decrease in the Hurst index (R. Gao, Peterson, & Voytek, Reference Gao, Peterson and Voytek2017; Trakoshis et al., Reference Trakoshis, Martínez-Cañada, Rocchi, Canella, You, Chakrabarti, Ruigrok, Bullmore, Suckling, Markicevic, Zerbi, Baron-Cohen, Gozzi, Lai, Panzeri and Lombardo2020). Thus, changes in synaptic E/I ratio can be indirectly reflected by calculating the Hurst index of resting-state fMRI signals. Based on the code provided by Fotiadis et al. (Reference Fotiadis, Cieslak, He, Caciagli, Ouellet, Satterthwaite, Shinohara and Bassett2023) (https://github.com/pfotiad/SFC_Nature_Comm_2023.git), we performed cortical voxel-wise fractional integration modeling with the preprocessed resting-state fMRI time series in each subject. Subsequently, univariate maximum likelihood estimation and discrete wavelet transform were used to estimate the Hurst index.
After identifying the brain regions where the Hurst exponent was significantly altered in patients with MDD following ECT, we defined these regions as regions of interest (ROIs) and extracted the average time series for each ROI to calculate whole-brain voxel-level functional connectivity using Pearson correlation analysis in each participant.
Statistical analysis for E/I balance and functional connectivity
Using mixed-effects model, we analyzed ECT treatment effects on dependent variables (Hurst index and functional connectivity) with group (MDD vs. HCs), scan time (TP1 vs. TP2), and their interaction as fixed effects. The Gaussian Random Field (GRF) correction method was applied with a significance level set at p < 0.05, where the voxel-level clustering threshold was p < 0.001. Subsequently, the mean signal values (Hurst index and functional connectivity) within regions of interest for each subject group were extracted for post-hoc analysis. Data meeting normality assumptions underwent two-sample t-tests and paired t-tests, while non-normally distributed data employed Mann–Whitney U tests. Normality was assessed using the Kolmogorov–Smirnov–Lilliefors test.
Given that cubic interpolation may artificially introduce temporal smoothness and autocorrelation, we computed the Hurst exponent directly from the preprocessed data (after standard preprocessing pipelines without interpretation or deletion of volumes with FD > 0.2), and included the average FD value for each participant as a covariate in the mixed-effects model to validate the robustness of the results. Moreover, paired t-tests were conducted within the MDD patient group (post-ECT vs. pre-ECT) to identify the ECT effects on Hurst index to determine whether the altered brain regions are consistent with that found in mixed-effects model analysis.
Functional characterization for brain regions showing E/I and FC differences
We conducted a meta-analysis with Neurosynth (Margulies et al., Reference Margulies, Ghosh, Goulas, Falkiewicz, Huntenburg, Langs, Bezgin, Eickhoff, Castellanos, Petrides, Jefferies and Smallwood2016; Preti & Van De Ville, Reference Preti and Van De Ville2019) to assess the 24 cognitive terms associated with the F-maps of the E/I balance and the FC derived from the mixed-effects model analyses. Specifically, we divided the F-maps equally into 12 segments in descending order to generate 12 binary masks as inputs to the meta-analysis. False Discovery Rate (FDR) correction was used to identify significantly related cognitive functions (p < 0.05). Sorting was performed based on a weighted average of z-statistic values (z > 3.1) to visualize the analysis results.
Correlations between changes in E/I balance with myelination and glucose metabolism
To investigate whether the changes in E/I balance induced by ECT were associated with cortical myelination (T1w/T2w) and glucose metabolism, the spatial correlation analyses were conducted. The myelin maps were derived from the HCP500 dataset, calculated as the ratio of T1w to T2w images with standardization for residual transmit field inhomogeneities (Glasser et al., Reference Glasser, Coalson, Robinson, Hacker, Harwell, Yacoub and Van Essen2016). Regional mean glycolytic index (GI) maps were obtained from PET data originally acquired by Vaishnavi et al. (Luppi et al., Reference Luppi, Mediano, Rosas, Holland, Fryer, O’Brien and Stamatakis2022; Vaishnavi et al., Reference Vaishnavi, Vlassenko, Rundle, Snyder, Mintun and Raichle2010). We first generated a difference map (diff-map, Post_ECT – Pre_ECT) by subtracting the whole-brain Hurst exponent of the patient group from that of ECT treatment group. Then, using the Schaefer’s atlas (Schaefer et al., Reference Schaefer, Kong, Gordon, Laumann, Zuo, Holmes, Eickhoff and Yeo2018), we partitioned the Hurst difference map, myelin map, and glycolysis index map into 100 brain regions. Finally, we performed Pearson spatial correlation analysis between the Hurst difference map and both the myelin map and glycolysis index map. Statistical significance was determined using spatial surface-based permutation testing with 5,000 iterations (p < 0.05).
Neurotransmitter receptor/transporter association analysis
To determine the neurotransmitters associated with ECT effects on E/I balance, spatial correlation analysis between the F-map of interaction effects on E/I balance and neurotransmitter density maps was conducted. The neurotransmitter density maps were acquired using positron emission tomography (PET) from over 1,200 healthy individuals. The density maps of receptors or transporters for nine neurotransmitter systems including acetylcholine, glutamate, opioids, gamma-aminobutyric acid (GABA), cannabinoids, serotonin, norepinephrine, dopamine, and histamine, were obtained (Hansen et al., Reference Hansen, Shafiei, Markello, Smart, Cox, Nørgaard, Beliveau, Wu, Gallezot, Aumont, Servaes, Scala, DuBois, Wainstein, Bezgin, Funck, Schmitz, Spreng, Galovic and Misic2022) (https://github.com/hansen_receptors/). Next, we segmented both the F-maps and neurotransmitter receptor maps into 1,000 sub-regions using the Schaefer atlas (Schaefer et al., Reference Schaefer, Kong, Gordon, Laumann, Zuo, Holmes, Eickhoff and Yeo2018). For each neurotransmitter system, we computed weighted averages (by participant number in each cohort) across different receptor/transporter subtypes, followed by voxel-wise averaging within each region and z-score normalization to generate standardized neurotransmitter system maps. We employed multiple linear regression models to assess each neurotransmitter system’s contribution to changes in E/I balance, i.e. F-map of interaction effects (Li et al., Reference Li, Qiu, Chen, Chen, Chen, Wang, Sun, Su, Chen, Liu, Chu and Wang2025). Finally, we performed 1,000 bootstrap iterations to evaluate the relative contribution of each neurotransmitter system (FDR-corrected, p < 0.05).
Transcriptome association analysis
To further determine the genes regulating the changes of E/I balance and FC by ECT, we performed the spatial correlation between transcriptomic profiles and the F-maps of Hurst index and FC. The microarray gene expression data are provided by the AHBA dataset (https://portal.brain-map.org/). The transcriptomic dataset was derived from brain samples of six adult donors, and raw expression data (>20,000 genes from 3,702 spatially distinct brain tissue samples) were preprocessed using a standard pipeline developed by Arnatkeviciute, Fulcher, and Fornito (Reference Arnatkeviciute, Fulcher and Fornito2019), resulting in 10,027 normalized gene expression data. We extracted gene expression data from the left hemisphere to generate a 403 × 10,027 matrix, and used partial least squares (PLS) correlation analysis to determine the relationship between changes in the Hurst index, changes in FC, and gene expression patterns, respectively (Chen et al., Reference Chen, Yang, Li, Chen, Chen, Shao, He, Cai, Zhang, Wang, Luo, Cheng and Wang2024; Li et al., Reference Li, Qiu, Chen, Chen, Chen, Wang, Sun, Su, Chen, Liu, Chu and Wang2025). For PLS analysis, the gene expression matrix was used as a predictor variable, and the statistical F-maps of the Hurst index and FC were set as the response variable. The first component of the PLS analysis (PLS1) was a linear combination of gene expression values reflecting patterns closely associated with the F-values of Hurst index and FC. The statistical significance of the PLS components was verified using the permutation test. The weighting coefficients of each gene in the PLS analysis were evaluated by bootstrapping method. In bootstrapping analysis, the gene weights calculated in each resampling were obtained by resampling the dataset 1,000 times. The standard errors of the weighting coefficients were then estimated from these resampling results. Next, the ratio of the original weighting coefficients to their bootstrap standard errors was used to calculate the z-score of each gene weight. Based on these normalized weighting coefficients, we ranked the genes to obtain a ranked list of genes with significant weighting coefficients (BHFDR-corrected, p < 0.05).
Gene function and cell-type enrichment analysis
We performed a series of enrichment analyses on genes associated with interaction effects. First, Metascape (Zhou et al., Reference Zhou, Zhou, Pache, Chang, Khodabakhshi, Tanaseichuk, Benner and Chanda2019) (https://metascape.org/) was utilized to conduct Gene Ontology (GO) and Kyoto Encyclopedia of Genes and Genomes (KEGG) pathway enrichment analyses, identifying the biological functions of relevant genes, including molecular functions (MFs), biological processes (BPs), cellular components (CCs), and key signaling pathways (Benjamini–Hochberg FDR correction, p < 0.05). Subsequently, STRING v12.0 (https://cn.string-db.org/) was employed to construct a protein–protein interaction (PPI) network with these significant genes, using a high-confidence interaction score threshold of 0.9. Tissue-specific expression patterns were analyzed via the online tool TSEAtools (Dougherty, Schmidt, Nakajima, & Heintz, Reference Dougherty, Schmidt, Nakajima and Heintz2010) (http://doughertytools.wustl.edu/TSEAtool.html) (BHFDR correction, p < 0.01). Finally, cortical layer and cell-type enrichment analyses were performed using the code published by Dear et al. (Reference Dear, Wagstyl, Seidlitz, Markello, Arnatkevičiūtė, Anderson, Bethlehem, Raznahan, Bullmore and Vértes2024). Specifically, we extracted the target gene list and calculated the mean gene weight for specific cortical layers or cell types. A null distribution was generated through 10,000 random permutations, and z-scores were computed by comparing the actual weights with the permuted weights. The resulting p-values were adjusted for multiple comparisons using the Benjamini–Hochberg FDR method (p < 0.05).
Results
Demographic and clinical characteristics
Table 1 summarizes the demographic and clinical characteristics of all participants. When comparing demographic and clinical characteristics between the MDD and HC groups, we employed appropriate statistical tests based on data distribution patterns: two-sample t-tests for normally distributed data, Mann–Whitney U tests for non-normally distributed data, and chi-square tests for categorical variables (e.g. gender). We observed significant group × time interactions on HAMD and HAMA scores (HAMD: F = 171.36, p = 6.09
$ \times $
 10−28; HAMA: F = 110.86, p = 1.67
$ \times $
 10−20), group main effects on HAMD and HAMA scores (HAMD: F = 455.93, p = 3.26
$ \times $
 10−51; HAMA: F = 329.00, p = 1.73
$ \times $
 10−42), and time main effects on HAMD and HAMA scores (HAMD: F = 186.82, p = 1.23
$ \times $
 10−29; HAMA: F = 127.81, p = 9.78
$ \times $
 10−23). For MMSE scores, no significant differences were found for group × time interactions and time main effects (all p-values >0.05), but there was a significant difference in the group main effect (F = 34.25, p = 2.53
$ \times $
 10−8).
Demographic and clinical information

Table 1. Long description
The table contains the following data points:
* Number of subjects: 46 for M D D and 46 for H C.
* Gender (male/female): 9/37 for M D D and 11/35 for H C (p-value 0.460).
* Age (years): 39.91 plus or minus 12.25 for M D D and 35.48 plus or minus 11.77 for H C (p-value 0.084).
* Education level (years): 10.15 plus or minus 4.54 for M D D and 13.64 plus or minus 3.81 for H C (p-value 1.33 times 10 super minus 4).
* H A M D scores: Pre_E C T (23.85 plus or minus 5.98), Post_E C T (6.74 plus or minus 5.57), H C_T P 1 (1.83 plus or minus 1.97), and H C_T P 2 (1.46 plus or minus 2.15) with a p-value of 6.09 times 10 super minus 28.
* H A M A scores: Pre_E C T (22.11 plus or minus 6.96), Post_E C T (6.83 plus or minus 5.72), H C_T P 1 (2.04 plus or minus 2.10), and H C_T P 2 (1.50 plus or minus 2.14) with a p-value of 1.67 times 10 super minus 20.
* M M S E scores: Pre_E C T (28.38 plus or minus 1.89), Post_E C T (28.08 plus or minus 2.03), H C_T P 1 (29.47 plus or minus 1.16), and H C_T P 2 (29.74 plus or minus 0.80) with a p-value of 0.230.
Note: Comparisons of age and years of education were made using the nonparametric Mann–Whitney U test; comparisons of gender were made using the chi-square test; and for HAMD, HAMA, and MMSE scores before and after ECT treatment and for both scans of the HCs group, comparisons were made using a 2 × 2 ANOVA; tests for normal distribution of quantitative data were performed using the Kolmogorov–Smirnov–Lilliefors method.
HAMA, Hamilton Anxiety Scale; HAMD, Hamilton Depression Scale; HCs, healthy controls; MDD, major depressive disorder; MMSE, Brief Mental State Examination Scale.
Effect of ECT treatment on whole-brain Hurst index (E/I balance) in patients with MDD
Analyses of whole-brain Hurst index revealed a significant group × time interaction (F = 17.36, p ≈ 0), group main effect (F = 7.57, p = 0.0065), and time main effect (F = 0.93, p = 0.337) in the right middle cingulate cortex (MCC) (Figure 1a and see Supplementary Figure S1 for the threshold-free F-map). Post hoc analyses showed that the Hurst index was significantly reduced (E/I balance increased) in MDD patients after ECT treatment, whereas no significant difference was observed between scans in HCs (Figure 1c). To further validate the results, we conducted the same analysis with preprocessed fMRI data without motion scrubbing but adding FD as a covariate. We still found that MCC showed significant change of Hurst index after multiple comparison correction (Supplementary Figure S2). Paired t-test within the patient group before and after ECT revealed that ECT significantly reduced the Hurst index in bilateral MCC and right superior frontal gyrus (Supplementary Figure S3), which suggests that detectable changes in neural activity occurred in these brain regions following ECT treatment. We performed a meta-analysis with the whole-brain F-map using the Neurosynth database; we found that the changes of Hurst index were primarily associated with cognitive control, pain, inhibition, and reward-based decision making (Figure 1e).
Effects of ECT treatment on whole brain Hurst index (E/I ratio) and MCC functional connectivity in patients with MDD. (a) Brain regions with significant interactions in Hurst index after ECT treatment. (b) Brain regions with significant interaction for FC of MCC after ECT treatment. (c) Post hoc comparative analysis targeting the middle cingulate cortex (MCC). (d) Post hoc comparative analysis targeting the posterior cingulate cortex (PCC). (e) NeuroSynth meta-analysis was performed on whole-brain F-values derived from the mixed-effects model (H) using 24 topic terms. These terms were ranked according to their weighted average along the F-value gradient. Sensory processing-related terms such as verbal semantics, language, and motor predominantly clustered at the top of the ranking, while cognitive function-related terms including cognitive control, reading, and inhibition were primarily distributed at the bottom. The brain maps below illustrate the spatial distribution of F-values across the whole brain. (f) NeuroSynth meta-analysis of whole-brain F-value changes along intervals derived from the mixed-effects model (FC) using 24 thematic terms. These terms were ranked along the weighted mean of the F-value intervals. Terms related to cognitive functions such as autobiographical memory, declarative memory, and inhibition, or to sensory processing such as language, verbal semantics, and pain appear at the bottom of the ranking. The brain map below shows the whole-brain distribution of the F-values.

Figure 1. Long description
Panel A shows two medial views of the brain with heatmaps indicating F-values for E I balance, highlighting the M C C. A color scale ranges from dark red at 13.0 to yellow at 17.0. Panel B shows similar brain maps for F C, highlighting the M C C and P C C with a color scale from 13.0 to 14.5. Panel C is a violin plot of Mean Hurst Exponent across four groups: Pre E C T, Post E C T, H C T P 1, and H C T P 2. The Post E C T group shows a significant decrease compared to Pre E C T and H C T P 2. Panel D is a violin plot of Mean F C showing a significant decrease in the Post E C T group compared to Pre E C T and H C T P 2. Panels E and F are heatmaps correlating 24 topic terms with F-value gradients from Min to Max. In panel E, terms like verbal semantics and language are at the top, while inhibition and pain are at the bottom. In panel F, motor and cognitive control are at the top, while inhibition and pain are at the bottom. A z-stat color bar on the right ranges from 3.1 in light gray to 12 in black.
Next, we performed seed-based whole brain FC with MCC as seed region to reveal the effects of ECT on functional couplings of MCC. Mixed-effects modeling analysis revealed a significant group × time interaction (F = 9.36, p = 0.0026), group main effect (F = 24.31, p ≈ 0), and time main effect (F = 0, p = 0.9625) for FC between MCC and the posterior cingulate cortex (PCC) (Figure 1b). Post hoc analysis showed that FC between the MCC and PCC was significantly reduced in MDD patients after ECT whereas no significant differences were observed between scans in healthy controls (Figure 1d). A meta-analysis based on the Neurosynth database revealed that the changes of FC were mainly related to autobiographical memory, declarative memory, verbal semantics, and pain (Figure 1f).
Association of changes in the Hurst index with cortical myelination, glucose metabolism, and neurotransmitter systems after ECT
Pearson spatial correlation analyses between the diff-map of Hurst index and the myelination map and the glycolysis index map were conducted. We found that the changes of whole Hurst index before and after ECT showed a significant positive correlation with cortical myelination; that is, the lower the Hurst index after treatment (the higher the E/I ratio), the lower the degree of cortical myelination. (Figure 2a). At the same time, the changes of Hurst index before and after ECT treatment were significantly negatively correlated with the glycolysis index; that is, the lower the Hurst exponent after treatment (the higher the E/I ratio), the higher the brain glucose metabolism rate (Figure 2b).
Spatial correlation of Hurst difference with cortical myelin content, glucose metabolic rate, and neurotransmitter systems. (a) Hurst difference after ECT treatment in MDD patients showed significant positive correlation with cortical myelin content (T1w/T2w). (b) Hurst difference after ECT in patients with MDD showed a significant negative correlation with glucose metabolic rate (glycolytic index). (c) Relative contribution of each neurotransmitter system. Error bars indicate standard deviation (STD), FDR-corrected (p < 0.05).

Figure 2. Long description
The figure consists of three panels labeled A, B, and C.
Panel A: A scatter plot with red data points. The x-axis is labeled diff_Hurst (Post_E C T minus Pre_E C T) ranging from negative 0.04 to 0.02. The y-axis is T 1 w / T 2 w ratio ranging from negative 3 to 3. A dashed black line shows a positive linear correlation with r = 0.386 and p sub spin = 0.041. Brain surface maps are positioned to the left and bottom of the plot. A small histogram in the top right corner shows a distribution with a red bar on the far right.
Panel B: A scatter plot with blue data points. The x-axis is identical to Panel A. The y-axis is Glycolytic index ranging from negative 3 to 3. A dashed black line shows a negative linear correlation with r = negative 0.573 and p sub spin = 0.006. Brain surface maps are positioned to the left and bottom. A small histogram in the top right corner shows a distribution with a red bar on the far left.
Panel C: A bar chart titled Relative contribution (%). The x-axis lists nine neurotransmitter systems, each accompanied by a small brain map. From left to right, the bars represent:
* Acetylcholine: approximately 10%
* Cannabinoid: approximately 10%
* Dopamine: approximately 28% (marked with an asterisk)
* G A B A: approximately 10%
* Glutamate: approximately 10%
* Histamine: approximately 20% (marked with an asterisk)
* Norepinephrine: near 0%
* Opioid: approximately 10%
* Serotonin: near 0%
Error bars indicate S T D. Asterisks denote F D R-corrected p < 0.05.
To further determine the associated neurotransmitter for ECT effects on Hurst index, we analyzed the relationship between the nine neurotransmitter systems and the mixed-effects model F-map using multiple linear regression models. The results showed that dopamine and histamine systems contributed significantly to the changes in Hurst index modulated by ECT treatment (Dopamine: weight = −0.337, p = 0.003; Histamine: weight = 0.248, p ≈ 0) (Figure 2c).
Molecular mechanisms underlying changes in the Hurst index and functional connectivity by ECT
Through neuroimaging-transcriptomic spatial correlation analysis, we identified a set of candidate gene expression profiles that may be involved in ECT-induced changes in the Hurst index and functional connectivity in the MCC region. The results showed that the identified gene sets associated with Hurst index and FC were specifically expressed in the brain (Figure 3a), and the spatial distribution was significantly and positively correlated with the changes in the Hurst index and changes of FC of the MCC (Figures 4a and 5a). Further analysis of the enrichment of specific cortical layer marker genes and cell types revealed genes involved in ECT-regulated Hurst index were significantly enriched primarily in excitatory neurons, astrocytes, microglia, oligodendrocytes, oligodendrocyte precursor cells, and neurons of cortical layers 1, 2, 4, and 5 (L1, L2, L4, and L5) (Figure 4b). Genes associated with FC regulation were predominantly enriched in astrocytes, oligodendrocytes, and neurons of cortical layers 1, 2, 4, 5, and 6 (L1, L2, L4, L5, and L6) marker genes (Figure 5b).
Tissue-specific expression of PLS genes and functional enrichment of overlapping genes. (a) Tissue-specific expression of PLS genes. (b) Functional enrichment of 225 overlapping genes. The left side of the Wayne diagram shows 1,453 significantly related genes that regulate E/I homeostasis, and the right side shows 1,771 significantly related genes that regulate MCC functional connectivity.

Figure 3. Long description
Panel A is a radar chart titled T S E A results. The radial axis represents values from 0 at the center to 0.2 at the perimeter. Two data series are plotted. F C in orange and hurst in blue. Both series show a significant peak at the Brain tissue label at the 12 o’clock position. Other tissue labels arranged clockwise include Pituitary, Testis, Muscle, Heart, Adrenal Gland, Skin, Ovary, Pancreas, Blood Vessel, Thyroid, Liver, Nerve, Adipose Tissue, Blood, Colon, Kidney, Fallopian Tube, Lung, Uterus, Stomach, Esophagus, Vagina, Breast, and Prostate.
Panel B contains a Venn diagram at the top with two overlapping circles. The left blue circle contains 1453, the overlap contains 225, and the right pink circle contains 1771. Below this is a horizontal bar chart titled Gene Enrichment. The x-axis is labeled minus log 10 P and ranges from 0 to 8. The y-axis lists categories grouped by color.
* B P categories in light red include head development, brain development, hindbrain development, cellular response to dopamine, and regulation of neuron projection development.
* C C categories in grey include transport vesicle, recycling endosome membrane, eukaryotic 48 S preinitiation complex, organelle inner membrane, and translation preinitiation complex.
* M F categories in teal include transcription coregulator activity, chloride channel activity, ribonucleoside triphosphate phosphatase activity, antiporter activity, and enzyme activator activity.
* K E G G categories in dark blue include Protein processing in endoplasmic reticulum, Ras signaling pathway, Pathways in cancer, M A P K signaling pathway, and Alzheimer disease.
The bars for B P head development and C C transport vesicle show the highest enrichment values near 6.
Partial least squares (PLS) and functional enrichment analysis of genes regulating changes in Hurst index. (a) Spatial distribution of PLS1 scores in the left hemisphere and their spatial correlation with the mixed-effects model F-statistic plot. (b) Enrichment of the PLS1 gene set in cortical layers and cell types (BHFDR, p < 0.05). (c) GO and KEGG functional enrichment of the PLS1 gene set (BHFDR, p < 0.05). (d) PPI network of the PLS1 gene set and the top 10 hub genes in terms of node degree.

Figure 4. Long description
Panel A shows two views of a left brain hemisphere with a color gradient from blue (negative 0.5) to red (positive 0.5) representing P L S 1 scores. To the right is a scatter plot with P L S 1 score on the x-axis and Mean F value on the y-axis, showing a positive linear correlation (r equals 0.30, p equals 1.09 times 10 super minus 9).
Panel B contains two horizontal bar charts for enrichment z-scores. The left chart shows cortical layers L 1 through L 6 and White Matter (W M). L 1 and W M show positive enrichment, while L 2, L 4, and L 5 show negative enrichment. The right chart shows cell types: Syn, N-Ex, N-In, Astro, Micro, Endo, Oligo, and O P C. Astro, Oligo, and O P C show the highest positive enrichment.
Panel C is a horizontal bar chart of Gene Enrichment showing minus log 10 P values. Categories include Biological Process (B P) like head and brain development; Cellular Component (C C) like lytic vacuole and synapse; Molecular Function (M F) like transcription coregulator activity; and K E G G pathways like Parkinson disease and Alzheimer disease.
Panel D features a Protein-Protein Interaction (P P I) network with nodes of varying sizes and colors (orange, yellow, blue) connected by lines. A table to the right lists the Top 10 hub genes by node degree: S N R P B (17), M R P L 13 (15), P R K A C A (15), C A L M 3 (14), E F T U D 2 (14), P O L R 2 B (14), S N R P A 1 (13), G R B 2 (12), M R P L 36 (12), and P P P 2 R 1 A (12).
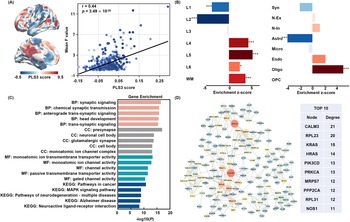
Partial least squares (PLS) and functional enrichment analysis of genes regulating changes in MCC functional connectivity. (a) Spatial distribution of PLS3 scores in the left hemisphere and their spatial correlation with the mixed-effects model F-statistic plot. (b) Enrichment of the PLS3 gene set in cortical layers and cell types (BHFDR, p < 0.05). (c) GO and KEGG functional enrichment of the PLS3 gene set (BHFDR, p < 0.05). (d) PPI network of the PLS3 gene set and the top 10 hub genes in terms of node degree.

Figure 5. Long description
Panel A shows two lateral and medial views of a left brain hemisphere with a heat map of P L S 3 scores ranging from negative 0.5 (blue) to 0.5 (red). Beside it is a scatter plot with a positive linear regression line showing the correlation between P L S 3 score on the x-axis and Mean F value on the y-axis, with r = 0.44 and p = 3.49 times 10 to the power of negative 20.
Panel B contains two horizontal bar charts showing Enrichment z-scores. The left chart for cortical layers shows negative enrichment in L 1 and L 2, and positive enrichment in L 4, L 5, L 6, and W M. The right chart for cell types shows negative enrichment in Astro and positive enrichment in Oligo.
Panel C is a horizontal bar chart titled Gene Enrichment showing negative log 10 P values for various categories. Top categories include B P: synaptic signaling, C C: presynapse, M F: monoatomic ion channel activity, and K E G G: Pathways in cancer.
Panel D features a circular protein-protein interaction network with nodes of varying sizes and colors. A table to the right lists the Top 10 hub genes by node degree: C A L M 3 (21), R P L 2 3 (20), K R A S (15), H R A S (14), P I K 3 C D (13), P R K C A (13), M R P S 7 (12), P P P 2 C A (12), R P L 3 1 (12), and N O S 1 (11).
Functional enrichment analysis and protein–protein interaction (PPI) network construction were performed on the two significantly correlated gene sets. These genes were found to be primarily involved in pathways including head and brain development, regulation of neuronal projection development, synaptic signaling, the MAPK signaling pathway, glutamatergic synapses, ATP-dependent activity, kinase-binding activity, and neurodegenerative diseases such as Parkinson’s disease and Alzheimer’s disease. Notably, overlapping genes between the two PLS gene sets were specifically enriched in the dopaminergic neuron signaling response pathway (Figure 3b). Specifically, genes regulated by ECT in Hurst index primarily involve pathways related to head and brain development, regulation of neuron projection development, presynapse, cell body, transport vesicle, transcription coregulator activity, enzyme activator activity, ATP-dependent activity, axon guidance, and neurodegenerative diseases (Figure 4c). Among the top 10 hub genes ranked by nodal degree, PRKACA and CALM3 participate in cAMP signaling and calcium ion signaling regulation, respectively. PPP2R1A, a regulatory subunit of protein phosphatase 2 (PP2A), is involved in cell cycle and signal transduction regulation (Figure 4d).
Genes associated with ECT-regulated MCC functional connectivity were predominantly enriched in pathways including head development, synaptic signaling, chemical synaptic transmission, presynapse, neuronal cell body, glutamatergic synapse, channel activity, MAPK signaling pathway, neuroactive ligand-receptor interaction, and neurodegenerative diseases (Figure 5c). Among the hub genes, KRAS and HRAS are small GTPases of the RAS family, playing crucial roles in the MAPK signaling pathway; PIK3CD and PRKCA participate in the PI3K-AKT and PKC signaling pathways, respectively, regulating cell growth and neuronal plasticity; NOS1 is involved in nitric oxide (NO) synthesis, influencing neurotransmission and synaptic plasticity; PPP2CA also serves as the catalytic subunit of protein phosphatase 2A (PP2A) (Figure 5d). CALM3 is the sole overlapping gene between the two sets of hub genes.
Discussion
This study reveals how ECT modulates the Hurst index (E/I balance) and its molecular basis in MDD patients. We found that ECT reduced the Hurst index (indicating enhanced E/I balance) in the middle cingulate cortex (MCC) while reducing functional connectivity between the MCC and posterior cingulate cortex (PCC). Further analysis indicates that alterations in Hurst index are closely associated with cortical myelin content, glucose metabolism, dopamine and histamine levels. Moreover, alterations in Hurst index and FC may be regulated by gene expression levels of CALM3, NOS1, PRKACA, PPP2R1A, and others, particularly through their expression in excitatory neurons, astrocytes, microglia, oligodendrocytes, and their precursors. These genes also participate in multiple key biological pathways, including head and brain development, regulation of neuron projection development, glutamatergic synapse, neuroactive ligand–receptor interaction, cellular response to dopamine, and neurodegenerative diseases.
Within the central nervous system, the E/I balance is primarily maintained by the excitatory neurotransmitter glutamate and the inhibitory neurotransmitter GABA, both of which play crucial roles in brain function. Recent studies have shown that the Hurst index in neural time-series data closely reflects the underlying changes in synaptic E/I ratios (Trakoshis et al., Reference Trakoshis, Martínez-Cañada, Rocchi, Canella, You, Chakrabarti, Ruigrok, Bullmore, Suckling, Markicevic, Zerbi, Baron-Cohen, Gozzi, Lai, Panzeri and Lombardo2020). We found that following ECT treatment, the Hurst index in the cingulate cortex (particularly the anterior middle cingulate cortex, aMCC) of patients with MDD significantly decreased, and this change was spatially correlated with a lower myelination index. The view that ECT enhances the E/I balance in the cortex has been supported by the study by Stuiver et al. (Stuiver et al., (Reference Stuiver, Pottkämper, Verdijk, Ten Doesschate, Aalbregt, van Putten and van Waarde2024); Stuiver et al., (Reference Stuiver, Tewarie, Pottkämper, Verdijk, van Putten, Hofmeijer and van Waarde2026)). As a structural and functional hub for brain communication, the aMCC synchronizes and integrates information from multiple isolated systems, coordinating interactions across networks to drive goal-directed behavior. This makes it central to cognitive control, negative affect, and pain processing (Tolomeo et al., Reference Tolomeo, Christmas, Jentzsch, Johnston, Sprengelmeyer, Matthews and Douglas Steele2016). The aMCC is also densely innervated by dopaminergic, noradrenergic, and serotonergic terminals, highlighting its critical role in motivational functions (Touroutoglou, Andreano, Dickerson, & Barrett, Reference Touroutoglou, Andreano, Dickerson and Barrett2020; Vogt, Reference Vogt2016). Multiple studies demonstrate aMCC dysfunction in depression, closely associated with impaired motivation and abnormal reward evaluation (Lavretsky et al., Reference Lavretsky, Ballmaier, Pham, Toga and Kumar2007; Rupprechter et al., Reference Rupprechter, Stankevicius, Huys, Series and Steele2021; Touroutoglou, Andreano, Dickerson, & Barrett, Reference Touroutoglou, Andreano, Dickerson and Barrett2020). Research by Fotiadis et al. further indicates that myelination and E/I balance jointly influence structural-functional coupling in the cerebral cortex. Areas with high myelination typically exhibit stronger structural-functional coupling, and this effect is more pronounced in regions with low E/I balance (Fotiadis et al., Reference Fotiadis, Cieslak, He, Caciagli, Ouellet, Satterthwaite, Shinohara and Bassett2023). Based on these findings, we hypothesize that ECT may partially reverse the ‘high myelination-low E/I-strong structure–function coupling’ patterns observed in depression. This reversal process may constitute a compensatory mechanism for restoring functional flexibility in the MCC to improve the motivation lack and anhedonia in MDD. It should be emphasized that the above interpretation of the E/I mechanism remains an exploratory hypothesis; the quantitative relationship between the Hurst index and neurotransmitter dynamics requires further validation through future studies incorporating multimodal measurement techniques such as magnetic resonance spectroscopy and PET tracing.
To elucidate how elevated Hurst index in the middle cingulate cortex affects other brain regions in MDD patients following ECT, we performed FC analysis using the MCC as the seed point. Significant reduction in FC between the MCC and PCC was observed. As a core region of the default mode network, the PCC is closely associated with memory regulation and also involved in decision-making and cognition (Foster et al., Reference Foster, Koslov, Aponik-Gremillion, Monko, Hayden and Heilbronner2023). Previous studies have demonstrated pathological ‘hyper-connectivity’ of the PCC with the left middle temporal gyrus and right middle frontal gyrus in MDD patients (Zhu et al., Reference Zhu, Wang, Lau, Wei, Liu, Huang and Zhang2022). The hyper-connectivity within the default mode network (DMN) is closely associated with rumination and negative self-referential processing in MDD patients (Kaiser, Andrews-Hanna, Wager, & Pizzagalli, Reference Kaiser, Andrews-Hanna, Wager and Pizzagalli2015). The attenuation of MCC-PCC connectivity suggests that ECT therapy may attenuate the functional activity of the DMN by modulating the Hurst index in the MCC.
The modulatory effect of ECT on the functional coupling between the Hurst index and MCC may be closely related to the spatial distribution of dopamine, histamine, and the expression profiles of related genes. These genes are significantly enriched in excitatory neurons, astrocytes, microglia, oligodendrocytes, and their precursors (OPCs). Histamine can alleviate neuroinflammation by modulating phenotypic changes in microglia and astrocytes and the release of inflammatory mediators (Zhou et al., Reference Zhou, An, Zhang, Li, Zhang and Yan2024). Neuroinflammation is considered to be a key factor in the pathogenesis of anxiety disorders, depression, and various central nervous system diseases, with astrocytes and microglia jointly mediating inflammatory responses. It has been reported that astrocytes can regulate the excitatory/inhibitory balance through the glutamate transporter GLT1 and the gamma-aminobutyric acid transporter GAT-3 (Wei et al., Reference Wei, Guo, Qiu, Ye, Shao, Liang and Du2024). As resident immune cells of the central nervous system, microglia promote the proliferation, differentiation, and myelin formation of OPCs by secreting signaling molecules. Giera et al. discovered that the adhesion G protein-coupled receptor on OPCs interacts with transglutaminase-2 secreted by microglia, promoting OPC proliferation in the presence of the extracellular matrix protein laminin (Giera et al., Reference Giera, Luo, Ying, Ackerman, Jeong, Stoveken, Folts, Welsh, Tall, Stevens, Monk and Piao2018). Oligodendrocytes develop from OPCs. During development, OPCs are targeted and migrate toward their axon targets, subsequently differentiating into mature oligodendrocytes that form myelin sheaths. Reduced myelin levels may promote rapid neuronal discharge activity, enhancing the network’s scale-free or critical properties, thereby increasing neural plasticity (Fotiadis et al., Reference Fotiadis, Cieslak, He, Caciagli, Ouellet, Satterthwaite, Shinohara and Bassett2023). Astrocytes promote the proliferation of OPCs and inhibit their differentiation by secreting growth factors. They provide essential lipids during early myelin formation (Camargo et al., Reference Camargo, Goudriaan, van Deijk, Otte, Brouwers, Lodder, Gutmann, Nave, Dijkhuizen, Mansvelder, Chrast, Smit, Verheijen and Verheijen2017; Lundgaard et al., Reference Lundgaard, Osório, Kress, Sanggaard and Nedergaard2014). Astrocytes also serve as the primary metabolic cells for glutamate, regulating glutamate transport homeostasis (Lundgaard et al., Reference Lundgaard, Osório, Kress, Sanggaard and Nedergaard2014). In summary, ECT may mediate dynamic changes in axonal myelination and reshape protrusion plasticity by regulating the proliferation and differentiation of astrocytes, microglia, and oligodendrocytes.
Gene enrichment analysis further revealed multidimensional regulatory mechanisms by which ECT improves neural function in MDD patients, involving neurodevelopment, energy metabolism, signaling pathways, synaptic function, and neuropathology. For instance, the hub gene NOS1 influences neurogenesis and synaptic plasticity by regulating nitric oxide synthesis (Zhou et al., Reference Zhou, Hu, Hua, Hu, Luo, Han, Zhu, Wang, Xu and Zhu2007); PRKACA, PPP2R1A, and PPP2CA participate in the cAMP-PKA signaling pathway. In the brain of depression patients, modulators of this pathway may alleviate depressive symptoms by enhancing synaptic plasticity and neurogenesis (Gao, Yang, Wang, & Zhu, Reference Gao, Yang, Wang and Zhu2022; Leslie & Nairn, Reference Leslie and Nairn2019); genes such as PIK3CD, KRAS, and HRAS are implicated in PI3K/Akt and MAPK signaling pathways, which are critical for myelination, synaptic plasticity, and learning/memory capabilities (Liu et al., Reference Liu, Zhang, Zhang, Liu, Chu, Zhang and Zhu2017; Papale et al., Reference Papale, d’Isa, Menna, Cerovic, Solari, Hardingham and Brambilla2017; Stornetta & Zhu, Reference Stornetta and Zhu2011). CALM3, as a calmodulin, regulates multiple cellular responses by transmitting Ca2+ concentration signals and has been identified as a pivotal gene in Alzheimer’s disease research (Xie et al., Reference Xie, Situ, Deng, Liang, Ding, Guo, Xu, Liang and Shao2025).
However, several limitations of this study should be acknowledged. First, the AHBA transcriptomic data were derived from only six donors (one female and five males), with four donors providing left hemisphere samples only, which may introduce analytical bias. Second, when interpreting the interaction effects, there were no significant differences in baseline levels between patients with MDD and healthy controls, and changes in brain region indices in patients following treatment did not converge toward control levels. Therefore, there is insufficient evidence to directly attribute the aforementioned changes to the specific therapeutic effects of ECT, nor can the influence of time-related nonspecific fluctuations or natural progression be completely ruled out. Future studies could include a sham-stimulation control group to more effectively distinguish treatment-specific effects from nonspecific time-related effects. Third, this study’s analysis of spatial correlations in myelin, metabolism, neurotransmitters, and the transcriptome – conducted using independent, publicly available datasets – aims to provide exploratory insights into the potential biological basis of ECT-related changes in specific brain regions. Such analyses reflect statistical correlations at the spatial level rather than direct evidence of biologically observable changes within the same cohort of participants. Finally, the Hurst index serves only as an approximate proxy for the E/I ratio; the quantitative relationship between the two has not yet been directly validated. Future research could further integrate multimodal metabolic imaging (such as PET or MRS) and pathological data to provide a more comprehensive biological assessment. Furthermore, although the main findings of this study remained robust after incorporating the individual-averaged FD as a covariate into the statistical model, caution is still warranted when interpreting the results due to the Hurst index’s inherent sensitivity to preprocessing procedures.
Conclusion
This study used resting-state functional MRI to investigate the effects of ECT treatment on Hurst index (E/I balance) and functional coupling in MDD patients. Findings revealed that following ECT, the Hurst index of the MCC in MDD decreased significantly (enhanced E/I balance), and this change showed a significant spatial correlation with lower levels of cortical myelination, which suggests that ECT may promote the compensatory restoration of MCC functional flexibility by reducing myelination to improve cognitive control and emotional regulation. Concurrently, the attenuation of MCC-PCC functional connectivity may contribute to the inhibitory effect of ECT on DMN hyperactivity to improve rumination. These macroscopic neurophysiological alterations may be achieved through ECT’s regulation of neurotransmitter systems, including glutamate, GABA, and histamine, as well as its molecular and cellular-level impacts on excitatory neurons and glial cells (astrocytes, microglia, and oligodendrocytes).
Supplementary material
The supplementary material for this article can be found at http://doi.org/10.1017/S0033291726105959.
Author contribution
J.W., Y.T., and M.C. contributed to the conception and design of the study. X.Y., F.Y., B.C., W.S., and Y.T. contributed to the data acquisition and analysis. Y.X., J.W., and F.Y. wrote and edited the manuscript. All the authors discussed the article.
Funding statement
The present study was supported by Yunnan Fundamental Research Projects (No.202501AV070005), Kunming University of Science and Technology & The Second People’s Hospital of Yuxi Joint Special Project on Medical Research (KUST-YX2024003Y; KUST-YX2024004Y; KUST-YX2024005Y), and Kunming University of Science and Technology & the First People’s Hospital of Yunnan Province Joint Special Project on Medical Research (KUST-KH2023011Y).
Competing interests
The authors declare none.




 Open access

