Although carbohydrate can be used as an energy source for aquatic animals, compared with mammals, fish, especially carnivorous species, have a relatively low capability of carbohydrate utilisation, which is considered to be congenital glucose intolerance(Reference Enes, Panserat and Kaushik1,Reference Stone2) . There are many speculations about the reasons for the low tolerance of carnivorous fish to glucose. For example, the hexokinase activity in fish is lower than in mammals(Reference Hemre, Mommsen and Nutrition3). Several studies have shown that other hormones, such as somatostatins and leptin, may inhibit insulin secretion, and the insufficient plasma insulin levels lead to persistent hyperglycaemia in fish(Reference Lin and Accili4,Reference Sheridan and Kittilson5) . The reason for this view is that exogenous addition of insulin can reduce plasma glucose, thereby alleviating persistent hyperglycaemia in fish(Reference Shi, Liu and Xu6). Another view is that the secretion of insulin in fish is stimulated by some amino acids, which is more sensitive than that by glucose(Reference Andoh7,Reference Mommsen8) . It has been proven that intraperitoneal (IP) injection of glucose in gilthead sea bream (Sparus aurata) increased the insulin levels but the effect was lower than that of arginine(Reference Vega-Rubín de Celis, Rojas and Gómez-Requeni9). Besides, the gluconeogenesis pathway in carnivorous fish was not inhibited in high glucose conditions, which may also be one of the important reasons for glucose intolerance(Reference Enes, Panserat and Kaushik10–Reference Panserat, Capilla and Gutierrez13). However, the reasons for glucose intolerance in carnivorous fish are inconclusive, which should still attract our more attention.
Glucose tolerance test (GTT) is a diagnostic procedure used to detect human diabetes, which is also widely used in the study of glucose metabolism in fish. Several studies have found that the glucose tolerance of different fish species varies greatly. For example, in the GTT experiment of gilthead seabream (Sparus macrocephalus) and European seabass (Lateolabrax japonicus), the results showed that the concentration of glucose in plasma of gilthead seabream reached the peak at 1–3 h after injection, while that of European seabass reached the peak at 3–6 h(Reference Peres, Gonçalves and Oliva-Teles14). Oral GTT of rainbow trout (Oncorhynchus mykiss), Salmo gairdneri (Richardson), showed persistent hyperglycaemia within 6 h of oral glucose(Reference Palmer and Ryman15). After IP injection of glucose for 24 h, the transgenic coho salmon (Oncorhynchus kisutch) can recover to the basal glucose level(Reference Panserat, Kamalam and Fournier16). Moreover, multiple studies have explored the molecular mechanism of glucose metabolism in fish through GTT experiments. Research on orange spotted grouper (Epinephelus coioides) showed that delayed transcription of the glucose transporter 1 (Glut1) gene following glucose injection may underlie the glucose intolerance(Reference Liu, Dong and Chi17). The GTT experiment in juvenile European sea bass (Dicentrarchus labrax) revealed that glucose loading had limited effects on plasma insulin and insulin-like growth factor-I concentrations, suggesting glucose may not be the primary stimulator of insulin secretion(Reference Enes, Peres and Sanchez-Gurmaches18). Furthermore, gene expression profile refers to the construction of a non-biased complementary DNA (cDNA) library of cells or tissues in a given state to understand the type and abundance of gene expression(Reference Matsubara and Okubo19). At present, gene expression profiles have been widely used in the study of fish metabolism(Reference Panserat, Kolditz and Richard20–Reference Yasuike, Takano and Kondo22). Therefore, it is feasible to construct gene expression profiles to explore the expression characteristics of genes under specific nutritional conditions in fish.
Japanese flounder (Paralichthys olivaceus), as a typical marine carnivorous fish, is mainly distributed in China, the Korean Peninsula and the coastal areas of Japan. At present, several studies on glucose metabolism of Japanese flounder have been carried out. The carbohydrate in P. olivaceus could be utilised effectively by regulating glucose and lipid metabolism fed with a diet containing less than 120 g/kg of carbohydrate, while the glucose homeostasis would be disordered with a diet containing 200 g/kg of carbohydrate(Reference Yang, Deng and Pan23). Compared with the diet containing 8 % and 16 % of carbohydrate, the excessive carbohydrate level (24 %) caused oxidative stress, glucose transport obstruction and immune response of Japanese flounder. Besides, it was also found that the suppressor of cytokine signalling 3 (SOCS3) may play a bridge role between immune response and glucose metabolism, but its function has not been further verified(Reference Deng, Pan and Liu24). In the comparison experiment of different administration methods of P. olivaceus, it was found that the hyperglycaemia was maintained for a longer time (21 h) by IP injection of glucose, while that of oral glucose was maintained for about 10 h(Reference Liu, Guo and Han25). The molecular network regulating glucose metabolism in Japanese flounder mainly needs further exploration. Moreover, there is a lack of enrichment of transcriptome data in the study of glucose metabolism in P. olivaceus. Through high-throughput sequencing of Japanese flounder under glucose load conditions, gene expression profiles can be constructed to screen the target genes involved in glucose metabolism. Therefore, in the present study, the GTT experiment was carried out to analyse the concentration of glucose and insulin. After that, the high-throughput sequencing platform and gene expression profiles were selected to explore the molecular targets related to glucose metabolism in P. olivaceus.
Materials and methods
All the experiments and procedures in the present study were carried out in strict accordance with the guidelines for the Use of Experimental Animals of Ocean University of China, and the approval number was OUC-SOCS3-2024-0410.
Glucose tolerance test (GTT)
Experimental animals and sampling
The Japanese flounders (initial weight: 225 ± 50 g) for experiments were purchased from Huanghai Aquatic Products Co., Ltd. (Yantai, Shandong Province, China). Before the formal experiment, all fish were temporarily cultured in the circulating water aquaculture system for 2 weeks, and thereafter starved for 24 h before GTT. Ninety Japanese flounders were randomly selected to weigh, and then anaesthetised with MS-222 (50 mg/l). Before injection, eight fish were chosen as control group (0 h). The remaining fish were injected with glucose intraperitoneally at 1000 mg/kg body weight(Reference Liu, Guo and Han25). The control group was injected with PBS at the same dose. The blood was taken from the caudal vertebrae and the liver tissue was sampled at 0, 1, 3, 5, 7, 9, 12, 24 and 48 h after injection, respectively. Among them, eight Japanese flounders were ensured to be sampled at each time point. After standing at 4°C for 6 h, the blood was centrifuged at 4000 g/min and 4°C for 10 min to collect serum, which was used to determine the concentration of glucose and insulin. The liver samples were frozen in liquid nitrogen and stored at −80°C for subsequent gene expression profiling.
Detection of the concentration of glucose and insulin in serum
The concentration of glucose was detected by the glucose oxidase method with the glucose kit (A154-1-1, Nanjing Jiancheng Bioengineering Institute, China). The concentration of insulin was determined using the insulin elisa assay kit (FT-Y10226P, Fantaibio, China). The specific methods were as follows. The samples and standard substances were added to the ninety-six-well plate, and the enzyme-labelled reagents were added according to the instructions to incubate at 37°C for 60 min. After five times of washing, the chromogenic agent was added to develop at 37°C for 15 min. Then, the termination solution was added to each well. Finally, the absorbance (OD value) of each hole was measured in sequence at 450 nm wavelength.
The construction of gene expression profiling
Transcription samples preparation
According to the concentration of glucose and insulin detected in GTT, the experimental groups for detecting gene expression profiling were selected. The 0 h treatment group mentioned above was chosen as the control group (IP0), and the 3 h and 5 h after glucose injection were chosen as the experimental groups, named IP3 and IP5. The hepatic mRNA of Japanese flounders was extracted by Trizol Reagent (Takara, Japan) method for transcriptome analysis. The quality of mRNA samples was detected as follows. Gel electrophoresis was used to detect the degree of degradation and contamination, and the OD260/280 was measured by Nanodrop 2000 (Thermo Fisher Scientific, USA). The concentration of mRNA was quantified by Qubit (Thermo Fisher Scientific, USA) and the integrity was detected by Agilent 2100 (Agilent, China). After the mRNA quality test was qualified, it was broken into fragments and reversed into cDNA to add A tail and adaptor. Finally, the library was constructed after enrichment. HiSeq sequencing was performed after the library data was tested.
Sequencing data analysis
Illumina sequencing reaction was completed by Beijing Nuohe Zhiyuan Co., Ltd. After screening the obtained original data, the pure sequence used for subsequent analysis was obtained. The data processing included the removal of junctions, sequences containing 10 % undetermined bases and more than 50 % of sequences with mass values below five. The screening criteria for differential genes were that the difference was greater than two times and P < 0·05. Gene Ontology (GO) and Kyoto Encyclopedia of Genes and Genomes pathway enrichment were used for gene function and pathway analysis, respectively.
Validation of differential gene expression by qRT-PCR
Differentially expressed genes in the results of gene expression profiles were randomly screened and verified by quantitative real-time fluorescence quantification. The qRT-PCR was carried out in a quantitative thermal cycle (Mastercycler® eprealplex; Eppendorf, Germany). The primer sequences were listed in Table 1. Appropriate amount of cDNA, 0·8 μl of each primer, 10 μl 2 × qPCR SuperMix and water were added in a 20 μl reaction mixture. The qRT-PCR programme was set as follows: 95°C for 0·5 min, afterwards 40 cycles of 95°C/10s, 58°C/15s and 72°C for 10s. At the end of PCR reaction, melting curve analysis was performed to confirm the specificity of production. Housekeeping genes (β-actin and glyceraldehyde-3-phosphate dehydrogenase) were selected from a pool of ten candidate housekeeping genes. The expression of genes was calculated and normalised via the 2−ΔΔCT method(Reference Livak and Schmittgen26).
Sequences for qRT-PCR primers

Note: MAPKBP, mitogen-activated protein kinase-binding protein 1; BHMT, betaine homocystein methyltransferase; SOCS3, suppressor of cytokine signalling 3; GGT, γ-glutamyltransferase; SOD, superoxide dismutase; BSAL, bile salt-activated lipase; β-actin, beta-actin; GAPDH, glyceraldehyde-3-phosphate dehydrogenase; IRS1, insulin receptor substrate 1; IRS2, insulin receptor substrate 2; PI3K, phosphatidyl Inositol 3-kinase; AKT1, protein kinase B 1; AKT2, protein kinase B 2; GLUT2, glucose transporer 2; GK, glucokinase; PK, pyruvate kinase; G6Pase, glucose-6-phosphatase; PEPCK, phosphoenolpyruvate carboxykinase.
Cloning and functional identification of SOCS3
Full-length gene cloning and analysis of SOCS3
The trizol method mentioned above was used to extract total RNA from the liver tissue of Japanese flounder from the control group. cDNA was synthesised from 1 μg/μl of total RNA using the reverse transcription kit of PrimeScript® RT reagent Kit with gDNA Eraser (Takara, Japan). According to the expressed sequence tags sequence of the gene obtained from the transcriptome sequencing of Japanese flounder in our laboratory, the 3‘RACE and 5’RACE primers (outer-F: TCCAACTTCACCCCACATCG, inner-F: GTGCCCCCACAGTTTGATTG, outer-R: CAATCAAACTGTGGGGGCAC, inner-R: TCGCAGGTTCTTGGTTCCTC) were designed by Primer Premier 5·0 software. The products of RACE amplification were detected by 2·0 % agarose gel electrophoresis. The target fragment was recovered and purified by gel recovery kit (Sangon Biotech, China), and then ligated with PEAST-T1 vector (TransGen, China), transformed into E. coli competent cells (TransGen, China) and screened by LB solid medium (Hopebio, China) containing ampicillin (G-Clone, China) and X-gal (Yeasen, China). The positive clones (white pot) were identified by colony PCR and the used primers were sent to Sangon (Sangon Biotech Co., Ltd., Shanghai) (M13-F: CGCCAGGGTTTTCCCAGTCACGAC, M13-R: AGCGGATAACAATTTCACACAGGA) for sequencing. All nucleotide sequences were blasted against the GenBank database using the BlastX algorithm at the National Center for Biotechnology Information (http://www.ncbi.nlm.nih.gov/blast) to determine the gene identities. The open reading frame of SOCS3 was identified by the internet-based open reading frame-finder programme (https://www.ncbi.nlm.nih.gov/orffinder/) and the cDNA sequence was translated by the EXPASY translation tool (http://web.expasy.org/translate/). Protein domain was searched against the NCBI conserved domain database (http://www.ncbi.nlm.nih.gov/Structure/cdd/wrpsb.cgi) and predicted by the SMART web tool (http://smart.embl-heidelberg.de/). Besides, the Swiss model online tool was selected to predict the protein secondary structure (https://swissmodel.expasy.org/). The phylogenetic analysis was conducted based on multiple sequence alignments using the neighbour-joining method with the MEGA 5.0 programme.
The expression of SOCS3 in different tissues
During the GTT experiment, nine tissues of the Japanese flounders in the control group, including skin, liver, intestine, muscle, gill, spleen, stomach, head kidney and heart, were sampled for detecting SOCS3 expression in different tissues. The method of RNA extraction, quality detection and cDNA transcription of each tissue was consistent with the methods mentioned above. The qRT-PCR method was also used to detect the gene expression of SOCS3 in different tissues. The calculation method and the selection of reference genes were same as the above.
Culturing primary hepatocytes of Japanese flounder
Japanese flounders were anaesthetised with MS-222 (50 mg/l), and then the blood was taken from the caudal vertebrae after disinfecting with 75 % alcohol. Subsequently, the liver was isolated and cleaned with 0·1 % PBS (Biosharp, China). The liver was cut into slices in Medium DMEM/ F12 (Hyclone, USA) and primary hepatocytes were isolated by using trypsin (0·25 %) (Gibco, USA). Red blood cell lysis buffer (Solarbio, China) was used to eliminate red cells. Briefly, cell suspension was carefully cleared from non-parenchymal cells by differential centrifugation. After that, hepatocytes were suspended at 20°C in Medium DMEM/ F12 supplemented with 5 mM Hepes (Sigma, USA), 1 % streptomycin and penicillin USA in the presence of 10 % foetal bovine serum (Gibco, USA). Hepatocytes were plated onto six-well plates. After 48 h of adherence, the medium was renewed. When the cell bespread the 70–80 % area of well, hepatocytes could be treated experimentally.
Preparation of transfection complexes for siRNA
Three siRNA duplexes targeting different encoding regions of SOCS3 and one cy3-labelled scrambled siRNA, which served as a silence negative control, were designed and chemically synthesised (Sangon Biotech, China) (Table 1). The siRNA (5 μg) was transfected into hepatocytes with 3·75 μl of Lipofectamine® 3000 reagent (Invitrogen, CA) per well in a six-well format according to the manufacturer’s protocol. Cells were harvested 24 h to determine transfection efficiency by qRT-PCR. Experiments would be subsequently performed to assess the silence effects only if the transfection effects were more than 60 % after transfection.
Data availability
The raw data files of high-throughput sequencing of P. olivaceus were deposited in the Sequence Read Archive (https://www.ncbi.nlm.nih.gov/sra/PRJNA1185416) of NCBI. The accession number of submission ID is SUB14859984.
Statistical analysis
All data were presented as mean (sd) and tested for normality and homogeneity of variances. Differences between two groups were evaluated by an independent-sample t test, and comparisons between three or more groups were performed by the one-way ANOVA. Statistical analyses were performed using SPSS 25.0 software (IBM), and the difference was significant at P < 0·05.
Results
Analysis of GTT
After IP injection of glucose, the concentration of glucose and insulin in serum was detected at 0, 1, 3, 5, 7, 9, 12, 24 and 48 h. The results showed that the glucose concentration in serum of glucose group increased first and then decreased with time, reaching the highest level at 5 h and returning to normal level at 48 h. The insulin concentration showed an overall downward trend before 12 h, which was the lowest at 3 h, and returned to normal insulin level at 48 h (Figure 1).
The contents of glucose (a) and insulin (b) in serum of Japanese flounder at different time points after glucose intraperitoneal injection. Note: The results are shown as Means (sd) of six replicates. Different superscript letters indicate significant differences (P < 0·05).

Results of gene expression profiling
Analysis of transcriptome sequencing
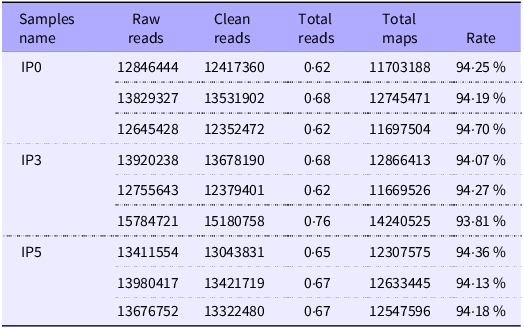
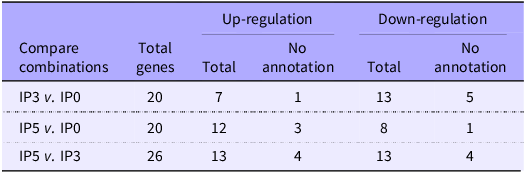
The data results of nine libraries in the experimental group after HiSeqTM2500/MiseqTM high-throughput sequencing are presented in Table 2. More than 93 % of the sequences in each sample could be aligned to the genome of Japanese flounder, indicating that the sequencing results had high accuracy. There were three comparative combinations of experimental designs (IP3 v. IP0, IP5 v. IP0, IP5 v. IP3). The differential genes were screened according to the standard of |log2 (Fold Change)|> 1 and P < 0·05, which the screening results are shown in Table 3. It was found that high glucose induced fifty-eight differential genes in the liver of P. olivaceus after IP injection, and there were no common differential genes in the three comparison combinations (Figure 2). The differential genes obtained by the comparison of the three combinations were compared and analysed. Compared with 0 h, 20 differentially expressed genes were screened at 3 h and 5 h, respectively. The number of up-regulated genes was seven and twelve, and the number of down-regulated genes was thirteen and eight, respectively. The number of unannotated genes was four. Compared with 3 h, there were twenty-six differentially expressed genes at 5 h, thirteen up-regulated and down-regulated genes and four unannotated genes (Table 3). Then, the similarity and density of differential genes were analysed by cluster analysis, and it was found that there were significant differences in spatial and temporal expression of differential genes (P < 0·05) (Figure 2(b)). Among them, the genes with large differences were mitogen-activated protein kinase-binding protein 1, chymotrypsinogen 1, γ-glutamyltransferase (GGT), stearoyl-CoA desaturase, phosphodiesterase 2, suppressor of cytokine signalling 3 (SOCS3) and CCAAT/enhancer-binding protein α (Table 4).
Sequencing information for different samples of Paralichthys olivaceus with glucose injection

Note: IP represents intraperitoneal injection, and the number represents sampling time; raw reads, a unit of four behaviours, the number of sequencing sequences per file; clean reads, remove belt joint (adapter), N (N is unable to determine the base information) greater than 10 % and low quality of reads (incorrect identification probability of bases over 1/100 of the base number accounts for more than 50 % of the entire length of the read reads) sequence number, the calculation method is the same as raw reads; clean bases, the number of clean reads times the length, and turns it into a unit of G.
The overview of three combinations of differential genes

Note: IP represents intraperitoneal injection, and the number represents sampling time.
Venn diagram of differential expression genes and cluster analysis. Note: IP represents intraperitoneal injection, and the number represents sampling time. (a) Distribution of the genes commonly and specifically expressed; the sum of numbers in each circle represents the total number of differentially expressed genes in each combination, and the overlaps represent the shared genes; (b) Cluster analysis of differentially expressed genes, where the colour from blue to red represents the expression value from low to high.

Figure 2 Long description
Panel A: A Venn diagram shows the distribution of differentially expressed genes in fish after intraperitoneal injection of glucose. The diagram includes three circles labeled IP3 vs IP0, IP5 vs IP0, and IP3 vs IP5. The numbers within the circles indicate the count of differentially expressed genes specific to each comparison, while the overlapping regions show the shared genes. For example, IP3 vs IP0 has 15 unique genes, IP5 vs IP0 has 14 unique genes, and IP3 vs IP5 has 21 unique genes. The overlapping regions show the number of shared genes between the comparisons. Panel B: A heatmap displays the cluster analysis of differentially expressed genes. The horizontal axis represents different sampling times labeled IP5, IP0, and IP3. The vertical axis represents the genes. The color scale ranges from blue to red, indicating the expression values from low to high. The heatmap shows the expression patterns of genes across different sampling times.
The differential gene expressions of Japanese flounder during GTT

Note: IP represents intraperitoneal injection, and the number represents sampling time. MAPKBP1, mitogen-activated protein kinase-binding protein 1; MAPKKK3, mitogen-activated protein kinase kinase kinase 3; CTRB1, chymotrypsinogen 1; ALAS2, 5-aminolevulinate synthase; BHMT, betaine homocystein methyltransferase; ENPP2, phosphodiesterase 2; BSAL, bile salt-activated lipase; CA, carbonic anhydrase; SOD, superoxide dismutase; SOCS3, suppressor of cytokine signalling 3; CEBP-α, CCAAT/enhancer-binding protein α; FNG, glycosyltransferase; GGT, γ-glutamyltransferase; CD28, T-cell-specific surface glycoprotein; MSI2, RNA-binding protein; CHD-9, Chromodomain-helicase-DNA-binding protein 9; SASS6, spindle assembly abnormal protein 6 homolog; SCD, stearoyl-CoA desaturase; BSAL, bile salt-activated lipase.
GO function and Kyoto Encyclopedia of Genes and Genomes pathway enrichment
Table 5 shows that the GO function of the differential genes in each comparison combination mainly focused on cell composition, molecular function and biological process. The three comparison combinations were enriched to 385, 246 and 219 GO function numbers, respectively; however, there was no significant GO enrichment term. Kyoto Encyclopedia of Genes and Genomes was used to screen the biological signalling pathways that responded positively during GTT. A total of twenty-three KEGG signalling pathways were enriched, mainly involving sterols, lipids and amino acid metabolism. There was also no significant enrichment pathway (Table 6).
Overviews of GO-terms after paired comparison

Note: IP represents intraperitoneal injection, and the number represents sampling time.
Enrichment terms of KEGG pathway of differential genes in liver of Japanese flounder during GTT

Note: IP represents intraperitoneal injection, and the number represents sampling time.
KEGG, Kyoto Encyclopedia of Genes and Genomes.
Relative expression of differential genes of transcriptome
To verify the expression results of digital gene expression profiling, the qRT-PCR was performed to detect the relative expression of differential genes (Figure 3). Compared with 0 h, the expression of betaine homocystein methyltransferase and SOCS3 was significantly increased at 3 h and 5 h, which all reached the highest level at 5 h (P < 0·05). The lowest mitogen-activated protein kinase-binding protein 1 expression was found at 3 h (P < 0·05). The relative expression of chymotrypsinogen 1 and stearoyl-CoA desaturase at 3 h was significantly higher than at 0 h (P < 0·05), but no difference with 5 h. The highest GGT expression was measured at 5 h (P < 0·05). The expression of α-amylase and bile salt-activated lipase showed an up-regulation trend first and then down-regulated, with their highest levels at 3 h (P < 0·05).
Partial differential expressed genes in transcriptome were verified by qRT-PCR. Note: IP represents intraperitoneal injection, and the number represents sampling time. MAPKBP, mitogen-activated protein kinase-binding protein 1; CTRBI, chymotrypsinogen 1; BHMT, betaine homocystein methyltransferase; SOCS3, suppressor of cytokine signalling 3; GGT, γ-glutamyltransferase; SCD, stearoyl-CoA desaturase; BSAL, bile salt-activated lipase. The results are shown as means (sd) of six replicates. Different superscript letters indicate significant differences (P < 0·05).

Identification of function of SOCS3
Cloning and analysis of SOCS3
Full-length cDNA of SOCS3 (GenBank Accession: No.KY765900) comprised of 2142 bp with the following features: 629 bp 5’-untranslated region (UTR), 678 bp open reading frame and 835 bp 3’-UTR. The open reading frame encoded a polypeptide of 225 amino acids with predicted molecular weight of 24·86 KDa and theoretical isoelectric point of 9·43. The deduced protein sequence of SOCS3 displayed typical structures of SH2 (the sequence marked by black solid line) and SOCS3-box (the sequence marked by red solid line) (Figures 4 and 5). The phylogenetic tree was constructed with the full-length SOCS3 polypeptide of various fish species, birds, amphibian, reptile and other mammals. The phylogenetic tree obviously showed the SOCS3 of P. olivaceus evolved into one branch with other fish, followed by amphibians and birds, and furthermore had the farthest evolutionary relationship with reptiles and mammals (Figure 6).
Nucleotide sequence and deduced amino acid sequence of Japanese flounder SOCS3 gene (a). Protein secondary structure model derived from SOCS3 amino acid sequence (b). Note: The SH-2 domain was marked with black solid lines; SOCS3-box was marked with red solid line. SOCS3, suppressor of cytokine signalling 3.

Comparison of deduced amino acid sequence of SOCS3 with that from other fish and species. Note: The SH-2 domain was marked with black solid lines; SOCS3-box was marked with red solid line. SOCS3, suppressor of cytokine signalling 3.

Phylogenetic tree based on SOCS3 amino acid sequences of Japanese flounder was constructed by neighbour-joining method. SOCS3, suppressor of cytokine signalling 3.

Figure 6 Long description
A phylogenetic tree based on SOCS3 amino acid sequences of Japanese flounder. The tree is divided into several groups: Bird, Reptile, Mammal, Amphibian, and Fish. Each group contains various species with their respective SOCS3 amino acid sequences. The tree shows the evolutionary relationships among these species, with branches indicating common ancestors and divergence points. The Bird group includes species like Tinythorax ludovicianus and Piprites chloris. The Reptile group includes species like Terrapene triunguis and Chrysopelea pelias. The Mammal group includes species like Myodes glareolus and Homo sapiens. The Amphibian group includes species like Rhinatrema bivittatum and Bombina bombina. The Fish group includes species like Perca flavescens and Paralichthys olivaceus.
Expression of SOCS3 in different tissues of Japanese founder
The gene expression of SOCS3 was determined in different tissues of Japanese flounder, such as muscle, gill, liver, intestine, spleen, head kidney, stomach, skin and heart. The highest expression of SOCS3 was observed in liver and intestine, followed by kidney (P < 0·01). The expression level of SOCS3 in heart was significantly higher than that in muscle, gill, head kidney, stomach and skin (P < 0·05) (Figure 7).
Comparative analysis of SOCS3 gene expression in different tissues of Japanese flounder. Note: The results are shown as Means (sd) of six replicates. Different superscript letters indicate significant differences (P < 0·05). SOCS3, suppressor of cytokine signalling 3.

Knockdown of SOCS3 by SOCS3-siRNA in primary Hepatocytes
Three targeting SOCS3-siRNAs were synthesised in vitro and transfected into the primary hepatocytes using the Lipofectamine® 3000 reagent to identify the most effective siRNA duplex. The result indicated that the siSOCS-3 did not affect the expression levels of SOCS3. Although the siSOCS-2 significantly decreased the expression of SOCS3 compared with that of control group, the knock-down efficiency by only 30 %. While the siSOCS3–1 is the most efficient duplex for knocking down SOCS3 expression in the primary hepatocytes of Japanese founder, the knock-down efficiency was more than 60 % (Figure 8(a)).
The function of SOCS3 in glucose metabolism and insulin signal pathway of Japanese flounder. Note: IRS1, insulin receptor substrate 1; IRS2, insulin receptor substrate 2; PI3K, phosphatidyl Inositol 3-kinase; AKT1, protein kinase B 1; AKT2, protein kinase B 2; GLUT2, glucose transporer 2; GK, glucokinase; PK, pyruvate kinase; G6Pase, glucose-6-phosphatase; PEPCK, phosphoenolpyruvate carboxykinase; SOCS3, suppressor of cytokine signalling 3. The results are shown as Means (sd) of six replicates. *P < 0·05.

Figure 8 Long description
Panel A: A vertical bar graph shows the relative expression of SOCS3 under different conditions. The y-axis represents the relative expression of SOCS3, ranging from 0.0 to 1.4. The x-axis lists the conditions: Control, SC-siSOCS3, siSOCS3-1, siSOCS3-2, and siSOCS3-3. The bars indicate that siSOCS3-1 and siSOCS3-2 have significantly lower expression levels of SOCS3 compared to the Control and SC-siSOCS3 conditions, as indicated by the asterisks. Panel B: Another vertical bar graph shows the relative expression of various genes (IRS1, IRS2, PI3K, AKT1, AKT2, GLUT2, GK, PK, G6Pase, PEPCK) under Control and siSOCS3-1 conditions. The y-axis represents the relative expression of genes, ranging from 0.0 to 12.0. The x-axis lists the genes. The bars indicate that siSOCS3-1 condition shows significantly higher expression levels of IRS1, AKT2, GLUT2, GK, and PK, and significantly lower expression levels of IRS2, PI3K, and G6Pase compared to the Control condition, as indicated by the asterisks.
The expression of glucose metabolism-related genes after knocking down SOCS3
To verify the role of SOCS3 in glucose metabolism, the SOCS3 gene was knocked down and the expression of genes related to glucose metabolism pathway was detected (Figure 8(b)). The results showed that compared with the control group, the expression of insulin receptor substrate 1, protein kinase B 1, glucose transporter 2, glucokinase and pyruvate kinase in primary hepatocytes of Japanese flounder increased significantly after knocking down SOCS3, while the expression of phosphoinositide3-kinase (PI3K) and glucose-6-phosphatase decreased significantly (P < 0·05). Although there was no significant difference in the expression of protein kinase B 2, insulin receptor substrate 2 and phosphoenolpyruvate carboxykinase between the two groups, the insulin receptor substrate 2 and phosphoenolpyruvate carboxykinase in the SOCS3 knockdown group showed a downward trend.
Discussion
In the present study, the results of GTT showed that the concentration of glucose in serum peaked at 5 h after IP injection of glucose in P. olivaceus and returned to the fasting level at 48 h. The tolerance to glucose of carnivorous fish is also different due to different species(Reference Polakof, Panserat and Soengas27). Although the variation trend of the glucose was similar to the results of glucose tolerance in turbot, the glucose of turbot reached the peak at 3 h post injection and returned to the normal level at 24 h(Reference Garcia-Riera and Hemre28). As a hormone that can reduce blood glucose, the content of insulin is closely related to the glucose utilisation ability(Reference Kahn29). Through the analysis of insulin results, it was found that the insulin secretion of flounder was inhibited after IP injection of glucose, which was similar to the early research results of rainbow trout(Reference del Sol Novoa, Capilla and Rojas30,Reference Polakof, Míguez and Soengas31) . After injection of glucose, the decrease of insulin secretion may also be the reason for persistent hyperglycaemia in P. olivaceus. To explore reasons for the low utilisation rate of carbohydrate in carnivorous fish, many studies have carried out; however, there are still no clear results(Reference Borrebaek and Christophersen32–Reference Hall, Short and Driedzic35). Most of researches at the molecular level focused on the glycolysis and gluconeogenesis pathways in glucose metabolism(Reference Nie, Miao and Miao36,Reference Zhou, Wang and Xie37) . Therefore, finding the molecular targets for the regulation of glucose metabolism in carnivorous fish continues to be an important research objective.
To further explore the mechanism of glucose metabolism, the two time points with the most significant changes in concentration of glucose (5 h) and insulin (3 h) were selected in the GTT experiment. And then high-throughput sequencing platform was used to analyse the regulation of transcription level genes. Furthermore, to verify the accuracy of the transcriptome data results, eight differentially expressed genes were chosen randomly to be detected through qRT-PCR. The results showed that the overall trend of the expression results was consistent with the digital expression profile sequencing. Although there were differences in the specific expression levels, it may be due to different data analysis methods(Reference Ekman, Lorenz and Przybyla38).
According to the analysis of expression profile data, the glucose metabolism signalling pathway related to the liver of P. olivaceus was not activated after IP injection of glucose, and there was no significant GO and Kyoto Encyclopedia of Genes and Genomes enrichment. Carnivorous fish inherently exhibit low glucose sensitivity, which contributes to their limited glucose utilisation capacity. Thus, it is hypothesised that despite significant fluctuations in glucose levels, the glucose metabolic pathways remain poorly activated owing to their inherent low sensitivity to glucose. However, the analysis of metabolic pathways involved in differential genes showed that multiple signalling pathways related to immune and stress responses were activated, such as JAK-STAT3, TNF and Notch pathways(Reference Gao, Yao and Shi39–Reference Yadav, Kumar and Datta41). In addition, some of the differentially screened genes are actually closely related to glucose metabolism and oxidative stress. For example, the expression of GGT gene is mostly used as an indicator of clinical diabetes detection, and its expression level is negatively correlated with insulin sensitivity(Reference Shin, Chang and Shin42). In the study of human diseases, carbonic anhydrase is mainly involved in gas transport, acid-base regulation and tissue secretion, which plays an important role in maintaining the stability of the internal environment(Reference Supuran43). Besides, the enzyme activity of carbonic anhydrase is beneficial to alleviate the effect of oxidative reaction caused by hyperglycaemia on the brain(Reference Puscas, Călinici and Maghiar44). The mRNA expression of carbonic anhydrase and superoxide dismutase [Cu-Zn] was decreased with the increase of injection time, which indicated an oxidative stress disorder(Reference Blasco, Marimón and Viaplana45). While the gene expression of GGT, Chemokine-CXC and Selenoprotein-M increased with time, further demonstrating the body was in an oxidative stress state(Reference Bysani, Colston and Rosa46). Through the analysis of other annotated genes, it was found that the disorder of glucose metabolism was affected by many aspects. The mitogen-activated protein kinase signalling pathway plays an important role in maintaining glucose homeostasis, whose activation under high glucose conditions may lead to dysfunction of glomerular mesangial cells(Reference Sumara, Formentini and Collins47). Studies in Drosophila have confirmed that the mitogen-activated protein kinase signalling pathway can physiologically regulate the insulin sensitivity to maintain glucose homeostasis(Reference Rulifson, Zhang and Thompson48). In the present study, mitogen-activated protein kinase binding protein decreased at 3 h and 5 h, suggesting that the mitogen-activated protein kinase signalling pathway was inhibited to maintain glucose homeostasis after acute glucose stress. Betaine homocystein methyltransferase catalyses betaine to transfer methyl to homocysteine, thereby maintaining the stability of homocysteine content in the body(Reference Pellanda49). The PI3K/AKT signalling pathway could be regulated by homocysteine, leading to the occurrence of insulin resistance(Reference Wang, Li and Zhang50). After injection of glucose, the expression of betaine homocystein methyltransferase at 3 h and 5 h was significantly higher than that at 0 h, indicating that glucose injection caused insulin resistance in the short term. Furthermore, the expression level of SOCS3 is also closely related to the insulin concentration and metabolic pathways. SOCS3 can accelerate the decomposition of insulin and inhibit the activity of PI3K-AKT signalling pathway after binding of insulin and insulin receptor, which causes insulin resistance and then affects glucose metabolism(Reference Ueki, Kondo and Kahn51). In the present study, the mRNA expression of SOCS3 continued to increase after injection, which may be the crucial reason for the decrease in insulin. As a key molecular regulatory point of glucose metabolism, SOCS3 may play an important physiological role in this process.
SOCS3, as a cell signal transduction regulatory protein, can inhibit the signal transduction pathway of cytokines(Reference Hilton52). Briefly, it can regulate the speed and intensity of communication between cells and the surrounding environment, thus affecting the behaviour and physiological activities of cells. It has been proven that SOCS3 is associated with many diseases such as diabetes, inflammation and allergic reactions(Reference Pei, Dong and Liu53). To explore whether SOCS3 plays a role in glucose metabolism of Japanese flounder, the full-length of SOCS3 was first cloned, and only the nucleobase at 1307 site was different from the predicted SOCS3-like sequence (XM020112936·1). The amino acids encoded by the SOCS3 open reading frame were highly similar to those of other species. In the studies of human, mouse and pig, the protein sizes encoded by the SOCS3 were 24·8KDa, 24·7KDa and 25·1KDa, respectively(Reference Delgado-Ortega, Melo and Meurens54,Reference Delgado-Ortega, Marc and Dupont55) . The molecular weight of the SOCS3 protein of Japanese flounder was 24·84, indicating that the precursor protein of SOCS3 is highly consistent. Besides, the amino acid sequence of SOCS3 of Japanese flounder has typical SOCS3-box and SH2 regions, which are highly similar to other fish species and mammals(Reference Liu, He and Chen56,Reference Wang, Liu and Wang57) . The amino acid structure characteristics of SOCS3 also suggest that its gene function may be similar to that of mammals. The SH2 region in the centre of SOCS3 can recognise the phosphotyrosine group, and SOCS3-box is composed of elongation factor B/Cand cullin 5, which can bind to E2 ubiquitin cross-linking enzyme and degrade the target protein(Reference Kamura, Maenaka and Kotoshiba58). The expression of SOCS3 in different tissues was further detected and found that it was highly expressed in liver and intestine. Previously, SOCS3 was also found to be highly expressed in the liver in mammalian models of insulin resistance(Reference Emanuelli, Peraldi and Filloux59,Reference Ueki, Kondo and Kahn60) . The liver, as a key metabolic tissue, is an important organ for exploring glucose metabolism(Reference Klover and Mooney61). Therefore, the high expression of SOCS3 in the liver suggests that it may be a key molecule in the metabolic regulation process.
In our previous study, it was found that dietary carbohydrate level had a significant effect on SOCS3, IRS and PI3K-AKT signalling pathways in Japanese flounder. High carbohydrate diet (24 %) significantly increased the expression of SOCS3 in the liver and inhibited the PI3K-AKT signalling pathway(Reference Deng, Pan and Liu24). Therefore, it was reasonable to speculate that the up-regulation of SOCS3 was one of the causes of insulin resistance in Japanese flounder. The primary hepatocyte of Japanese flounder was selected as the research object to knock down the SOCS3 gene and explore its role in insulin signalling pathway and glucose metabolism. With the development of technology, knockout and knockdown of tissue and cell-specific genes have been widely used in mammalian research. It was confirmed in mice that the knockout of SOCS3 gene significantly increased insulin sensitivity in the liver(Reference Torisu, Sato and Yoshiga62). As a key enzyme in the process of glycolysis, the abnormal expression and activity of glucokinase is an important manifestation of the imbalance of blood glucose homeostasis(Reference Caseras, Metón and Vives33). The long-term hyperglycaemia caused by GTT was related to the lack of glucokinase enzyme in the liver of fish(Reference Caseras, Metón and Vives33,Reference Fu and Xie63) . Phosphoenolpyruvate carboxykinase and glucose-6-phosphatase, as the key rate-limiting enzymes in the gluconeogenesis pathway, are not inhibited under high carbohydrate dietary, which is one of the hypotheses of congenital glucose intolerance in carnivorous fish(Reference Kalhan and Parimi64). In the comparative study of gibel carp (Carassius auratus gibelio) and Chinese longsnout catfish (Leiocassis longirostris Günther), the activity of phosphoenolpyruvate carboxykinase was affected by different carbohydrate sources, and the glucose-6-phosphatase activity of L. longirostris Gunther fed with high-starch diet did not change significantly; that is, the gluconeogenesis pathway was not inhibited under high glucose conditions(Reference Su, Gong and Mei65,Reference Tan, Xie and Zhu66) . By detecting the expression of key genes in insulin signalling pathway and glucose metabolism, it was found that the expression of insulin receptor substrate 1, PI3K, protein kinase B 2, glucose transporer 2 and glucokinase in the primary hepatocyte of P. olivaceus after interfering with SOCS3 was significantly higher than that in the control group, while the expression level of glucose-6-phosphatase was significantly decreased. Therefore, it was confirmed that the knockdown of SOCS3 can improve the sensitivity of insulin signalling pathway, promote the transport of glucose and can also improve the ability of glucose utilisation by down-regulating the expression of gluconeogenesis genes and up-regulating the glycolysis genes.
Conclusion
In summary, IP injection of glucose could lead to persistent hyperglycaemia in Japanese flounder, and the basal concentration of glucose can be restored at 48 h. The key SOCS3 gene related to glucose homeostasis was screened out, and the utilisation of glucose was related to the sensitivity of insulin signalling pathway mediated by SOCS3. This gene can be used as a molecular target for regulating glucose metabolism in carnivorous fish for subsequent research.
Acknowledgments
Thank you to all the authors for their dedication and support for this study.
This work was supported by the Fundamental Research Funds for the Central Universities (No. 202261036), Taishan Scholar Project, Shandong, China.
G. Q.: Data curation, Formal analysis and Writing-original Draft; K. D.: Methodology, Formal Analysis and Writing-original draft; M. P.: Experimental design, Formal Analysis and Writing-reviewing; D. H.: Writing-Reviewing and Editing; X. L.: Data Curation; Y. L.: Validation, Writing-Reviewing and Editing; X. Y.: Writing-Reviewing and Editing; K. M.: Supervision, Project administration. W. Z.: Conceptualisation, Writing-Reviewing and Editing, Funding acquisition.
The authors declare no conflicts of interest.