I. INTRODUCTION
Cast magnesium alloys have drawn considerable interest in transportation because of their much low density. Reference Hirsch and Al-Samman1 Producing automotive components such as engine blocks by magnesium alloys would significantly improve the fuel efficiency and specific power output. Reference Luo2 Since auto parts are usually subjected to cyclic loading, the fatigue properties have been considered as one of the key performance indicators. Reference Gall, Biallas, Maier, Gullett, Horstemeyer, McDowell and Fan3–Reference Begum, Chen, Xu and Luo5 Generally, the high-cycle fatigue (HCF) characteristics of magnesium castings are mainly determined by the defects Reference Mayer, Papakyriacou, Zettl and Stanzl-Tschegg6–Reference Lorenzo, Alegre and Cuesta8 or the microstructures. Reference Li, Wang, Luo, Peng and Zhang9–Reference Mokhtarishirazabad, Azadi, Farrahi, Winter and Eichlseder11 For the defect-free magnesium alloys, the fatigue cracks initiate from and then propagate along the cracked twin bands in the solution treated condition (T4) and persistent slip bands (PSBs) in the peak-aged (T6) and over peak-aged (T7) conditions. Reference Li, Wang, Luo, Peng and Zhang9 It has been found that alloying elements can significantly influence the fatigue behavior of magnesium alloys. For instance, the fatigue strength (FS) of the Mg–Al base alloys was related to the Al content. Reference Nový, Janeček, Škorik and Wagner12–Reference Mokhtarishirazabad, Boutorabi, Azadi and Nikravan14 Jiang et al. found that increasing the Gd content leads to the increase of the fatigue life of the Mg–Gd–Y–Zr alloys at a high stress amplitude. Reference Jiang, Liu, Wu and Ding15 Li et al. also reported that the addition of Zr element significantly improves the FS of the Mg–3Nd–0.2Zn alloys (all compositions are in weight percentage throughout this article except otherwise stated). Reference Li, Wang, Luo, Zhang and Peng16
Compared with the Mg–9Al–1Zn–0.3Mn (AZ91) alloy which is a commonly used magnesium alloy, Reference Mayer, Papakyriacou, Zettl and Stanzl-Tschegg6–Reference Lorenzo, Alegre and Cuesta8 the Mg–RE system (i.e., Mg–Nd–Zn–Zr) exhibits superior tensile properties, FSs, and corrosion resistance. Reference Li, Wang, Luo, Fu, Peng, Wang and Wu10,Reference Li, Luo, Wang, Peng, Fu and Wu17,Reference Chang, Guo, Fu, Peng and Ding18 These alloys are becoming increasingly attractive for the automotive engine blocks and wheels. For instance, the engine block produced by the peak-aged Mg–3Nd–0.2Zn–0.5Zr (NZ30K) alloy was found to have a yield strength (YS) of ∼160 MPa and FS of ∼90 MPa at 20 °C, which are 45 and 22 MPa higher than those of the peak-aged AZ91D alloy, respectively. Reference Li, Wang, Luo, Peng, Fu and Wang19 The FS of the NZ30K-T6 alloy is slightly lower than that of a commercial A319 aluminum alloy used for engine blocks in GM (20 °C–100 MPa). Reference Wang and Jones20 However, the Nd element is expensive, thus the NZ30K alloy with 3.0% Nd addition is costly, which would limit their applications. Hence, whether the Nd content in the alloy could be reduced or not on the basis of meeting property requirements for structural applications or not is of great importance. In this work, the influence of Nd additions on the low-cycle fatigue (LCF) and HCF properties and cyclic deformation behavior of the peak-aged Mg–0.2Zn–0.5Zr alloy were systemically clarified.
Fatigue testing is costly and time-consuming, thus many attempts (such as multi-scale fatigue (MSF) life models) have been made to predict the fatigue lives of magnesium alloys without casting defects based on tensile properties and grain size. Reference Li, Wang, Luo, Peng and Zhang9,Reference Wang and Jones20 Yu et al. also found that for an extruded Mg–6Zn–0.6Zr (ZK60) alloy, the LCF life curve can be well predicted using a three-parameter equation. Reference Yu, Zhang, Jiang and Li21 Moreover, Park et al. reported that an energy-based criterion based on the plastic or total strain energy was able to describe the low cycle fatigue strain-life curve of a rolled magnesium alloy. Reference Park, Hong, Lee, Bang and Lee22
Therefore, the three-parameter equation, Reference Yu, Zhang, Jiang and Li21 the energy-based concepts, Reference Park, Hong, Lee, Bang and Lee22 and the MSF life models Reference Li, Wang, Luo, Peng and Zhang9,Reference Wang and Jones20 were also applied to predict the LCF or HCF lives of the studied alloys and compared with the experimental results.
II. EXPERIMENT PROCEDURE
A. Materials and sample preparation
The low-pressure sand casting bars with a 13 mm diameter used in the present study are the same as those used in our previous works, and details about the preparation of the casting bars can be found in Ref. Reference Peng, Fu, Li, Yue, Li and Wang23. The actual chemical compositions of the Mg–xNd–0.2Zn–0.5Zr (x = 1.0, 2.0, 3.0 wt%) alloys were determined using inductively coupled plasma (ICP) and are Mg–2.96Nd–0.22Zn–0.4Zr, Mg–2.12Nd–0.19Zn–0.42Zr, and Mg–3.09Zn–0.21Zn–0.39Zr, respectively.
The cast bars were solution treated at 540 °C for 8 h, peak-aged at 200 °C for 14 h (T6), and then machined to be samples for tensile and fatigue tests. The tensile specimens have a gauge diameter of 6 mm, a gauge length of 30 mm, and a radius between gauge length and grip end (R) of 6 mm, and the LCF and HCF samples have a gauge diameter of 6 mm, a gauge of 12 mm, and a R of 48 mm. Electrolytic polishing (EP) was applied to the fatigue specimens to eliminate the influence of machining on the results prior to the fatigue testing.
B. Tensile testing and fatigue testing
The tensile test was carried out on a Zwick/Roell-20 kN tensile testing machine and the tensile stress–strain curves were determined using the knife-edge extensometer (25 mm) at a strain rate of ∼1 × 10⁻² s−1 at room temperature. The ultimate tensile strength (UTS, σb), 0.2% proof stress (YS, σ0.2), and elongation of the Nx0K-T6 alloys were obtained from these curves. For each alloy, the tensile properties are the average value of four tensile.
The LCF testing was performed on a servohydraulic Instron (8805) fatigue machine under a strain-control mode (push–pull (PP) triangular loading, R = −1, strain in the range from 0.2 to 0.8%, frequency of 1 Hz). For the samples tested at total strain amplitudes of 0.2 and 0.3%, the fatigue tests were converted to a stress-controlled model (PP triangular waveform R = −1, frequency of 30 Hz) after 10,000 cycles until they fractured or the fatigue lives exceeded 107 cycles. The HCF testing was carried out on a SincoTec MAG fatigue machine (SincoTec Innovationspark Tannenhöhe, Clausthal-Zellerfeld, Germany) under a PP sinusoidal waveform (stress ratio R = −1, frequency of 50 Hz).
C. Fractographic examination
The fracture surfaces of all fatigue samples were examined using a ZEISS EVO scanning electron microscope (SEM; Carl Zeiss, Oberkochen, Germany) attached with an energy dispersive spectroscope (EDS). The sizes of the grains located at the crack initiation region were considered as the equivalent initiation crack sizes. Some fatigue experiments were conducted to investigate the cyclic deformation behavior and crack initiation mechanism of the alloys. The tests were paused after selected numbers of cycles to investigate the evolution of the morphology of the specimen surface using the SEM.
III. DAMAGE TOLERANT-BASED LIFE MODEL
Details about the models suitable for predicting the fatigue characteristics of metals are shown as below. It is well known that the Coffin–Manson relation and Basquin laws, the three-parameter equation, and the energy-based concepts can only be used to predict the LCF lives of magnesium alloys. Reference Begum, Chen, Xu and Luo5,Reference Yu, Zhang, Jiang and Li21,Reference Park, Hong, Lee, Bang and Lee22 This is probably due to the fact that the crack propagation life occupies the most of the fatigue life in LCF regions. However, the developed MSF life models can be used to successfully predict both LCF and HCF lives of them. Reference Wang and Jones20 In HCF, the macroscopic deformation is elastic and thus the process of initiating a fatigue crack is dominant.
A. Coffin–Manson relation and Basquin laws
It is well known that the fatigue lives of metals are correlated with elastic, plastic, and total strain amplitudes. The total strain amplitude of metals can be described using the Coffin–Manson relation and Basquin laws as follows Reference Begum, Chen, Xu and Luo5 :
 $${{\Delta {\varepsilon _{\rm{t}}}} \over 2} = {{\Delta {\varepsilon _{\rm{e}}}} \over 2} + {{\Delta {\varepsilon _{\rm{p}}}} \over 2} = {{\Delta \sigma } \over {2E}} + {\left( {{{\Delta \sigma } \over {2K\prime }}} \right)^{1/n\prime }} = {{\sigma _{\rm{f}}^\prime \,{{\left( {2{N_{\rm{f}}}} \right)}^b}} \over E} + \varepsilon _{\rm{f}}^\prime \,{\left( {2{N_{\rm{f}}}} \right)^c}\quad ,$$
where Δσ, N
f, and E are the cyclic stress range, cycles to failure, and modulus of elasticity, respectively; Δεt/2, Δεp/2, and Δεe/2 are the total, plastic, and elastic strain amplitudes, respectively. The constants n′ and K′,
 $\sigma _{\rm{f}}^\prime$
and b,
 $\varepsilon _{\rm{f}}^\prime$
and c are the cyclic strain hardening exponent and cyclic strength coefficient, FS coefficient and FS exponent, fatigue ductility coefficient and fatigue ductility exponent, respectively.
B. A three-parameter equation
A three-parameter equation was reported to be able to predict the LCF lives of magnesium alloys by fitting the experimental data, Reference Yu, Zhang, Jiang and Li21
 $${\left( {{{\Delta \varepsilon } \over 2} - {\varepsilon _0}} \right)^\xi }\,{N_{\rm{f}}} = C\quad ,$$
where Δε/2 and N f are the strain amplitude and the number of cycles to failure, respectively. The constants ε0, ξ, and C are determined by best fitting the strain-life curve.
C. Energy-based concepts
Generally, the hysteresis energy significantly influences the LCF lives of magnesium alloys. Reference Lv, Yang, Li and Zhang24 Park et al. found that the strain-life curves of the magnesium alloys can be described using the plastic strain energy density, Reference Park, Hong, Lee, Bang and Lee22
 $$\Delta {W_{\rm{p}}} \cdot N_{\rm{f}}^m = C\quad ,$$
where N f and ΔW p are the number of cycles to failure and plastic strain energy density, respectively, and m and C are material constants. Considering the influence of mean stress, Eq. (3) can be modified as Reference Ellyin and Kujawski25
 $$\Delta {W_{\rm{t}}} \cdot N_{\rm{f}}^m = C\quad ,$$
where ΔW t = ΔW e + ΔW p. ΔW t and ΔW e are the total strain energy density and tensile elastic strain energy density, respectively.
D. MSF life models
It has been reported that the fatigue life of the peak-aged magnesium alloys depends mainly on the crack initiation from slip bands and propagation through cracked slip bands. Reference Li, Wang, Luo, Peng and Zhang9 Consequently, the fatigue life of the peak-aged alloys in this study can be predicted using the MSF models together with the grain size and tensile properties of the alloys. The fatigue life of the alloys can be expressed as Reference Wang and Jones20
 $$N = \left( {{C_1}{{\left( {\Delta \varepsilon _{{\rm{eq}}}^{\rm{p}}} \right)}^{ - g}}{{\left( {{d_{\rm{g}}}} \right)}^h} + {C_2}{{\left( {{\varepsilon _{\max }}{\sigma _{\rm{a}}}\sigma _{{\rm{ys}}}^{ - 1}} \right)}^n}{{\left( {{d_{\rm{g}}}} \right)}^q}} \right)\quad ,$$
where
 $\Delta \varepsilon _{{\rm{eq}}}^{\rm{p}}$
, σa, σys, εmax, and d
g are the local equivalent plastic strain, stress amplitude, YS, maximum total strain during loading cycle, and size of the grain acting as the crack initiation site, respectively; C
1, C
2, g, h, n, and q are the material-related constants.
IV. RESULTS AND DISCUSSION
A. Effect of Nd content on tensile and LCF behavior
1. Tensile properties
Table I shows the tensile properties of the peak-aged Mg–0.2Zn–0.5Zr alloys with different Nd additions. With the increase of the Nd content from 1.0 to 3.0%, the YS and UTS increase from ∼107 to ∼159 MPa and from ∼217 to ∼282 MPa, respectively, while the elongation decreases from ∼12.1 to ∼6.9%. Hence, the increase of the addition of Nd significantly improves the tensile strengths (both YS and UTS) but decreases the ductility of the alloy. The reason appears to be that with the increase of the addition of the Nd content, the β″ precipitates formed during aging increase. Reference Fu, Peng, Jiang, Chang and Zhai26
Grain size, tensile properties, and high-cycle fatigue properties of the NZx0K-T6 alloys.

2. Cyclic stress response
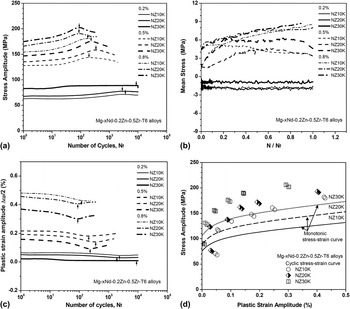
The evolutions of the cyclic stress amplitude with respect to the number of cycles for the NZx0K-T6 alloy are shown in Fig. 1(a), where the stress value increases with the increase of the applied strain amplitude. The stress amplitude in the NZx0K-T6 alloys first increases and then decreases with the increase of the number of cycles, especially at high strain amplitudes above 0.3%. For instance, at the applied stain amplitude of 0.5%, the maximum cyclic stress amplitude of the NZ10K, NZ20K, and NZ30K alloys are about 144, 159, and 175 MPa, which are 16, 24, and 28 MPa higher than the initial cyclic stress amplitudes at first cycle, respectively. The increased stress amplitude is probably attributed to the interactions among the dislocations, precipitates, grain boundaries, or twin grain boundaries, which impedes the motion of the dislocations. Reference Wang, Apelian and Lados27−Reference Wu, Zhu, Wang and Ji29 As an example, the strain-hardening behavior induced from twin deformation has been reported for cast AM50, AE44, and AJ62A magnesium alloys. Reference Xu, Gertsman, Li, Thompson and Sahoo30 After the stress amplitude achieved the maximum value, softening behavior in the NZx0K-T6 alloys is mainly caused by the sample surface crack initiation. The results in Fig. 1(a) also indicate that the cyclic stress amplitude of the NZx0K-T6 alloys increases with the increase of the Nd content. At the applied strain amplitude of 0.8%, with the Nd content increases from 1.0 to 3.0, the cyclic stress amplitude of the alloys increases from 181 to 202 MPa. For the peak-aged NZx0K alloy, the strain-hardening behavior mainly depends on the precipitates’ hardening and grain boundary constrains. The main effects of the Nd content on strain hardening are the degree of the interaction between dislocations, precipitates, and grain boundaries. The increased cyclic stress amplitude in the Mg–3Nd–0.2Zn–0.5Zr alloy with the highest Nd content are mainly attributed to the higher volume fraction and number density of β″ precipitates in grains.
(a) Variation of the stress amplitude with the number of cycles for the NZx0K-T6 alloys. (b) Variation of mean stress with a normalized cycle ratio for the NZx0K-T6 alloys. (c) Evolution of the plastic strain amplitude of the NZx0K-T6 alloys. (d) Monotonic and cyclic stress–strain curves of the NZx0K-T6 alloys obtained at a strain rate of 1 × 10⁻² s−1.

3. Mean stress
It has been reported that the mean stress significantly influences the LCF lives of magnesium alloys. Reference Lv, Yang, Li and Zhang24 Fig. 1(b) plots the mean stress of the NZx0K-T6 alloys (at strain amplitudes of 0.2, 0.5, and 0.8%) against the normalized cycle ratio (N/N f). Increasing total strain amplitude increases the mean stress of the alloys. At the lower strain amplitudes of 0.2 and 0.3%, the mean stress of the alloys remains almost constant until fatigue failure. With the strain value increasing to 0.5%, the mean stress of the alloys first increases and then decreases during cyclic deformation. The mean stress of the alloys tested at the highest strain value of 0.8% increases until failure. However, the influence of the Nd content on mean stress is very marginal. For instance, at the strain amplitude of 0.8%, additions of 1.0–3.0Nd correspond to the mean stress at the range of 4.37–4.58 MPa (minimum value) and 7.99–8.7 MPa (maximum value).
4. Cyclic strain resistance
The plastic strain value in the NZx0K-T6 alloys against the number of cycles is shown in Fig. 1(c). The result indicates that increasing the total strain amplitude increases the plastic strain amplitude of the alloys. For the NZx0K-T6 alloys, the plastic strain amplitude first decreases and then increases with the increase of the number of cycles, even more at high strain amplitudes above 0.3%. At the same strain amplitude, the plastic strain amplitude of the NZx0K-T6 alloys decreases with the increase of the Nd content. To compare the monotonic and cyclic strain-hardening behavior, Fig. 1(d) plots the monotonic tensile stress and cyclic stress with respect to plastic strain curves of the NZx0K-T6 alloys. The addition of the Nd element can significantly improve the tensile flow stress and cyclic stress of the alloys. For the alloys, the cyclic stress amplitude is apparently higher than the tensile stress, even more at higher applied strain amplitudes (>0.3%). This result indicates that the NZx0K-T6 alloys were hardened much more under fatigue than under tension. For instance, at the plastic strain amplitude of ∼0.146%, the cyclic stress of the NZ30K-T6 alloy is about 189 MPa, improved by 34%, in comparison with the flow stress of the alloy under tension (∼141 MPa).
B. Effect of Nd content on FS and life
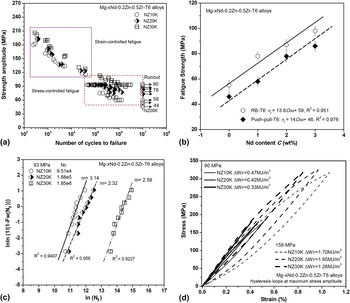
Figure 2(a) shows the relationships between the stress amplitude and the number of cycles to failure of the NZx0K-T6 alloys. The evolutions of the maximum cyclic stress value with respect to the cycles to failure of the alloys tested at strain-controlled loading were included for comparison. The limit FS (107 cycles) of the NZ10K-T6, NZ20K-T6, and NZ30K-T6 alloys is about 58 (±3.6) MPa, 78 (±4.2) MPa, and 90 (±3.8) MPa, respectively. Increasing the Nd content significantly increases the FS of the alloys. The alloys exhibit the similar ratio values of FS to YS (σf/σ0.2 ≈ 0.54–0.58) and ratio values of FS to UTS (σf/σb ≈ 0.27–0.32). The PP and RB (rotating bending) Reference Peng, Fu, Li, Wang and Jiang32 HCF strengths of the NZx0K-T6 alloys as a function of the Nd content are plotted in Fig. 2(b). With the best fit of the data in Fig. 2(b), the relationship between PP and RB FS (σf) of the NZx0K-T6 alloys and the Nd content (C Nd) can be expressed as
 $$\sigma _{\rm{f}} {\rm{\ }} \approx {\rm{\ }}14.0C_{{\rm{Nd}}} {\rm{\ }} + {\rm{\ }}46{\rm{\ }}\left( {{\rm{PP}},{\rm{\ }}R^2 {\rm{\ }} = {\rm{\ }}0.976 \right)\quad ,$$
 $${\sigma _{\rm{f}}}{\rm{\ }} \approx {\rm{\ }}13.8{C_{{\rm{Nd}}}}{\rm{\ }} + {\rm{\ }}59{\rm{\ }}\left( {{\rm{RB}},{\rm{\ }}{R^2}{\rm{\ }} = {\rm{\ }}0.976} \right)\quad .$$
(a) Stress-life curves of the NZx0K-T6 alloys. Maximum cyclic stress amplitudes for the alloys under strain-controlled loading were included for comparison. (b) Variation in RB strengths Reference Peng, Fu, Li, Wang and Jiang32 and PP FSs of the NZx0K-T6 alloys as a function of the Nd content. (c) Two-parameter Weibull plots for the fatigue life data of the NZx0K-T6 alloys. (d) Saturated stress–strain hysteresis loops taken at the different total strain amplitudes of 0.26% (NZ10K), 0.23% (NZ20K), and 0.2% (NZ30K) and 0.51% (NZ10K), 0.48% (NZ20K), and 0.39% (NZ30K), respectively.

The fatigue strengthening ratio of the NZx0K-T6 alloys is obtained for the Nd content ranges studied (for x between 0 and 3.0 wt%), i.e., K f ≈ 13.8–14.0 MPa (wt%)−1.
The Weibull plots in Fig. 2(c) show the effect of the Nd content on the fatigue life of the alloys. Reference Wang, Apelian and Lados27 The fatigue specimens shown in the plots were tested at the stress value of 93 MPa. With the addition of Nd increasing from 1.0 to 3.0, the characteristic fatigue life NC of the alloy increases from about 9.51 × 10⁴ cycles to 1.85 × 10⁶ cycles. Compared with the NZ10K and NZ20K alloys, the longer fatigue life observed in the NZ30K-T6 alloy is mainly resulted by the improved matrix strengths in the samples containing a higher Nd content. The more Nd additions correspond to the higher volume fraction of β″ precipitates in the peak-aged alloys, which leads to the increase of the matrix resistance to dislocation movement and formation of slip bands. Reference Li, Wang, Luo, Peng and Zhang9 As a result, increasing matrix strength in the alloys increases the resistances of the fatigue crack initiation and propagation.
It has been reported that hysteresis loops play an important role in the fatigue lifetime of magnesium alloys. Reference Lv, Yang, Li and Zhang24 To discern the effect of the hysteresis energy and Nd content on the fatigue lives of the alloys, a comparison of the stress–strain hysteresis loops is shown in Fig. 2(d). Reference Yu, Zhang, Jiang and Li31 The NZx0K-T6 alloy samples were tested at different strain amplitudes of ∼0.26% (90 MPa) and ∼0.51% (158 MPa) (for NZ10K), ∼0.23% (90 MPa) and ∼0.48% (158 MPa) (for NZ20K), ∼0.20% (90 MPa) and ∼0.39% (158 MPa) (for NZ30K), respectively. Compared with the NZ10K-T6 and NZ20K-T6 alloys, the NZ30K-T6 alloy exhibits the lower plastic hysteresis energy, corresponding to the lower fatigue damage and the longer fatigue lifetimes of the alloy.
C. Effect of Nd content on crack initiation mechanism
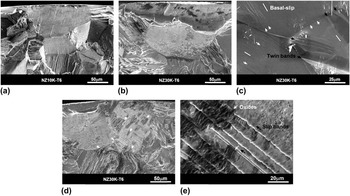
The peak-aged Mg–0.2Zn–0.5Zr alloys with different Nd contents exhibit a similar fatigue failure mechanism. The crack initiation behavior in the NZx0K-T6 alloys tested at PP loading mainly depends on the applied stress or strain amplitudes. In LCF tests (102 ∼ 105 cycles), the cracks in the samples mainly initiate at the sample free surfaces due to the intrusion/extrusion mechanism and cumulative damage [Figs. 3(a)–3(b)]. Reference Yue, Fu, Peng, Li, Pan and Ding33 To understand the plastic deformation behavior of the NZx0K-T6 alloys, the surface morphologies of the samples were observed in the SEM and the results are shown in Fig. 3(c). It was seen that an amount of basal slip bands and deformation twins formed on the surface grains. Twinning can accommodate the deformation due to tensile or compressive stress. Reference Wang and Huang34 However, the twinning-detwinning behavior cannot be detected in the NZx0K-T6 alloys during fatigue testing. With the number of cycles increasing to 105, the fatigue cracks originate mainly from the sample subsurface [Fig. 3(d)]. As shown in Fig. 3(e), some young oxide films have formed at the crack initiation region of these samples, which is mainly attributed to the interaction between the dislocations-slip and the environment. Reference Xu, Liu, Xu and Han35
SEM images showing crack initiation in the low-cycle fatigue specimens of the NZx0K-T6 alloys: (a) NZ10K and (b) NZ30K. (c) SEM images showing the surface morphologies of the NZ30K-T6 alloys during fatigue testing. Slip bands and twins are marked by the white and black arrows, respectively. (d) SEM image showing crack initiation in the high-cycle fatigue specimens of the NZ30K-T6 alloys. (e) High-magnification image of oxide films and slip bands.

D. Fatigue life prediction
1. Based on Coffin–Manson relation and Basquin laws or the three-parameter equation
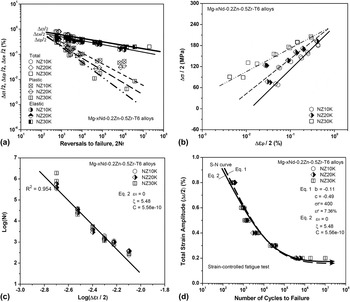
Figure 4(a) shows the variations of total, plastic, and elastic strain amplitudes with the cycles to the failure of the NZx0K-T6 alloys. Figure 4(b) plots the relationship between the plastic strain amplitude and stress amplitude of the alloys. By fitting the relationships between log(Δσ/2) and log(2N
f), log(Δσ/2) and log(Δεp/2), log(Δεp/2) and log(2N
f), log(Δεe/2) and log(2N
f), the LCF parameters of the peak-aged NZ10K, NZ20K, and NZ30K alloys were shown in Table II. For the NZx0K-T6 alloys tested at strain-controlled loading, the influence of the Nd content on the fatigue life is marginal. Therefore, the same parameters of the models can be used to predict the fatigue lifetime of the NZx0K-T6 alloys. The constants such as
 $\sigma _{\rm{f}}^\prime$
, b,
 $\varepsilon _{\rm{f}}^\prime$
, and c [in Eq. (1)] for the NZx0K-T6 alloys required for the calculation of the fatigue life were also obtained to be 400 MPa, −0.11, 7.36%, and −0.49, respectively. The constants such as ε0, ξ, and C [in Eq. (2)] for the NZx0K-T6 alloys are identified to be 0, 5.48, and 5.56 × 10⁻¹⁰, respectively, as shown in Fig. 4(c). Figure 4(d) compares the predicted fatigue life curves for the NZx0K-T6 alloy samples using the Coffin–Manson relation and Basquin laws [Eq. (1)], and the three-parameter equation [Eq. (2)] to the actual fatigue life, respectively. It can be seen that the calculated LCF life of the alloys is similar to the experimental test data. Therefore, Eqs. (1) and (2) can be used to predict the strain-life curves of the NZx0K-T6 alloys.
(a) Total strain fatigue life diagrams (Coffin–Manson and Basquin plots) for the NZx0K-T6 alloys. (b) Plot of Δσ/2 versus plastic strain amplitude Δεp/2 obtained from the data for different strain amplitudes. (c) Log total strain amplitude (Δεt/2) versus log number of the cycles (N f). (d) S–N curves of the NZx0K-T6 alloys together with the prediction using the Coffin–Manson relation and Basquin laws and a three-parameter equation.

Low cycle fatigue parameters of the NZx0K-T6 alloys.

2. Based on plastic strain or total strain energy density models
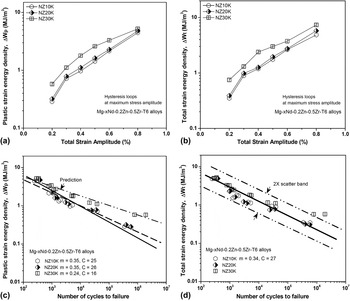
The plastic strain and total strain energy densities of the NZx0K-T6 alloys at the maximum stress amplitude in the total strain amplitude range from 0.2% to 0.8% are shown in Figs. 5(a) and 5(b), respectively. The plastic and total strain energy densities of the alloys increase with the increases in the hysteresis energies of the NZx0K-T6 alloys. For the same total strain amplitude condition, the hysteresis energies of the alloys also increase with the increase of the Nd content.
(a) The plastic strain energy density and (b) total strain amplitude energy density of the NZx0K-T6 alloys samples at total strain amplitudes of 0.2–0.8%. Life prediction with the energy-based models based on (c) a plastic strain energy density and (d) total strain energy density.

Figure 5(c) plots the fatigue life curves of the NZx0K-T6 alloys as a function of plastic strain energy density. The results indicate that the predicted fatigue lives based on Eq. (3) coincide better with the measured data. The comparison between the predicted fatigue lives of the NZx0K-T6 alloys using Eq. (4) and the experimental results is shown in Fig. 5(d). The constants m and C for the alloys are found to be 0.34 and 27 (MJ/m3), respectively. For the NZx0K-T6 alloys, the predicted data are consistent with the measurement results within in a 2X scatter band.
3. Based on MSF life models
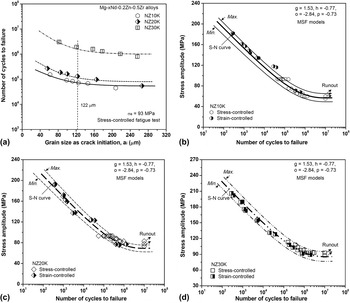
Figure 6(a) shows the influence of the sizes of the grains as crack initiation sites on the fatigue life of the NZx0K-T6 alloys tested at stress amplitudes of 93 MPa. Increasing grain sizes significantly decreases the fatigue life of the alloys. At the same grain size, the increase of the Nd content significantly increases the fatigue life of the alloys. For the NZx0K-T6 alloy, the minimum, characteristic, and maximum grain sizes are suggested to be about 40, 113, and 240 μm, respectively. In this work, the parameters of MSF life models (C 1 ≈ 16, g ≈ 1.53, h ≈ −0.77, C 2 ≈ 0.41, n ≈ −2.84, and q ≈ −0.73) obtained from the NZ30K-T6 alloy (grain size of 69 μm and YS of 147 MPa) Reference Li, Wang, Luo, Peng and Zhang9 were used to predict the fatigue life of the NZx0K-T6 alloys. For the magnesium alloys, the matrix strength and grain size significantly influence the fatigue crack initiation and propagation lives. Therefore, considering the influence of material properties (such as YS) and grain size, the total fatigue life of the NZx0K-T6 alloys is calculated by Eq. (7),
 $$\!\!\!\!N = \;\left( {{C_1}{{\left( {\Delta \varepsilon _{{\rm{eq}}}^{\rm{p}}} \right)}^{ - g}}{{\left( {{d_{\rm{g}}}} \right)}^h} + {C_2}{{\left( {{\varepsilon _{\max }}{\sigma _{\rm{a}}}\sigma _{{\rm{ys}}}^{ - 1}} \right)}^n}{{\left( {{d_{\rm{g}}}} \right)}^q}} \right) \times {\left( {\left( {{{{\sigma _{{\rm{ys}}}}} \mathord{\left/ {\vphantom {{{\sigma _{{\rm{ys}}}}} {{\sigma _{0.2}}}}} \right. \kern-\nulldelimiterspace} {{\sigma _{0.2}}}}} \right) \times \left( {{{{d_0}} \mathord{\left/ {\vphantom {{{d_0}} {{d_{\rm{g}}}}}} \right. \kern-\nulldelimiterspace} {{d_{\rm{g}}}}}} \right)} \right)^2},$$
where σ0.2 (147 MPa) and d 0 (69 μm) are the YS and grain size of the NZ30K-T6 alloy, respectively. Figures 6(b)–6(d) compare the measurement fatigue data with the fatigue life curves of the NZx0K-T6 alloys predicted using the MSF life models [Eq. (7)] together with the minimum, characteristic, and maximum values of grain sizes. By considering the distribution of grains, both LCF and HCF lives of the NZx0K-T6 alloys can be successfully estimated using Eq. (7).
(a) Fatigue lives of the NZx0K-T6 alloys, as a function of grains as crack initiation site. S–N curves of the Mg–xNd–0.2Zn–0.5Zr–T6 alloys together with the prediction of MSF life models using the grain sizes of minimum, average, and maximum as fatigue crack initiation sites: (b) NZ10K, (c) NZ20K, and (d) NZ30K.

The influence of the Nd content on the fatigue life of the NZx0K-T6 alloys tested at strain-controlled loading is small. In contrast, Nd addition significantly influences the fatigue life of the Mg–0.2Zn–0.5Zr alloy tested at stress-controlled loading. Therefore, among these life prediction models, the MSF life models can well capture the influence of Nd addition on fatigue.
V. CONCLUSIONS
-
(1) Addition of the Nd element significantly increases the YS, UTS, FS and cyclic stress amplitude of the Mg–0.2Zn–0.5Zr alloys. Good linear relationships in the NZx0K-T6 alloys have been established between the limit FS and Nd content as σf (T6) ≈ 13.8–14.0C Nd + 46 (for x between 0 and 3.0 wt%).
-
(2) The NZx0K-T6 alloys containing different Nd contents exhibit the similar grain size, mean stress, and cyclic deformation behavior. During fatigue testing, the NZx0K-T6 alloys show the strain hardening followed by cyclic softening behaviors, even more at higher strain amplitudes above 0.3%. The increased strengths and cyclic stress amplitude in the NZ30K alloy are mainly attributed to the higher volume fraction and number density of β″ precipitates in grains. Increasing the Nd content decreases the plastic amplitude of the NZx0K-T6 alloys.
-
(3) Nd addition cannot significantly influence the fatigue failure mechanism of the Mg–0.2Zn–0.5Zr alloys. The crack initiation behaviors of the alloys tested at PP loading mainly depend on the applied stress or strain amplitudes. In LCF, the fatigue cracks mainly initiate from the cracked PSBs, which depends on the intrusion/extrusion mechanism and cumulative damage. For the HCF samples, the fatigue failure is mainly attributed to environment-assisted cyclic deformation and damage.
-
(4) The LCF lives of the NZx0K-T6 alloys can be predicted using the Coffin–Manson law and Basquin equation, the three-parameter equation, or the energy-based concepts. The MSF life models can be used to predict both LCF and HCF fatigue lives of the NZx0K-T6 alloys. Among these models, the MSF life can well capture the influence of Nd addition on fatigue.
ACKNOWLEDGMENTS
This work was supported by the Project Funded by China Postdoctoral Science Foundation (2015M571562) and the Soft Science Project of Jiangxi Provincial Science and Technology Department (20161ACA10026). The authors are grateful to Prof. Qigui Wang (GM) and Prof. Alan A. Luo (Ohio State University), and Prof. Wenjiang Ding and Dr. Penghuai Fu (SJTU) for their helpful discussions.