INTRODUCTION
This paper advocates a new protocol for synthesizing multiple radiocarbon (14C) dates that utilizes a much wider range of 14C samples than currently accepted within strict applications of “chronometric hygiene.” Our approach is rigorously tested using independent chronological controls provided by ice-core dated tephrochronology.
The development of AMS 14C dating meant that very small samples can be analyzed which, combined with a lower unit cost, has resulted in the generation of very large datasets of individual age determinations relating to major historical (Bronk Ramsey 2010) and archaeological events, such as the colonization of large islands (Rieth et al. Reference Rieth, Hunt, Lipo and Wilmshurst2011; Williams Reference Williams2012; Rull Reference Rull2016). However, more dates do not necessarily result in improved clarity, as with a large dataset ambiguities can multiply with the production of significant numbers of anomalously younger and older dates. These anomalies may occur when samples are poorly provenanced, not directly related to the archaeological event of interest, have considerable inbuilt age, or reservoir offsets are unknown/variable (Bronk Ramsey Reference Bronk Ramsey2009a). Other outliers may have no obvious explanation for their status because, for example, they are not published with sufficient detail to evaluate these concerns or establish whether methodological protocols were appropriate (Millard Reference Millard2014; Bayliss Reference Bayliss2015; Wood Reference Wood2015).
These challenges were realized early in the history of radiocarbon dating (Waterbolk Reference Waterbolk1971), and in response numerous protocols have been developed to help evaluate the quality of 14C dates in large datasets, and to eliminate dates that are most likely problematic, a process which has been subsequently described as “chronometric hygiene” (after Spriggs Reference Spriggs1989). One of the early protocols used in the Pacific rejected large numbers of dates that were considered uncertain because of issues with stratigraphic and archaeological contexts and material types (Anderson Reference Anderson1991; Spriggs and Anderson Reference Spriggs and Anderson1993). Subsequently, this approach has been extended by other chronometric hygiene protocols that favor using only short-lived plant materials and terrestrial bone (e.g. Rieth et al. Reference Rieth, Hunt, Lipo and Wilmshurst2011; Wilmshurst et al. Reference Wilmshurst, Hunt, Lipo and Anderson2011). The number of different protocols has increased (e.g. Pettitt et al. Reference Pettitt, Davies, Gamble and Richards2003; Rodriguez-Rey et al. 2015) and each has been used to date colonization events. Significantly, the analysis has become increasingly selective and may reject up to 95% of available 14C dates (e.g. Rieth et al. Reference Rieth, Hunt, Lipo and Wilmshurst2011). Despite their foundation in sound theory, without independent tests we cannot know if these protocols are apt, too strict or too lax. We aim to test new outlier detection capabilities of the Bayesian software package OxCal (Bronk Ramsey Reference Bronk Ramsey2009a; Dee and Ramsey Reference Dee and Bronk Ramsey2014). In particular, we want to know if bone samples affected by marine reservoir effects (MRE), such as omnivorous animals and humans with marine diets (e.g. including marine mammals, fish, and shellfish) and seaweed-eating sheep in coastal areas can be utilized to obtain accurate analysis. If a greater range of samples can be used to create chronologies, synthesized dates may become more precise, and dating may be applied more widely, especially for questions relating chronology in coastal areas and on small oceanic islands.
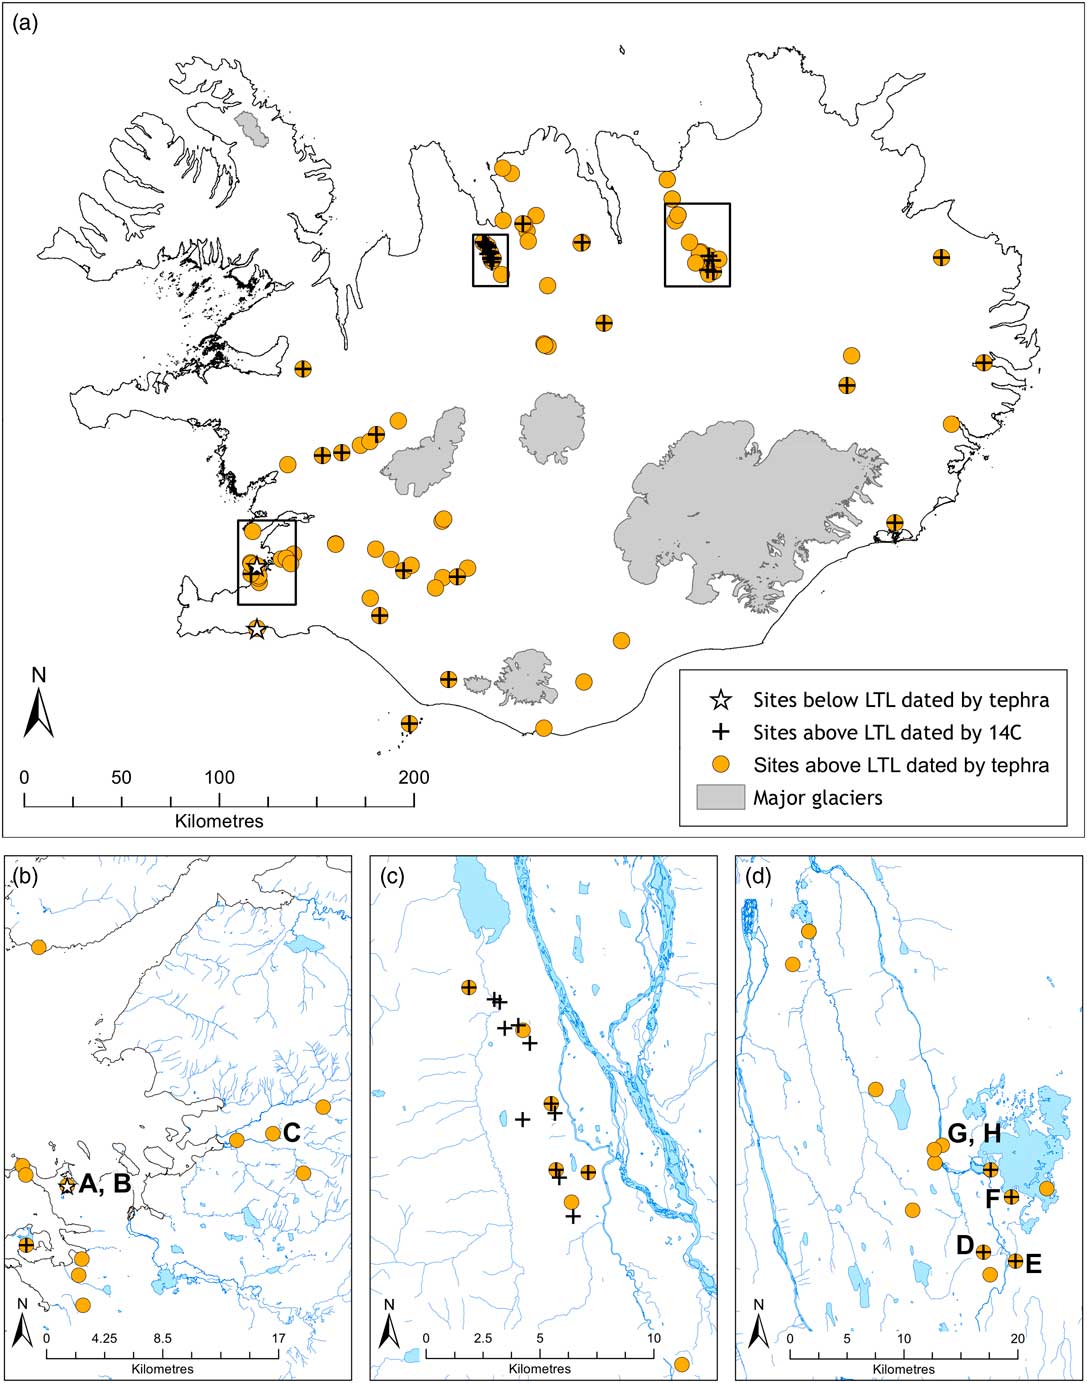
Iceland provides a remarkable opportunity to evaluate the utilization of large 14C datasets because 513 14C dates are related to the abrupt 9th century AD Norse colonization that can also be dated independently of the 14C method using an exceptional tephrochronology tied to dates from both medieval written sources and the Greenland ice cores. The crucial Landnám Tephra Layer (LTL) constrains the initial settlement of Iceland, is found across virtually the whole island, and has a combined ice-core date of AD 877±1 (Grönvold et al. Reference Grönvold, Óskarsson, Johnsen, Clausen, Hammer, Bond and Bard1995; Zilinski et al. Reference Zielinski, Germani, Larsen, Baille, Whitlow, Twickler and Taylor1997; Schmid et al. Reference Schmid, Dugmore, Newton and Vésteinsson2017a). While there is abundant archaeological evidence of settlement immediately above the extensive LTL on a countrywide scale, there are sparse anthropogenic activities below this isochron in the southwest of Iceland (Figure 1). Two turf-built enclosures or boundary walls are recorded just below this tephra demonstrating that people created shelters before this volcanic eruption (Jóhannesson and Einarsson Reference Johannesson and Einarsson1988; Roberts et al. 2003; Schmid et al. Reference Schmid, Zori, Erlendsson, Batt, Damiata and Byock2017b). Significantly, no 14C samples related to anthropogenic activities have been found below the LTL. Later tephra isochrons help to refine the rate and scale of Viking Age settlement: these include the ice-core dated Eldgjá tephra of AD 939 (Sigl et al. Reference Sigl, Winstrup, McConnell, Welten, Plunkett, Ludlow, Büntgen, Caffee, Chellman and Dahl-Jensen2015; Schmid et al. Reference Schmid, Dugmore, Newton and Vésteinsson2017a), the V-Sv tephra of AD 938±6 (Sigurgeirsson et al. Reference Sigurgeirsson, Hauptfleisch, Newton and Einarsson2013), whose age has been estimated from lacustrine sediment cores, and the historically dated Hekla tephra of AD 1104 (Þórarinsson Reference Þórarinsson1967). 73% of Icelandic 14C samples (n=377) are stratigraphically associated with widespread tephra isochrons.
The distribution of archaeological sites in stratigraphic relationships to the Landnám Tephra Layer (LTL) on a countrywide scale (a) and on a regional scale around Reykjavík (b), Skagafjörður/Langholt (c) and Mývatn (d). Two sites are below the LTL (stars) and 85 settlement sites (dots) as well as 181 related radiocarbon dates from 35 burial and settlement sites are above this tephra isochron (crosses). Archaeological sites that are discussed in this paper are: A. Reykjavík-Suðurgata, B. Reykjavík-Aðalstræti, C. Hrísbrú, D. Hrísheimar, E. Sveigakot, F. Skútusstaðir, G. Hofstaðir-pit house and H. Hofstaðir-hall.

Using Iceland as a world-class testing ground for developing 14C synthesis, our aim is to develop a robust and accurate protocol that can be applied to any colonization event and uses the largest number of 14C dates possible, including both charcoal samples and bone samples with known marine reservoir effects. This protocol systematically identifies outliers in large 14C datasets within a Bayesian framework using the software OxCal (Bronk Ramsey Reference Bronk Ramsey2017), as well as tests different priors in Bayesian statistical modeling.
METHODOLOGY
The Outlier Protocol
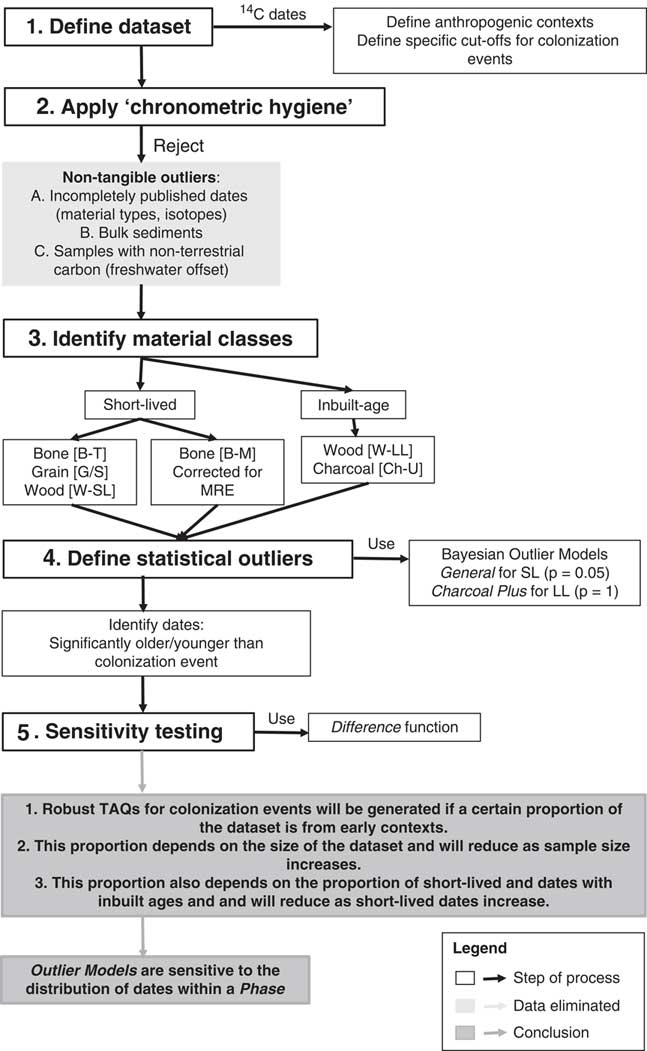
We have developed an outlier protocol that can be used to successfully estimate colonization events using small stratified and large unstratified 14C datasets. This protocol involves five steps that are summarized in Figure 2.
Outlier protocol for 14C datasets demonstrating the importance of stratigraphic relationships of 14C samples. Bayesian Outlier Models will be affected if “chronometric hygiene” protocols preferentially remove dates from early contexts. Key: B-M: Bone-Marine, B-T: Bone-Terrestrial, G/S: Grains/Seeds, LL: Long-Lived, MRE: Marine Reservoir Effect, SL: Short-Lived, W-SL: Wood-Short-Lived.

Step 1: Define dataset
The first step is to create a set of 14C dates in direct association with cultural materials that define colonization events. For instance, Wilmshurst et al. (Reference Wilmshurst, Hunt, Lipo and Anderson2011) included a wide range of 14C dates from 3000 to 300 14C years BP for the colonization of East Polynesian islands. In our example we used 18 independently dated tephra layers ranging from AD 877 to AD 1693 to define Viking-medieval period settlements and burials (Table 1). In Iceland, age estimates of tephra layers—independent of the 14C methods—utilize written sources, correlations with annually layered ice core records in Greenland, as well as annually-laminated lacustrine and aeolian sediment accumulation rates projected over decades (Schmid et al. Reference Schmid, Dugmore, Newton and Vésteinsson2017a). These various age estimates of tephra horizons vary in quality from written sources accurate to the hour, to natural archives with annual to multiannual uncertainties. We have used the following symbols in Table 1: “-” for historically dated tephra, “±” for age independent estimates in ice cores and “~” for estimates from sediment accumulation rates in different depositional environments.
Tephrostratigraphy in Iceland. The tephra layers are named after the volcanic source system and the eruption date in years AD. The volcanic source systems are: E: Eldgjá, G: Grímsvötn, H: Hekla, K: Katla, Ö: Öræfajökull, R: Reykjaneshryggur and V: Veiðivötn.

We have collected 513 14C dates that refer to Viking Age settlement and burials sites (AD ~800–1100) (see supplemental appendix). Some of the settlement sites are also from the transitional period following the Viking Age.
Step 2: Apply “chronometric hygiene”: Remove non-tangible outliers
The next step is to remove dates that cannot be confidently used for statistical analysis, as there is either a high probability that they are inaccurate, or their accuracy cannot be verified. Barrett and Lewis (Reference Barnett and Lewis1978:4) “define an outlier in a set of data to be an observation (or subset of observations) which appears to be inconsistent with the remainder of that set of data”. There are two types of outliers: “non-tangible” (non-statistical) and “statistical” (samples that are outlying in relation to probability models) (Barrett and Lewis Reference Barnett and Lewis1978). We define non-tangible outliers as:
1. Published data with insufficient documentation.
2. Bulk sediments.
3. Samples that have inbuilt ages from mixed dietary sources that cannot be adequately corrected.
Insufficient Sample Documentation
We have discarded from our analysis age estimates whose publication lacks sufficient metadata. For example, the material dated (e.g. charcoal, seed, bone) is not specified for three 14C dates in the Icelandic dataset. Knowledge of the material type is crucial for Bayesian Outlier analysis, as short-lived samples and samples with inbuilt ages are assigned different priors in the model (more information under step 4). Other critical information required for analysis includes stable isotopic data from bone samples, or other information necessary to assess collagen quality (e.g. collagen yield, C:N ratio) (n=26). Any samples lacking contextual data are labeled “insufficient metadata” and “insufficient documentation of isotopic composition” in the folder “non-tangible outliers” in the supplemental appendix (Table 2).
“Chronometric hygiene”: 513 14C dates and their reason for exclusion/inclusion in chronological models. Statistical outliers were identified using Agreement Indices (>60% cut off) and General Outlier Models.

Bulk Sediments
Bulk samples of sediments can contain carbon from multiple sources, with different 14C ratios to the event or context that they are intended to date. Three samples of bulk sediments are excluded from our dataset. They are labeled “bulk sediments” in the folder “non-tangible outliers” in the supplemental appendix (Table 2).
Reservoir Offsets
Bone samples whose δ13C values reflect wholly terrestrial atmospheric carbon sources, with no indication of significant admixtures of marine or geologically-derived carbon, are unlikely to have been influenced by any addition of “old carbon” from reservoirs and normally provide reliable 14C ages.
Organisms growing in ocean surface waters will produce anomalously old 14C ages because of marine reservoir effects caused by a delay in 14C exchange between the atmosphere and ocean, as well as by the mixing of surface waters with upwelled 14C-depleted deep ocean water (Struiver et al. Reference Stuiver, Pearson and Braziunas1986; Petchey et al. Reference Petchey, Anderson, Zondervatn, Ulm and Hogg2008). Organisms that derived some, or all, of their carbon from an oceanic reservoir will have been affected by this marine reservoir effect (MRE).
The “Marine13” calibration curve represents a global average of the ocean surface 14C, as it varies over time (Reimer et al. 2013). However, there are pronounced local deviations from this global average—known as ∆R (Stuiver et al. Reference Stuiver, Pearson and Braziunas1986). In the North Atlantic, for example, ∆R values show spatial and temporal variation (Ascough et al. Reference Ascough, Cook, Church, Dugmore, Arge and McGovern2006; Russell et al. Reference Russell, Cook, Ascough and Dugmore2010). A ∆R value of 111±10 14C years has been obtained from multiple paired measurements on terrestrial mammals and marine molluscs from Viking Age archaeological deposits in northern Iceland, and is used here (Ascough et al. Reference Ascough, Cook, Church, Dugmore, McGovern, Dunbar, Einarsson, Friðriksson and Gestsdóttir2007). Although 111±10 14C is currently the best estimate, Batt et al. (Reference Batt, Schmid and Vésteinsson2015) suggest it could be improved through evaluation of other parts in Iceland.
Omnivorous animals and humans can incorporate carbon from different reservoirs in their diet and may be affected by marine carbon, resulting in an overestimation of their true age (e.g. Arneborg et al. Reference Arneborg, Heinemeier, Lynnerup, Nielsen, Rud and Sveinbjornsdottir1999; Ascough et al. Reference Ascough, Cook, Hastie, Dunbar, Church, Einarsson, McGovern and Dugmore2011; Petchey et al. Reference Petchey2013). δ13C can be used to estimate percentage of marine contribution to the using linear interpolation, where values have been established for a 100% terrestrial and a 100% marine diet. For Iceland, the end points can be calculated using the linear regression calculation of Ascough et al. (Reference Ascough, Church, Cook, Dunbar, Gestsdóttir, McGovern, Dugmore, Friðriksson and Edwards2012), y=270.67 + 13.333x, where x is δ13C value and y is % marine contribution to diet. For the North Atlantic, the δ13C end values are typically set to –21.0‰ for a terrestrial diet and –12.5‰ for a marine diet (Arneborg et al. Reference Arneborg, Heinemeier, Lynnerup, Nielsen, Rud and Sveinbjornsdottir1999; Sveinbjörnsdóttir et al. Reference Sveinbjörnsdóttir2010), with an adjustment of +1‰ for trophic level shift (Ascough et al. Reference Ascough, Church, Cook, Dunbar, Gestsdóttir, McGovern, Dugmore, Friðriksson and Edwards2012). The percentage of marine diet can be included in OxCal using “Mixed curves” and “Delta_R” (∆R).
Freshwater reservoir effects (FREs) also occur when 14C-depleted carbon from reservoirs such as peat, old soils, or from geothermal activity is added to the freshwater system (Ascough et al. Reference Ascough, Cook, Church, Dunbar, Einarsson, McGovern, Dugmore, Perdikaris, Hastie, Friðriksson and Gestsdóttir2010). These reservoir effects are highly variable but can amount to many hundreds of 14C years within a single water body, and without extensive regional work, corrections are not possible (Sayle et al. Reference Sayle, Hamilton, Cook, Ascough, Gestsdóttir and McGovern2016). For example, modern fish from Lake Mývatn in the north of Iceland have 14C reservoirs of more than 3000 14C years, which vary by around 1500 14C years (Sayle et al. Reference Sayle, Hamilton, Cook, Ascough, Gestsdóttir and McGovern2016). Stable isotope analysis of individuals from the nearby cemetery of Hofstaðir suggests that although they ate just 5–6% freshwater resources, this would cause offsets of between 40 and 500 14C years (Sayle et al. Reference Sayle, Hamilton, Cook, Ascough, Gestsdóttir and McGovern2016). Given the current uncertainties involved in 14C dating of organisms that have consumed significant amounts of freshwater carbon around Lake Mývatn, 12 dates on shell, four on arctic char and 70 dates on human and animal bone have been excluded from this analysis. The samples are labeled “uncertain reservoir” in the folder “non-tangible outliers” in the supplemental appendix.
Step 3: Classify remaining samples according to potential inbuilt age
After having eliminated 118 non-tangible outliers, we categorized all samples according to material classes, for which we use three basic categories:
1. Short-lived taxa: grains, seeds, identified tree bark and twigs and bone samples where the δ13C values reflect a 100% terrestrial diet.
2. Samples with potential or actual inbuilt age: unidentified charcoal and identified heartwood of trees.
3. Bone samples that are affected by MRE with known ∆R.
Step 4: Apply Bayesian statistical modeling and define statistical outliers
Bayesian statistical modeling is now routinely used to analyze large sets of 14C dates (Bayliss Reference Bayliss2015). The Bayesian approach can be used to test hypotheses, emphasizing that the interpretation of the data is conditional on all of the chronometric information available. Posterior distributions are generated by modifying prior beliefs (e.g. from stratigraphy, assumptions over how outliers are distributed or how dates are distributed across a Phase) with likelihoods (the 14C dataset).
We used OxCal version 4.3.2 for our analysis (Bronk Ramsey Reference Bronk Ramsey2017). Here, all terms relating to OxCal are given in italics. We used both single-phase and multiple-phase models for our data. For single-phase models, the 14C dates are modeled as a Phase—an unordered group of events—bracketed by Boundaries, within a Sequence—an ordered group of events (Bronk Ramsey Reference Bronk Ramsey2009b). This model assumes that all dates are uniformly distributed between the two “start” and “end” Boundaries. It does not include any stratigraphic relationships between samples from the same site. Where sufficient numbers of radiocarbon dates (>10) were available from a single site, stratigraphic information could be incorporated in a multiple-phase model. The Boundary before the Phase provides an age estimate for colonization. These posterior distributions generate secure termini ante quos (TAQs) for archaeological events. 14C dates are calibrated using the “IntCal13” curve (Reimer et al. 2013) for the Northern Hemisphere and the “Marine13” curve (Reimer et al. 2013) for samples affected by MRE. Throughout the paper, we use both the 68% and 95% posterior distributions for Boundaries. We used Agreement Indices and Outlier Models to assess whether dates are statistical outliers within a model constructed in OxCal.
Agreement Index
Originally, models produced in OxCal relied on the Agreement Index values (“A” values) to objectively identify outliers. This index quantified the degree to which the data support the proposed model. Values of less than ca. 60% indicate a high likelihood (>95%) that there is a problem (Bayliss and Bronk Ramsey Reference Bayliss and Bronk Ramsey2004). Samples below this value were manually removed until the overall model had an “A” of >60% (Bayliss and Bronk Ramsey Reference Bayliss and Bronk Ramsey2004). This approach is time consuming when dealing with large datasets.
General Outlier Model
Bronk Ramsey (Reference Bronk Ramsey2009a) introduced a Bayesian outlier analysis approach, in which the model identifies and downweights dates that are inconsistent with the surrounding data. To do this the distribution of outliers must be described (the Outlier Model) and the prior probability of each sample within this Outlier Model assessed. For dates on short-lived materials, we use the General t-type Outlier Model, which assumes that outlying dates are due to movement between stratigraphic units, and are distributed according to Student’s T distribution (Bronk Ramsey Reference Bronk Ramsey2009a; Christen and Pérez Reference Christen and Pérez2009). This model is flexible and assumes that although most samples are not outlying a minority may be much too young or much too old. All short-lived materials were given a 5% prior probability of being an outlier within this distribution. The model generates a posterior outlier probability for each sample, and downweights the significance of the sample within the model accordingly. For example, a sample found to have an 80% chance of being an outlier will only be included in 20% of the model runs.
Charcoal Plus Outlier Model
Some 14C samples can have inbuilt ages, such as those derived from the heartwood of trees with a long-life span or any wood that was utilized long after its death. For example, the first people to settle islands may have burnt old wood from native trees or driftwood collected upon arrival (Sveinbjörnsdóttir et al. Reference Sveinbjörnsdóttir, Heinemeier and Guðmundsson2004). The Charcoal Outlier Model (Bronk Ramsey Reference Bronk Ramsey2009a; Dee and Ramsey Reference Dee and Bronk Ramsey2014), assumes that outliers are most likely to be too old due to their inbuilt age, and that they are derived from an exponential distribution. A small number of samples may be intrusive, and are drawn from an exponential distribution towards younger ages (the Charcoal Plus Outlier Model: Dee and Ramsey Reference Dee and Bronk Ramsey2014). In this model all dates are assigned a 100% prior probability of being an outlier, and the effect is to shift the posterior distribution towards younger ages.
Assess Statistical Outliers
Statistical outliers refer to dates that are outlying in relation to probability models. The Icelandic dataset has one clearly anomalous date (St-4192: 260±245 BP) and ten extreme outliers, of which two are exceptionally old (AA-55487: 5179±43 BP and AA-55488: 4110±700 BP) and eight exceptionally young (HAR-2093: 150±70 BP, U-4030: 305±100 BP, Beta-339966: 520±30 BP, TFG: 565±15 BP and U-2618: 685±110 BP; RKV-SUD U-2535: 810±70 BP, STG K-4488: 840±50 BP and STG K-5366: 800±50 BP). These samples are labeled “error” or “extreme outlier” in the folder “statistical outliers” (supplemental appendix).
We therefore conclude that 188 short-lived samples (37 short-lived wood, 34 grains/seeds, and 117 terrestrial bone), 147 samples with inbuilt age (120 long-lived wood, 27 unidentified charcoal) and 49 bone samples that are affected by MRE directly apply to the colonization of Iceland. These 384 samples are in the folder “potentially accurate dates” (supplemental appendix). All subsequent statistical analyses are based on this assumption.
Step 5: Analysis
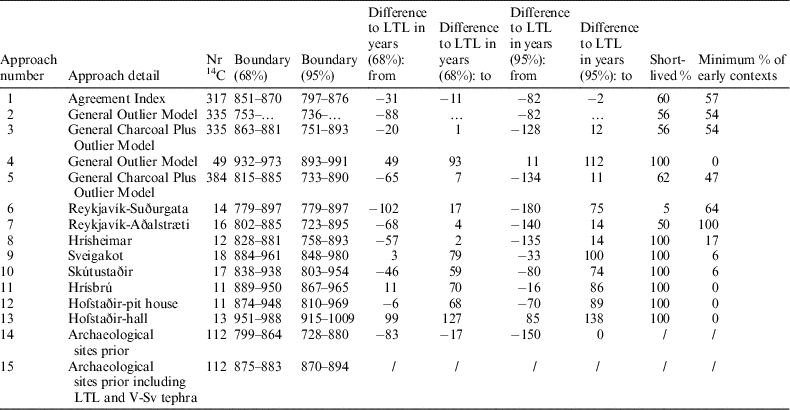
The Difference function was used to assess whether the Outlier Models affect the posterior estimate for the colonization of Iceland. We tested which approach is consistent with the independent tephrochronology using the Landnám Tephra Layer (LTL) of AD 877±1 (Schmid et al. Reference Schmid, Dugmore, Newton and Vésteinsson2017a). In order to be considered different, the Difference posterior probability range should not overlap with zero, and the function generates a colonization start posterior distribution either earlier or later than the LTL. The results are summarized in Table 3.
Sensitivity testing of single- and multiple-phase models from Iceland evaluating potentially accurate dates using the Agreement Index (>60% cut off), General Outlier Models and Charcoal Plus Outlier Models (greater than 6% outlying).

RESULTS
We built Bayesian models using both large unstratified and small stratified 14C datasets. The results are summarized in Table 3 and all OxCal model codes are available in supplementary materials.
Unstratified Radiocarbon Samples
Model 1: Agreement Index (n=335): The Agreement Index was used to assess whether any of the short-lived and charcoal samples were outliers. 18 samples, or 5% of the Icelandic dataset, had an Agreement Index <60% and were manually removed from analysis using the command Outlier() (Table 3). The 68% posterior distribution for the onset of colonization is estimated to cal AD 851–870, between 11 and 31 years earlier than the LTL.
Model 2: General Outlier Model (n=335): Each date was assigned an equal prior probability of 0.05 within the General Outlier Model. The 68% posterior distribution for the onset of colonization extends the range of the calibration curve (Table 3). Samples that were heavily downweighted in this model (assigned a posterior outlier probability of 6–100%) were also identified as outliers using the Agreement Index (Table 3).
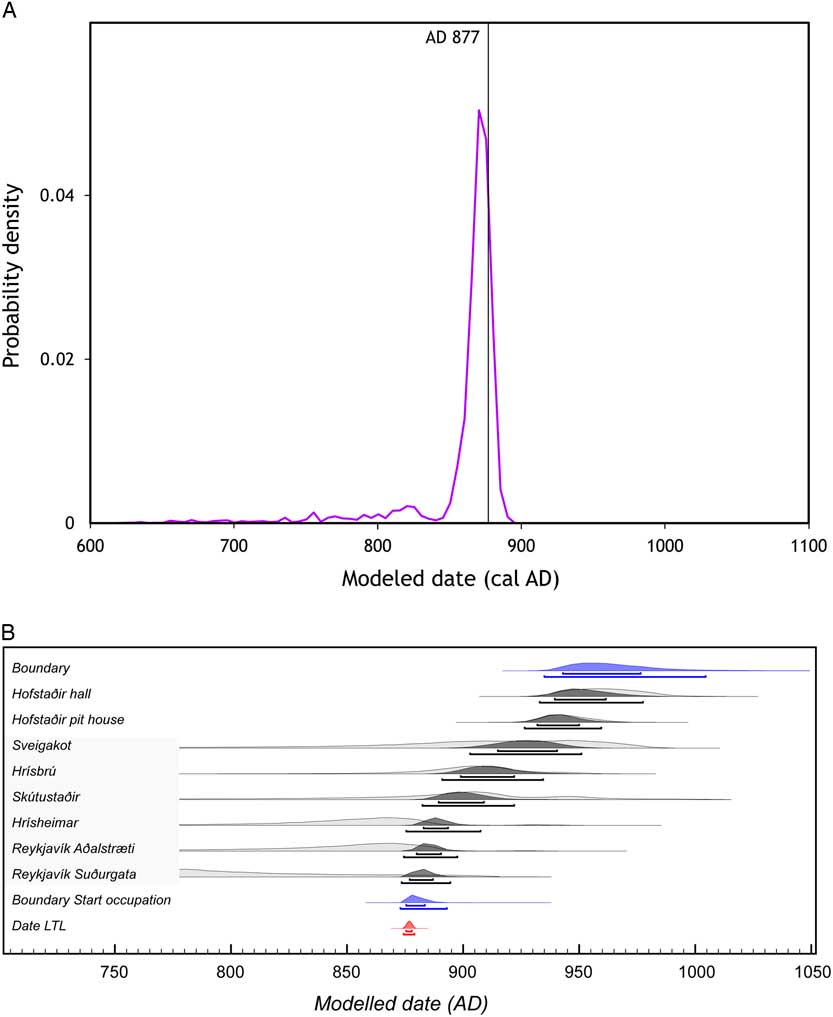
Model 3: General and Charcoal Plus Outlier Model (n=335): We performed analysis using the General Outlier Model for short-lived materials (0.05 prior probability) and the Charcoal Plus Outlier Model for charcoal samples (1 prior probability). The posterior distribution for the onset of colonization is estimated to cal AD 863–881 (68%) and to cal AD 751–893 (95%). These age ranges provide a TAQ for the colonization of Iceland consistent with ice-core dated tephrochronology: shortly before, but more likely after AD 877±1 (Figure 3A).
Estimated posterior distributions for the timing of Iceland’s colonization using unstratified (A) and stratified (B) datasets (95% probability curves). (A) The combination of 190 short-lived and 144 charcoal samples (n=335). (B) Multiple stratified 14C samples from eight archaeological sites (>10). The posterior distribution is constrained by the LTL to cal AD 874–883.

Model 4: Bone samples affected by MRE (n=49): We modeled 49 bone samples affected by MRE using the General Outlier Model. A 68% posterior distribution for the onset of colonization was generated to cal AD 932–973, demonstrating that burials in Iceland are mostly from the late Viking Age.
Model 5: General and Charcoal Plus Outlier Model (n=384): We combined all 384 samples. The posterior distribution for the onset of colonization is estimated to cal AD 815–885 (68%) and to cal AD 733–890 (95%) demonstrating that inclusion of the large number of younger dates on human bone decreases the precision of posterior colonization age estimate (in comparison with Model 3).
Stratified Radiocarbon Samples
Multiphase models were built for sites where more than ten 14C dates on stratigraphically related samples were available. This approach allows us to determine if samples for dating are likely to be in situ, and if there is an “old wood” problem. It removes difficulties encountered where large numbers of dates fall towards the end of a long single Phase (as seen when many relatively young dates on human bone were included in Model 5). Six archaeological sites are stratigraphically above the LTL of AD 877±1 (Reykjavík-Suðurgata, Reykjavík-Aðalstræti, Hrísheimar, Hrísbrú, Skútustaðir, Sveigakot) while two are above the V-Sv tephra of AD 938±6 (Hofstaðir-pit house and Hofstaðir-hall). The estimated Boundaries for the start of occupation of each site are shown in Figure 3B and in Table 3.
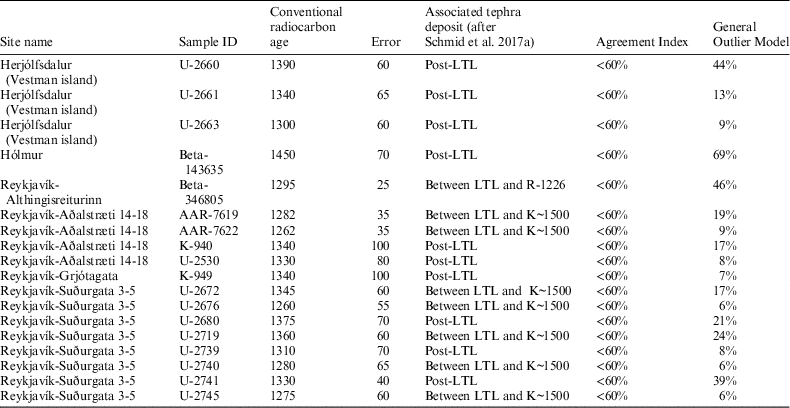
Model 6: Reykjavík-Suðurgata (n=14): The site consists of a hall and a smithy built over an activity area which had come into use after the deposition of the LTL. At least four phases of structures were built on top of these remains, before K~1500 blanketed the site (Nordahl Reference Nordahl1988). We excluded samples that are statistical outliers (Table 4). One of the samples used in the model is of short-lived taxa and 13 are charcoal samples. Nine charcoal samples are from early contexts (equivalent to 64% of the whole dataset). The 68% posterior distribution is estimated to cal AD 779-897, immediately after the LTL. We demonstrate that a high proportion of charcoal samples can be used in chronological models (here 95%).
Identified outliers using the Agreement Index (18 samples) and General Outlier Model (21 samples). Outliers identified in Bayesian models using the Agreement Index are below 60%, while outliers identified in General Outlier Models are between 6 and 100% outlying (posterior probability).

Model 7: Reykjavík-Aðalstræti (n=16): The site consists of a hall that was built on top of the LTL. The K~1500 was deposited long after the hall was abandoned (Sveinbjörnsdóttir et al. Reference Sveinbjörnsdóttir, Heinemeier and Guðmundsson2004). We excluded samples that are statistical outliers (Table 4). Eight samples included in the model are short-lived and eight are charcoal samples. Six samples come from floor and ten from stratified hearth deposits inside the hall. Both deposits are likely contemporary and represent early settlement (equivalent to 100% of the whole dataset). The 68% posterior distribution is estimated to cal AD 802–885, immediately after the LTL. The charcoal samples are consistently older than short-lived materials, but their age offsets are successfully corrected.
Model 8: Hrísheimar (n=12): The site consists of excavated structures and midden deposits (Vésteinsson and McGovern Reference Vésteinsson and McGovern2012). Two pit houses and midden deposits are sandwiched between the LTL and V-Sv, while hall structures were built after the deposition of the V-Sv. The model consists of 12 short-lived samples. Two samples come from stratified midden deposits before the V-Sv tephra (equivalent to 17% of the whole dataset), six after this tephra deposit and four are not connected to any tephra layer. The 68% posterior distribution is estimated to cal AD 828–881, immediately after the LTL.
Model 9: Sveigakot (n=18): The site consists of several pit houses, a byre and a hall, as well as extensive midden deposits (Vésteinsson Reference Vésteinsson2010). The model consists of 18 short-lived materials. One sample is from a midden deposit stratigraphically below the V-Sv tephra (equivalent to 6% of the dataset), five samples above the V-Sv tephra (midden and hall) and 12 are from pit houses that are not connected to tephra deposits. The 68% posterior distribution is estimated to AD 884–961, or between 3 and 79 later than the LTL (Table 3). The 95% posterior distribution, however, is estimated to cal AD 848–980 and is consistent with the LTL. The 68% posterior distribution is slightly later than the LTL, because the 14C samples are from mid-end 10th century contexts and do not relate to the actual arrival date associated with this initial colonization. Nevertheless 3–79 years are still early in terms of colonization and not every site will have been occupied immediately after the deposition of the LTL.
Model 10: Skútustaðir (n=17): The site consists of a farm mound with several structures and well-stratified midden deposits (Hicks et al. Reference Hicks, Friðriksson and Snæsdóttir2013). The middens began to form immediately on top of the LTL and accumulation has persisted until modern times. The model consists of 12 short-lived samples. One 14C sample is below the V-Sv tephra (equivalent to 6% of the whole dataset), 12 samples are above the V-Sv tephra and four samples are not associated with any tephra layer. The 68% posterior distribution is estimated to cal AD 838–938, consistent with the LTL.
Model 11: Hrísbrú (n=11): The site consists of a hall, midden deposits, a church and multiple burials. The model consists of 11 stratified samples, of which 10 are short-lived and one charcoal sample. Although anthropogenic deposits are stratigraphically above the LTL, all 14C samples are from contexts that also post-date a 10th century tephra (either K~920 or Eldgjá) (Schmid et al. Reference Schmid, Zori, Erlendsson, Batt, Damiata and Byock2017b). Four samples are from upper floor layers under a turf collapse (representing the latest use of the house) and another four samples come from midden deposits on top of the hall. One sample is from the church, which was built after the deposition of a 10th century tephra and two samples are from midden deposits which predate the construction of the church. The 68% posterior distribution is estimated to cal AD 889–950, or between 11 and 70 years later than the LTL; the 95% posterior distribution, however, is estimated to cal AD 867–965 and is consistent with the LTL (Table 3). This 68% posterior distribution is slightly later than the LTL because all 14C samples are from mid-end 10th century contexts (like Model 9) and do not relate to the actual arrival date associated with this initial colonization.
Model 12: Hofstaðir-pit house (n=11): The site consists of a pit house infilled with stratified midden deposits. The pit house is sandwiched between the V-Sv and H-1104 tephras (Lucas Reference Lucas2009). The site consists of 11 short-lived samples. One sample is from the turf collapse of the pit house, the rest are from the midden layers. The 68% posterior distribution is estimated to cal AD 874–948 and consistent with the LTL, and also with the V-Sv tephra.
Model 13: Hofstaðir-hall (n=13): The site consists of a hall with annexes that are sandwiched between the V-Sv and H-1104 tephras (Lucas Reference Lucas2009). The samples are from floor layers and from the turf collapse on top of the floor. The model consists of 11 short-lived materials and none are from early settlement contexts. The posterior distribution is estimated to cal AD 951–988 (68%) and to cal AD 915–1009 (95%), or up to 127 years later than the LTL (Table 3). This posterior distribution is, however, consistent with the V-Sv tephra, which is not surprising, because the 14C samples come from mid-end 10th century contexts.
We then combined the posterior distributions produced above to determine the most likely timing of overall colonization. This approach can also be used for comparing posterior distributions and determining the spatiotemporal relationships between archaeological sites across the country.
Model 14: Priors of archaeological sites: Eight archaeological sites yielded an age range of cal AD 799–864 (68%), or between 17 and 83 years earlier than the LTL; the 95% posterior distribution, however, is estimated to cal AD 728–880 and is consistent with the LTL (Table 3).
Model 15: Priors of archaeological sites including LTL and V-Sv tephra: We can constrain the same dataset (Model 14) when we include the LTL as Calendar Date (C_Date). The tephra layers constrain the posterior distribution to cal. AD 875–883 (68%) and to cal AD 870–894 (95%); however, this model can only be applied in geographic areas where tephra layers exist (Figure 3C).
DISCUSSION
Using the colonization of Iceland as a critical test of 14C methodology, we find that stratified archaeological sites with more than 10 14C samples provide an age estimate for colonization, which is consistent with ice-core dated tephrochronology, and thus deemed accurate, providing that appropriate prior assumptions are used and the distribution of 14C dates through the Phase is uniform. As such, General Outlier Models could be used with confidence to create chronologies from multiple 14C dates on short-lived plant materials, terrestrial bone, and bone affected by marine reservoir effects. Charcoal Plus Outlier Models can be used with confidence for synthesizing sets of 14C dates based on wood/charcoal with inbuilt age. Furthermore, our new assessments have demonstrated that Bayesian models are sensitive to the uniform prior assumption. First, the inclusion of the large number of younger dates decreases the precision of posterior colonization age estimate (e.g. Model 5), because there is a comparable lower density of data towards the start of a Phase (in comparison to Model 3). Second, if dates from early contexts are removed, the posterior colonization age estimate will most likely underestimate early human activity (Models 4, 9, and 11).
The dating of island colonization in Oceania has undergone radical reassessment since the 1980s (Dye Reference Dye2015). These cases exemplify critical debates about colonization and chronology all over the world. Competing “long” and “short” chronologies of island settlement have been proposed that are based on selective 14C datasets, which have been filtered using differing chronometric hygiene protocols. In this paper, we show that a new outlier protocol can provide a reduced need for the initial rejection of 14C dates compared to previous protocols. We argue that it is preferable to only exclude a minimum number of samples, where key information about context, sample type and pretreatment quality is unpublished, or where it is very likely that accuracy is poor e.g. for sediment or bone affected by a FRE. On this basis, 129 out of 513 samples (25%) were removed from analysis. We note that some of the samples may have potential to be used for future studies, if additional metadata is forthcoming.
Elsewhere, we (Schmid et al. Reference Schmid, Dugmore, Foresta, Newton, Vésteinsson and Wood2018) have reviewed the 14C data from 15 archipelagos in East Polynesia (published in Wilmshurst et al. Reference Wilmshurst, Hunt, Lipo and Anderson2011). While independent dating control is generally absent in Oceania, the North island of New Zealand is an exception. Here, environmental impacts and human activities first occur just below the Kaharoa tephra isochron, which is 14C-dated to cal AD 1314±12 through the use of wiggle matching (Hogg et al. Reference Hogg, Higham, Lowe, Palmer, Reimer and Newnham2003). We have synthesized 265 14C dates using a combination of short-lived plant materials, terrestrial bone, and (un-)identified charcoal and generated a posterior distribution for colonization of cal AD 1260–1314 (68%), which is consistent with the stratigraphic distribution of palaeoenvironmental evidence related to the Kaharoa isochron. Both in Iceland and East Polynesia, the inclusion of a wider range of 14C samples in Bayesian models improves the precision of the combined age determination. Significantly, the inclusion of tephra layers in chronological models does not affect the accuracy of the model outcome (e.g. Model 15). Thus, we find that our chronometric hygiene protocol may be usefully applied elsewhere and in areas where tephra isochrons are absent. The utilization of a wide range of samples benefits chronological models, because it most likely captures initial phases of settlement, enhances precision and dating can be applied more widely, especially relating to the chronology in coastal areas and on small islands.
CONCLUSION
This study uses a clearly defined and independently dated archaeological event—the initial human colonization of Iceland—to evaluate the best ways to assess small stratified (>10) and large unstratified (>335) 14C datasets based on the analysis of different materials, and to identify the most parsimonious exclusion of dates from synthesis. We demonstrate that, when combined with appropriate priors in Outlier Models within OxCal, 14C dates on the majority of sample types, most notably charcoal with its potential inbuilt age and samples affected by marine reservoir effects, can be used in chronological models. At present, dates produced on samples with insufficient metadata (e.g. no published record of material types or stable isotope values) or samples affected by unknown freshwater reservoir effects cannot be used. This result is important because it shows that a greater range of materials than currently accepted might be used with confidence for 14C analysis provided that certain conditions are met including the dissemination of contextual data (including detailed sample metadata), which have to be fully published.
ACKNOWLEDGMENTS
We thank Michael Dee for advice about the Charcoal Plus Outlier Model as well as Fiona Petchey, Matthew Spriggs, and April Cots for helpful discussions on earlier drafts of this manuscript. This project was funded by the Icelandic Centre for Research (Rannís, 121153-0061), the Watanabe Trust fund and the National Science Foundation (USA, NSF 1202692 and NSF 1249313).
Supplementary material
To view supplementary material for this article, please visit https://doi.org/10.1017/RDC.2018.129