Introduction
The granting of Plant Breeders' Rights for new potato varieties is determined by Distinctness, Uniformity and Stability (DUS) testing for a minimum of 2 years, according to UPOV guidelines (UPOV guideline TG/23/6; Cooke, Reference Cooke1999). These tests are based on the comparison of the morphological and physiological characteristics of a proposed new variety with those of officially registered and common knowledge varieties. Many of these characteristics are quantitatively expressed but are subjectively assessed, thus leading to potential differences amongst assessors. In addition, the characters may be influenced by environmental factors, leading to differences in results between test centres. The recent expansion of the European Union has resulted in over 1000 varieties being listed on the EU Common Catalogue. This figure is likely to rise each year. It is clearly impractical for test centres to maintain living collections of all these varieties and those of common knowledge for comparative purposes.
Currently, varietal identification is primarily made by means of characteristics of sprouts produced under very low light intensity (Houwing et al., Reference Houwing, Suk and Ros1986). This test can take up to 3 months and can still be insufficiently discriminative for an unequivocal identification, thus necessitating growing trials and phenotypic assessments. The need for a rapid and reliable method for differentiation and identification of potato varieties is, therefore, becoming increasingly more urgent as an aid to DUS testing, maintenance of variety collections and incorrect labelling of varieties for sale for consumption (Anon., 2003a, b; Davey, Reference Davey2004).
Molecular taxonomic methods, which analyse the DNA of biological material, are not prone to phenotypic differences resulting from changes in growing conditions or from different assessors, and have the additional advantages that they are rapid and any part of the plant can be used for analysis. Numerous methods have been investigated for varietal differentiation including restriction fragment length polymorphism (RFLP; Görg et al., Reference Görg, Schachtschabel, Ritter, Salamini and Gebhardt1992), randomly amplified polymorphic DNA (RAPD; Demeke et al., Reference Demeke, Kawchuk and Lynch1993; Hosaka et al., Reference Hosaka, Mori and Ogawa1994; Sosinski and Douches, Reference Sosinski and Douches1996; Isenegger et al., Reference Isenegger, Taylor, Ford, Franz, McGregor and Hutchinson2001), amplified fragment length polymorphism (AFLP; Kim et al., Reference Kim, Juong, Kim and Lim1998), inter-simple sequence repeats (ISSR; Bornet et al., Reference Bornet, Goraguer, Joly and Branchard2002) and simple sequence repeats (SSR; Kawchuk et al., Reference Kawchuk, Lynch, Thomas, Penner, Sillito and Kulcsar1996; Corbett et al., Reference Corbett, Lee, Donini and Cooke2001; Norero et al., Reference Norero, Malleville, Huarte and Feingold2002; Coombs et al., Reference Coombs, Frank and Douches2004; Ghislain et al., Reference Ghislain, Spooner, Rodríguez, Villamón, Núñez, Vásquez, Waugh and Bonierbale2004). Combinations of several of these techniques have also been trialled (Milbourne et al., Reference Milbourne, Meyer, Bradshaw, Baird, Bonar, Provan, Powell and Waugh1997, Reference Milbourne, Meyer, Collins, Ramsey, Gebhardt and Waugh1998; McGregor et al., Reference McGregor, Lambert, Greyling, Louw and Warnich2000). Many of these studies examined either small numbers of varieties, large numbers of markers or were primarily concerned with mapping of the potato genome. Of all of the above methods, sequence tagged microsatellite (STM), sometimes known as SSR markers, have proved to be highly efficient for the rapid differentiation of potato varieties (Ghislain et al., Reference Ghislain, Spooner, Rodríguez, Villamón, Núñez, Vásquez, Waugh and Bonierbale2004). The purpose of this study was to develop and validate a straightforward system based on SSR markers to support the DUS work conducted at the Scottish Agricultural Science Agency (SASA). This involved the determination of a minimum set of markers to achieve differentiation within ca 400 varieties from the SASA potato variety collection.
Materials and methods
Plant material and DNA extraction
All potato varieties for testing were obtained from the SASA variety collection, either as leaf, tuber or sprout tissue. When available, DNA was extracted and analysed from more than one sample of a variety, to check there were no intra-varietal admixtures. Genomic DNA was extracted by grinding samples in liquid nitrogen and incubating approximately 0.1–0.3 g of the resulting powder in 1 ml GeneScan lysis buffer (Adgen Ltd) at 65°C for 1 h to which was added 200 μg/ml Proteinase K and 30 μg/ml RNAse A (both from Sigma). The resulting samples were extracted with chloroform and the DNA precipitated with propan-2-ol, washed twice with 70% ethanol and re-suspended in distilled water.
SSR analysis
Amplification of all SSR regions was carried out using 10 ng of purified DNA in a reaction volume of 10 μl with AmpliTaq Gold (0.5 units) and a final MgCl2 concentration of 2.5 mM, 1 mM dNTP blend (all Applied Biosystems) and 1 pmol each of forward and reverse primers. Forward primers were fluorescently labelled (Applied Biosystems), reverse primers were synthesized by MWG Biotech and included a 5′ pig-tail sequence of TTCTTTG (Brownstein et al., Reference Brownstein, Carpten and Smith1996) to reduce +A effects. Markers were chosen by screening a selection of markers from a list of over 200 produced by the Scottish Crop Research Institute (SCRI) (Milbourne et al., Reference Milbourne, Meyer, Collins, Ramsey, Gebhardt and Waugh1998; Ghislain et al., Reference Ghislain, Spooner, Rodríguez, Villamón, Núñez, Vásquez, Waugh and Bonierbale2004): the markers used in this study were STM1024, STM2022, STM2028, STM3012, STM5136 and STM5148. Amplifications were carried out in an ABI 9700 thermocycler (Applied Biosystems) using the following conditions, 94°C for 9 min, followed by 30 cycles of 94°C for 1 min, 50°C for 1 min, 72°C for 1 min, with final hold steps of 60°C for 30 min and 25°C thereafter. After amplification, fragments were separated on an ABI 3100 Genetic Analyzer (Applied Biosystems). Electrophoresis conditions were default values for a 36 cm capillary array and POP-4 polymer. The size standard used was the GS500 LIZ marker from Applied Biosystems. After electrophoresis, fragment sizes were determined using GeneScan Analysis v3.7 (Applied Biosystems). Allele sizes were stored as binary data in a BioNumerics v3.5 (Applied Maths) database. Cluster analysis was carried out using the Dice coefficient and unweighted pair-group method of arithmetical means (UPGMA) options in BioNumerics on the combined data for all six markers. The polymorphism information content (PIC) values were calculated based on the allelic phenotypes (or numbers of different profiles obtained) for each marker for varieties on the 2004 UK National list using PIC = 1 − Σ(pi)2, where pi is the frequency of the ith allelic phenotype detected (Nei, Reference Nei1973).
Results
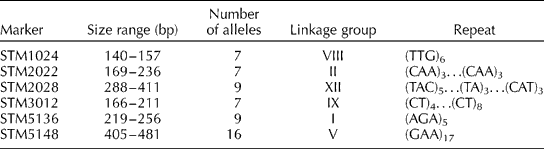
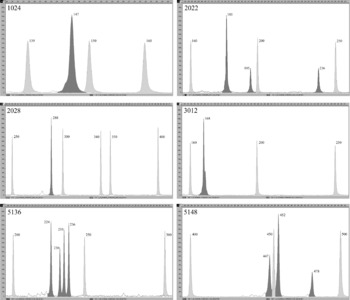
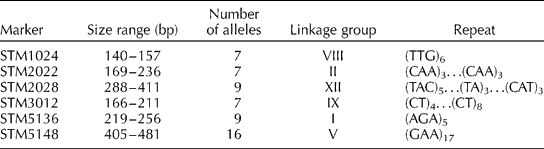
In an initial screen, 28 markers were tested against 12 potato varieties and 12 were chosen which exhibited the key characteristics conferring ease of analysis. These criteria were good peak height and morphology, minimal stutter, stability across a range of amplification conditions, distribution throughout the genome and production of polymorphic alleles. The 12 markers were then tested against 96 varieties, before selecting a final set of six markers (Table 1). These six markers fulfilled the criteria stated above as each yielded at least seven alleles and could also be used under identical amplification conditions. The clear peak morphology for each marker is shown in Fig. 1 for var. Dunbar Standard. To date, a total of 55 alleles have been detected from over 400 potato varieties which have been grown commercially. All of these varieties could be differentiated with the exception of somaclonal variants of an existing variety.
The final six sequence-tagged microsatellite markers used for potato variety identification at SASA (the size range for each marker was obtained from data from over 400 varieties)
Example microsatellite traces for the six markers used in this study (STM1024, STM2022, STM2028, STM3012, STM5136 and STM5148) generated from the variety Dunbar Standard. The peaks with the dark shading are the SSR alleles and the lightly shaded peaks are molecular size standard peaks. Each panel is scaled to encompass the entire range for that marker. Sizes of peaks are shown in base pairs.

The validity of the system was tested in two ways. First, reproducibility was examined by analysing DNA extracted from 30 individual plants of var. Arran Comet, all of which gave identical results for each of the six markers (data not shown). Second, tests were carried out on 10 coded samples of varieties from the SASA variety collection which had previously been tested. The resulting allele scores were screened against the reference library of known varieties in the BioNumerics database and, in each case, the identification matched the variety.
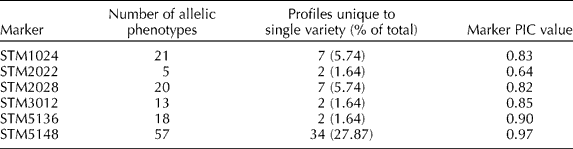
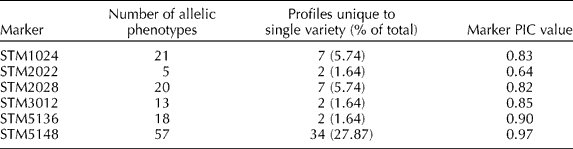
An analysis was then made of 400 varieties including 121 of those on the 2004 UK National List (varieties eligible for certification and marketing as seed potatoes in the UK). The numbers of allelic phenotypes (or different SSR profiles) varied from five to 57, for STM2022 and STM5148, respectively (Table 2). Although STM2022 gives fewer allelic phenotypes than the other markers it was necessary for differentiating some varieties, hence its inclusion. Each of the markers yielded profiles which were unique to a single variety. The frequencies of these unique profiles varied from marker to marker, STM2022, STM3012 and STM5136 each yielded two unique profiles, STM1024 and STM2028 had seven each while STM5148 gave 34. These data are reflected by the PIC values which varied from 0.64 (for STM2022) to 0.97 (for STM5148) with most in the 0.80–0.90 range. All six markers are not required to separate the varieties on the UK National List as it is possible to differentiate them on the basis of only four markers (STM2028, STM3012, STM5136 and STM5148, data not shown).
Marker information for varieties on the 2004 UK National List (the marker PIC values are calculated from the allelic phenotypes)
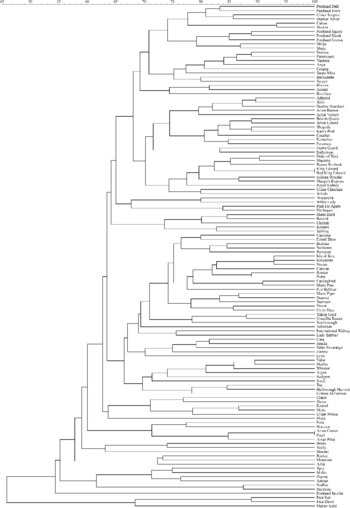
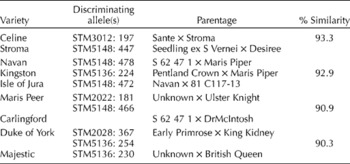
Within the National List, there are four groups (excluding two pairs of somaclonal variants: vars Red King Edward/King Edward and Pearl/Arran Comet) which have greater than 90% similar (Fig. 2). The two varieties with the greatest similarity, Celine and Stroma (93.3%), differ by two alleles (Table 3). Stroma is one of the parent varieties of Celine. Similarly, the next highest similarity group, containing the varieties Navan, Kingston and Isle of Jura (92.2%), also have shared ancestry. Navan and Kingston both have Maris Piper as one of their parents and Navan is a parent of Isle of Jura. The final two groups with a similarity greater than 90% (Carlingford/Maris Peer and Duke of York/Majestic) would appear to have no common ancestors although, in both cases, one of the four parents is unknown. The Maris Peer and Carlingford pairing is unusual as all of the alleles found in the latter are present in var. Maris Peer. However, var. Maris Peer has two extra alleles, thus allowing the varieties to be differentiated.
Cluster analysis of 121 varieties on the 2004 UK National List constructed by UPGMA analysis of the combined data yielded by the six markers. The scale is % similarity.

Groups of varieties on the 2004 UK National List yielding greater than 90% similarity

Discriminating allele(s) show the marker and allele present which can be used to differentiate one variety from the other(s) in the grouping. Data for the parent lines were obtained from www.europotato.org.
Three varieties (Inca Sun, Inca Dawn and Mayan Gold) form a sister clade to the other varieties on the UK National List (Fig. 2). These varieties are diploid cultivated forms of S. tuberosum group phureja and consequently did not yield more than two alleles per marker (none of which were exclusive). Three other varieties Anya, Carlingford and Pentland Hawk also yielded a maximum of two alleles per marker, however, more than two alleles were observed with other markers tested during the initial screen. This, therefore, indicates that the difference observed between varieties in the diploid phureja group is due to the unique combination, and not only because these varieties have fewer alleles. Indeed, the determination of allelic dosage using this method proved to be problematic. Dunbar Standard yielded a single peak for three markers (STM1024, STM2028 and STM3012) and four peaks for STM5136 (Fig. 1). The remaining two markers (STM2022 and STM5148) each yielded three peaks. In the case of this variety one peak is larger than the other two, with STM2022 the 181 bp peak is larger than the 195 and 236 bp peaks, and with STM5148 the 452 bp is larger than the 447 and 478 bp peaks (Fig. 1). It is therefore likely, but not certain, that these two alleles were present in double the dosage of the other alleles. In other varieties, where only two alleles were observed for a particular marker, it was often not so obvious what the dosage may have been (data not shown). When alleles were scored for construction of the database only presence or absence was recorded. This, therefore, means that the cluster analysis of the UK National List varieties (Fig. 2) is not intended as an accurate indication of the relationship between the varieties (see Provan et al., Reference Provan, Powell and Waugh1996) but is still a convenient method to show the distinctiveness of large numbers of varieties.
Discussion
The ability to identify cultivars rapidly and reliably has benefit to those involved in maintaining germplasm collections and those involved in quality inspections throughout the agro-chain (from seed potato certification, production of potatoes for end use, food processing, wholesale merchanting and consumers).
A number of molecular markers have been examined for their efficacy for variety identification in potato. Many of these have focused on the use of microsatellite markers because of their ease of use, robustness and speed (Kawchuk et al., Reference Kawchuk, Lynch, Thomas, Penner, Sillito and Kulcsar1996; Corbett et al., Reference Corbett, Lee, Donini and Cooke2001; Norero et al., Reference Norero, Malleville, Huarte and Feingold2002; Coombs et al., Reference Coombs, Frank and Douches2004; Ghislain et al., Reference Ghislain, Spooner, Rodríguez, Villamón, Núñez, Vásquez, Waugh and Bonierbale2004). The increasing number of available markers has made it possible to consider identifying a small set with enough discriminatory power to differentiate large numbers of varieties. The six microsatellite markers described here allow the differentiation of over 400 varieties (excluding somaclonal variants) and, coupled with the use of a BioNumerics database, the accurate identification of these varieties from a range of potato tissue with 100% accuracy.
Previous molecular studies have used marker systems that require either large amounts of starting material and are time-consuming to perform or are unreliable. For example, Görg et al. (Reference Görg, Schachtschabel, Ritter, Salamini and Gebhardt1992) were able to differentiate 130 out of 136 varieties using four RFLPs, a reliable, but lengthy process. RAPDs are quicker to perform than RFLPs and require no a priori knowledge of sequences within the genome. However, although the discriminatory power of RAPD is sufficient for variety identification (Demeke et al., Reference Demeke, Kawchuk and Lynch1993, Hosaka et al., Reference Hosaka, Mori and Ogawa1994; Sosinski and Douches, Reference Sosinski and Douches1996; Isseneger et al., Reference Isenegger, Taylor, Ford, Franz, McGregor and Hutchinson2001), its reproducibility has been called into question (Demeke et al., Reference Demeke, Kawchuk and Lynch1993; Isseneger et al., Reference Isenegger, Taylor, Ford, Franz, McGregor and Hutchinson2001). Similarly, the potential of ISSR has been investigated and also found unreliable (Corbett et al., Reference Corbett, Lee, Donini and Cooke2001). Although previous studies have shown AFLP to be potentially more discriminatory than SSRs (McGregor et al., Reference McGregor, Lambert, Greyling, Louw and Warnich2000), the method is more time consuming to perform than SSRs and the results more difficult to interpret due to the large numbers of fragments that can be generated and no large data sets have been published using this technique.
Former studies which utilize microsatellites for the identification of potato varieties have generally focused on small numbers of varieties. Kawchuk et al. (Reference Kawchuk, Lynch, Thomas, Penner, Sillito and Kulcsar1996) were only able to differentiate 73 out of 95 varieties tested using four markers. Likewise, Schneider and Douches (Reference Scheider and Douches1997) only resolved 24 out of 40 varieties using five markers. However, since these early publications, many more microsatellite markers have been reported (Milbourne et al., Reference Milbourne, Meyer, Bradshaw, Baird, Bonar, Provan, Powell and Waugh1997) and successful elucidation has improved, although overall numbers of varieties remain low. McGregor et al. (Reference McGregor, Lambert, Greyling, Louw and Warnich2000) reported that 39 varieties could be differentiated with five markers, Corbett et al. (Reference Corbett, Lee, Donini and Cooke2001) reported 50 varieties using as few as three markers and Coombs et al. (Reference Coombs, Frank and Douches2004) reported 17 varieties with 18 markers. The most extensive study published to date is that of Ghislain et al. (Reference Ghislain, Spooner, Rodríguez, Villamón, Núñez, Vásquez, Waugh and Bonierbale2004) who developed a set of 18 markers for genotyping lines from a range of cultivated potato species. They have characterized 913 accessions although these are made up from all species except S. tuberosum subsp. tuberosum.
We believe that our system is the first rapid, routine and robust application of microsatellite markers for identifying large numbers of varieties of S. tuberosum subsp. tuberosum. The method is regularly used by SASA as an additional check on the integrity of its variety collections and for identifying plants of a different variety found in seed potato crops during inspections. The system can also be used to verify varietal identity in cases in which one variety is marketed under the name of another variety, either as seed or for consumption (Anon., 2003a, b; Davey, Reference Davey2004). The method was also used in the ring rot outbreak in the UK at the end of 2003 to confirm the varietal identity of infected tubers within a lot and showed that there was an admixture in one of the infected crops (Anon., 2005). This greatly reduced the amount of work required by the regulatory bodies carrying out trace-back investigations as they could focus solely on the infected variety.
The database is being continually augmented to include all of the varieties held in the SASA collections and ultimately, in collaboration with other laboratories in Europe, the entire EU Common Catalogue. The intention is to make a searchable version of the database available on the internet at the earliest possible opportunity. This will prove to be an invaluable resource for the potato-growing community in the European Union.
Acknowledgements
Thanks to Robbie Waugh, Glenn Bryan, Malcolm Macaulay and Karen McLean at SCRI for their invaluable help in the choice of markers used in this study; and Stuart Carnegie, Heather Campbell, Maureen McCreath and Arlene Cameron in the Potato section at SASA for their help in collecting the varieties examined in this study.