Introduction
Trichinosis, a parasitic disease caused by the widely distributed nematode Trichinella spiralis, is responsible for more than 2500 annual cases of human infection reported from 55 countries and 11 million patients are estimated to suffer from chronic trichinosis (Pozio, Reference Pozio2007; Murrell and Pozio, Reference Murrell and Pozio2011; Pozio and Zarlenga, Reference Pozio and Zarlenga2013). Traditionally, undercooked pork consumption has been the predominant cause of human trichinosis, but studies have reported that T. spiralis transmission through other sources of meat such as horses is plausible (Gottstein et al., Reference Gottstein, Pozio and Nockler2009; Murrell and Pozio, Reference Murrell and Pozio2011). Ingestion of T. spiralis through contaminated meat enables the movement of larva into the gastrointestinal tract, where it invades the host's duodenal mucosa (Shin et al., Reference Shin, Watts, Oettgen, Friend, Pemberton, Gurish and Lee2008). Upon subsequent molting processes, T. spiralis worms copulate and females release its in utero hatched larvae, which penetrate the intestines and eventually migrate into the muscle tissues of the host and induce formation of nurse cells (Purkerson and Despommier, Reference Purkerson, Despommier and Kim1974; Lee and Shivers, Reference Lee and Shivers1987; Gagliardo et al., Reference Gagliardo, McVay and Appleton2002; Shin et al., Reference Shin, Watts, Oettgen, Friend, Pemberton, Gurish and Lee2008). Diarrhoea, eosinophilia, fever, gastroenteritis, myalgia and periorbital oedema are symptoms associated with trichinosis, but depending on the infection dose, T. spiralis infections may range from asymptomatic to fatal (Wilson et al., Reference Wilson, Hall, Montgomery and Jones2015). In some cases, T. spiralis infection may revolve around the central nervous system, which consequently causes brain lesions arising from neurotrichinosis (Kerzner and Redmon, Reference Kerzner and Redmon1964; Rosca and Simu, Reference Rosca and Simu2018). Trichinosis caused by T. spiralis has been recently re-emerging in various parts of the world, including but not limited to southeastern Europe (Cuperlovic et al., Reference Cuperlovic, Djordjevic and Pavlovic2005). Even in highly developed nations, whose strict regulations enabled prevention of trichinosis occurring in humans and domestic animals, eradication of T. spiralis in wild life remains arduous (Cuperlovic et al., Reference Cuperlovic, Djordjevic and Pavlovic2005).
Respiratory syncytial virus (RSV) is a notorious viral pathogen belonging to the family Paramyxoviridae, with 80% of the children experiencing infection at least once in their first year of life (Lambert et al., Reference Lambert, Sagfors, Openshaw and Culley2014). RSV infections are usually self-resolving via innate and adaptive immunity, and these viruses trigger altered gene expressions to stimulate influx of cells for antiviral immune response (Collins and Graham, Reference Collins and Graham2008). Upon RSV infection, dendritic cells trigger activation of CD8 T cells to enhance viral clearance, which usually peaks by 8 days after infection in murine models (Schmidt and Varga, Reference Schmidt and Varga2018). In neonatal mice, hypersecretion of mucus, production of IL-4 and IL-13, along with eosinophil and neutrophil recruitment upon RSV infection has been observed (Drajac et al., Reference Drajac, Laubreton, Riffault and Descamps2017). Vaccine studies using the RSV F antigens can induce significant neutralizing antibody response for protection against RSV (Lee et al., Reference Lee, Ko, Kim, Hwang, Lee, Kwon, Kim, Lee, Jung and Kang2017; Grieves et al., Reference Grieves, Yin, Garcia-Sastre, Mena, Peeples, Risman, Federman, Sandoval, Durbin and Durbin2018). However, mutations in the RSV F proteins have conferred the viruses resistance against palivizumab, thereby enabling them to neutralize the antibody response against RSV (Zhu et al., Reference Zhu, McAuliffe, Patel, Palmer-Hill, Yang, Liang, Su, Zhu, Wachter, Wilson, MacGill, Krishnan, McCarthy, Losonsky and Suzich2011, Reference Zhu, Patel, McAuliffe, Zhu, Wachter, McCarthy and Suzich2012; Bates et al., Reference Bates, Keefer, Slaughter, Kulp, Schief and Crowe2014).
Trichinella spiralis and virus co-infection studies, although limited in number, have investigated the immunological responses induced upon infection with multiple pathogens within a single host. Some of the earliest T. spiralis and virus infection studies investigating the immunological aspects were conducted using the Japanese B encephalitis virus, which enhanced viral susceptibility via nullification of defence mechanism in mice (Cypess et al., Reference Cypess, Lubiniecki and Hammon1973; Lubiniecki et al., Reference Lubiniecki, Cypess and Lucas1974). Infection with T. spiralis prior to intradermal infection of Shope's fibroma virus resulted in reduced virus titres in rabbits, which contributed significantly to viral resistance (Bellelli et al., Reference Bellelli, Frosi, Chiovoloni, Grelloni and Baldelli1989). Co-infecting T. spiralis with influenza virus has significantly reduced cellular recruitment to the lungs and decreased TNF-α via IL-10-independent mechanism in mice (Furze et al., Reference Furze, Hussell and Selkirk2006). Inoculating T. spiralis and murine norovirus into mice incurred immunomodulatory changes that impaired anti-viral response in mice (Osborne et al., Reference Osborne, Monticelli, Nice, Sutherland, Siracusa, Hepworth, Tomov, Kobuley, Tran, Bittinger, Bailey, Laughlin, Boucher, Wherry, Bushman, Allen, Virgin and Artis2014). These studies have demonstrated that T. spiralis is capable of modulating the host immune response upon infection with another pathogen, which ultimately serves to prolong its own survival. Similar to T. spiralis, co-infection studies involving RSV and a parasite are also currently lacking. Recently, a co-infection study using RSV and a helminth Heligmosoides polygyrus was conducted, of which the helminth induced anti-viral response in the lungs of mice (McFarlane et al., Reference McFarlane, McSorley, Davidson, Fitch, Errington, Mackenzie, Gollwitzer, Johnston, MacDonald, Edwards, Harris, Marsland, Maizels and Schwarze2017). However, all of the aforementioned works primarily focused on the disease onset of the virus and did not research in depth the impact a viral infection could have on the parasite.
Knowledge pertaining to RSV and parasite co-infection, with emphasis on immune response against the parasite, remains insufficient. Furthermore, because RSV has more than likely infected everyone around the globe at least once during the infantile period, it was of our strong interest to study whether early infection with RSV had significant influence on subsequent pathogen that may infect the host. In the present study, we investigated the impact of RSV infection on the outcome of subsequent T. spiralis infection. Our results revealed that resistance to T. spiralis can be conferred through previous RSV infection. Results of this study will provide additional knowledge to understanding the relationship between helminth and a pulmonary virus within a murine host, as well as induced immunological changes in response to the sequential infections.
Materials and methods
Mice infection and parasite preparation
Female Sprague Dawley (SD) rats (6 weeks old) and female Balb/c mice (7 weeks old) were purchased from KOATECH (Pyeongtaek, Gyeonggi-do, South Korea). SD rats were used for the maintenance of T. spiralis Korean strain. Trichinella spiralis larvae were collected by digesting rat muscle tissues in pepsin-HCl solution, which were filtered through a metallic filter mesh and thoroughly washed. Harvested larvae were counted under microscope. Mice were intranasally inoculated with RSV A2 strain (3 × 10⁶ PFU). One hundred and fifty T. spiralis larvae were used to infect the mice via orogastric tube.
Cells and virus preparation
HEp-2 cells were cultured in T-75 tissue culture flasks in Dulbecco's modified Eagle medium (DMEM) (Welgene, Daegu, Korea) supplemented with 10% fetal bovine serum, penicillin and streptomycin. Propagated HEp-2 cells were infected with RSV A2 strain and allowed to adsorb to cells for 1 h at 37 °C, 5% CO2 in serum-free DMEM. Additional serum-free DMEM was added to the flask and cells were incubated for 2 days. Infected HEp-2 cells were harvested using a cell scraper and centrifuged for 10 min at 2000 RPM, 4 °C. After supernatant has been removed, cell pellets were sonicated and centrifuged using the aforementioned settings. Titration of the RSV in supernatant was conducted using plaque assay and viruses were stored at −80 °C until use.
Trichinella spiralis excretory/secretory antigen preparation
Trichinella spiralis larva were collected from digested rat muscle tissues in pepsin-HCl solution. The larvae were sequentially washed in tap water, autoclaved distilled water and 0.85% saline to remove any debris from rat carcass before culturing in DMEM medium supplemented with sodium pyruvate, fetal bovine serum and antibiotics in 37 °C, 5% CO2 incubator. Culture medium was harvested, centrifuged at 2000 RPM for 10 min, 4 °C and the supernatant was lyophilized at −20 °C. Protein concentration was determined using the Micro BCA protein assay kit (Thermo Fisher Scientific, USA), and the antigen samples were stored at −20 °C until use.
RSV plaque assay
HEp-2 cells were seeded in a 12-well cell culture plate (SPL Life Sciences, Korea) and cultured until confluent. All procedures were followed as previously described (Kim et al., Reference Kim, Kim, Piao, Lee and Quan2017). Serially diluted RSV stocks were used to infect the cells and overlaid with 1% noble agar and incubated at 37 °C, 5% CO2. After 3 days, agar overlay were gently removed and plates were incubated with goat anti-mouse RSV fusion protein antibody (Merck Millipore, USA). Goat anti-mouse IgG-HRP purchased from Southern Biotech (Birmingham, AL, USA) was used as secondary antibody and detection was performed using stable diaminobenzene purchased from Invitrogen (Carlsbad, CA, USA). Plaques were counted and plaque forming units (PFU) of viruses were calculated afterwards.
Trichinella spiralis-specific IgG, IgG1, IgG2a, IgG2b and IgE antibody responses and total IgE antibody response
Peripheral blood from mice were collected on days 11, 18 and 32 post-infection (p.i.) through retro-orbital plexus puncture using heparinized capillary tube. Sera were separated from blood by centrifuging at RT, 10 min at 5000 RPM and stored at −20 °C until use. Trichinella spiralis-specific antibody responses were detected using enzyme-linked immunosorbent assay as previously described (Van Milligen et al., Reference Van Milligen, Cornelissen, Hendriks, Gaasenbeek and Bokhout1998). One hundred microlitres of T. spiralis excretory/secretory (ES) antigens were coated in a 96-well plate (SPL Life Sciences) at a concentration of 4 ug mL−1 in carbonate–bicarbonate coating buffer (0.1 M sodium carbonate, pH 9.5) and incubated at 4 °C overnight prior to use. After blocking with BSA at 37 °C for 1 h, mouse sera were added to respective wells and incubated at 37 °C for 2 h. HRP-conjugated IgG, IgG1, IgG2a, IgG2b and IgE anti-mouse antibodies were purchased from Southern Biotech. Following the addition of secondary antibodies into respective wells, plates were incubated at 37 °C for 1 h. Substrate o-phenylenediamine (Sigma Aldrich, St. Louis, MO, USA) was dissolved in citrate buffer (pH 5.0, 0.05 M) with H2O2, and colorimetric changes were measured at 490 nm using ELx808 microplate reader. For total IgE detection, 96-well plate was coated with 100 uL of unlabelled IgE antibody (Southern Biotech) in carbonate–bicarbonate buffer at a concentration of 2 ug mL−1 per well and incubated overnight at 4 °C. Rest of the experimental procedure was identical to the method outlined above.
Eosinophil counting post-infection
Blood from mice were collected via retro-orbital puncture on days 11, 18, 32 p.i. for all groups. Ten microlitres of obtained whole blood was added into 90 uL Discombe's solution (5% vol. acetone, 5% vol. 1% eosin solution, 90% vol. distilled water) and gently mixed for staining. Stained eosinophils in the blood samples were counted using haemocytometer under a light microscope.
Trichinella spiralis antigen-specific cytokine response
Individual spleens from each mouse were collected after day 32. Single-cell suspensions from spleens were prepared and seeded into a 96-well plate. Cells were cultured in RPMI-1640 medium supplemented with 10% fetal bovine serum, 2 mm L-glutamine, 25 mm HEPES, 1% sodium pyruvate, penicillin and streptomycin for 3 days at 37 °C, 5% CO2 after stimulation with 100 uL of 4 ug mL−1 T. spiralis ES antigen. Supernatants from each well were collected and stored at −20 °C until use. OptEIA interferon gamma (IFN-γ), IL-4, IL-6 and IL-10 kits (BD Biosciences, San Jose, CA, USA) were used to determine the cytokine levels in the stimulated splenocytes, following the manufacturer's protocol.
Flow cytometry analysis
On day 32, all mice were euthanized and splenocytes from homogenized individual spleens were harvested. Red blood cells were lysed using RBC lysis buffer (Sigma Aldrich). Cells were counted under microscope using haemocytometer and 1 × 10⁶ splenocytes were stained with CD16/32 (BD Biosciences) for Fc receptor blocking. Afterwards, cells were stained with fluorophore-labelled surface markers CD3-PE Cy7, CD4-FITC and CD8-PE (BD Biosciences), and subsequently fixed with 4% paraformaldehyde. Stained cells were acquired and analysed using BD C6 Accuri (BD Biosciences). Absolute count for the T cells was determined using the method previously described (Masters and Harrison, Reference Masters and Harrison2014).
RSV antibody reacting to T. spiralis determined by immunoblotting
Protein concentration of the prepared RSV stock was calculated using Micro BCA kit (Thermo Fisher Scientific) and this was separated on a polyacrylamide gel along with T. spiralis ES antigen. Transferred samples were blocked with 5% skim milk and incubated overnight at 4 °C using sera from either naïve mouse or RSV-infected mice that has been challenged after 1 month p.i.
Worm burden determination
Mice were sedated then subsequently euthanized prior to organ sampling on day 32. Diaphragm from individual mice were collected and weighed before digestion in pepsin-HCl solution overnight in a shaking incubator at 37 °C. Larvae were counted under a light microscope the next day. Counted larvae were normalized per gram of diaphragm tissue.
Statistics
All parameters were recorded for individual mice within each group. Statistical analyses were performed using one-way analysis of variance with Turkey's post hoc test and two-tailed unpaired Student's t-test using SigmaPlot 12.5 software. Statistical significance was determined using *P < 0.05 for all experiments.
Results
RSV infection enhances antibody responses against T. spiralis antigen
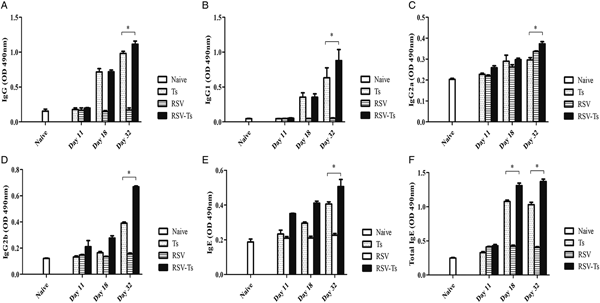
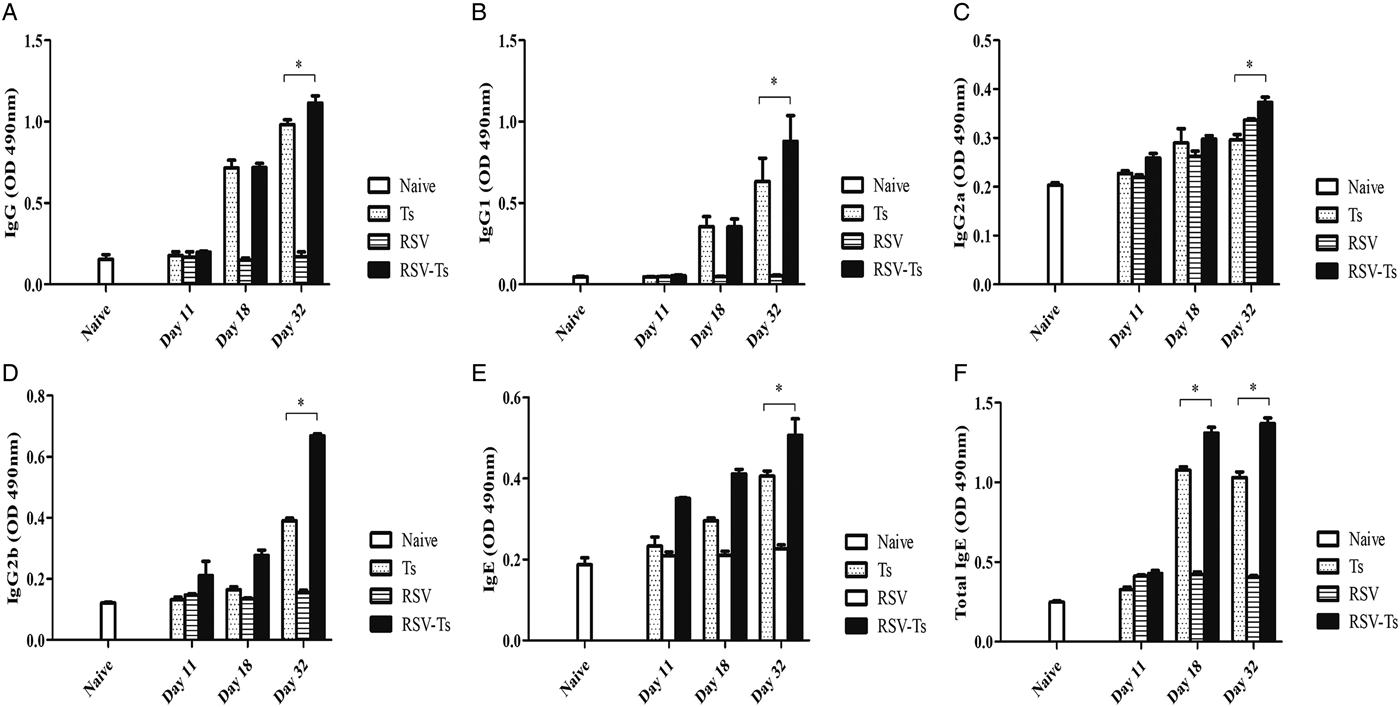
Serum collection time points were followed as outlined in the experimental schedule (Fig. 1). To determine whether antibody responses are altered through previous RSV infection, regularly collected sera were used to measure T. spiralis antigen-specific antibody responses. The sera were used to assess changes in IgG, IgG subclasses, IgE and total IgE levels. Initially, antibody responses for all types of immunoglobulin were not detected during the first week of infection. Trichinella spiralis ES antigen-specific IgG antibody responses began to increase by day 18 for Ts control and RSV-Ts, both of which peaked at day 32 (Fig. 2A). Consistent with this result, similar pattern was observed for all IgG subclasses (Fig. 2B–D). Antigen-specific IgE levels and total IgE levels also increased by day 32 as with IgG (Fig. 2E and F). Collectively, substantial increase in antigen-specific antibody responses were detected from both T. spiralis control and RSV-Ts mice, with higher antibody levels observed throughout in the latter. RSV-Ts induced the greatest level of antibody response against T. spiralis ES antigen, indicating that introducing two consecutive infections using RSV and T. spiralis can bolster the immune response against T. spiralis in mice.
Experimental schedule of mice infection. Mice were initially inoculated with 3 × 10⁶ PFU of RSV A2 virus, which were subsequently infected with 150 T. spiralis larvae via orogastric tube. Collected blood on days 11, 18 and 32 were used to obtain sera and eosinophil count. After 32 days p.i., mice were sacrificed to assess cytokine levels, T lymphocytes and worm burden reduction.

Antibody response profiles against T. spiralils ES antigen. Induced immunoglobulin levels against T. spiralis ES antigen were detected by ELISA. IgG (A), IgG1 (B), IgG2a (C), IgG2b (D), IgE (E) and total IgE (F) from mice sera collected on days 11, 18 and 32 were used (n = 5). Data are expressed as mean ± s.e.m. *P < 0.05 were considered significant.
Eosinophil levels post-RSV infection contributes to protection against T. spiralis
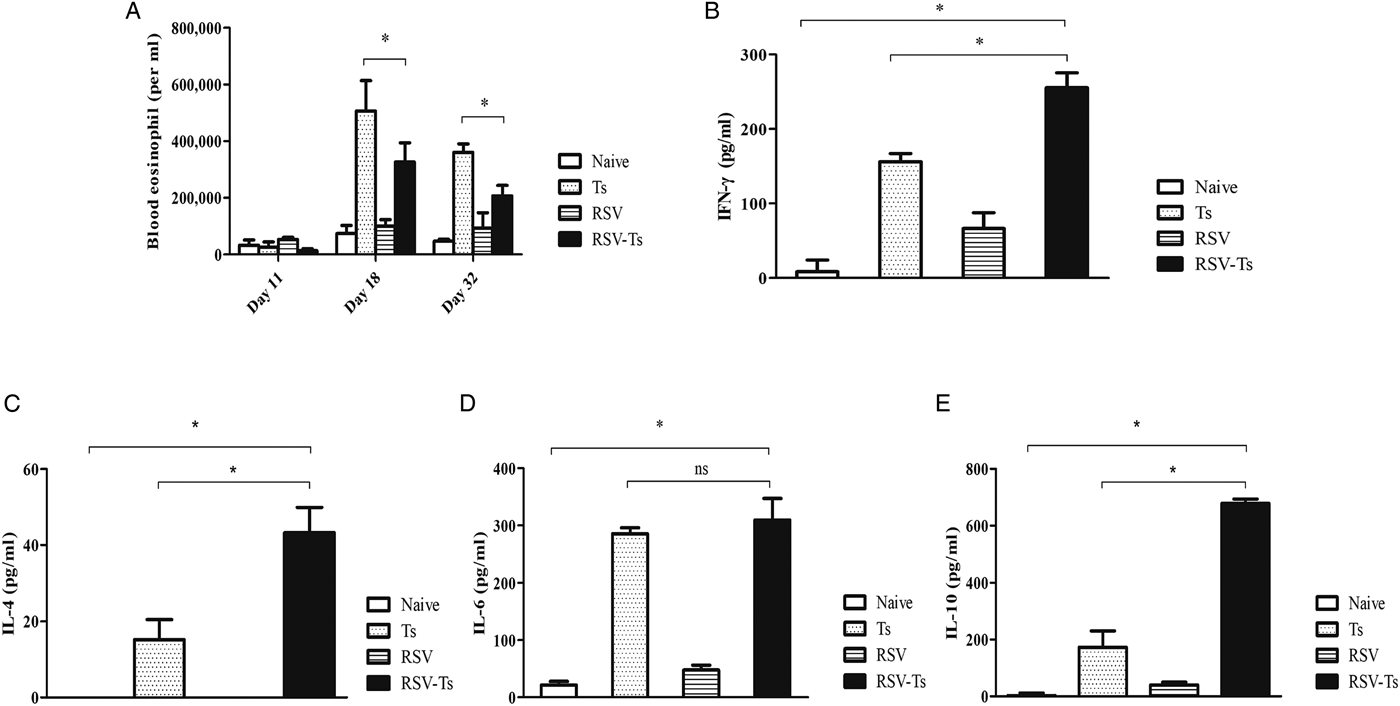
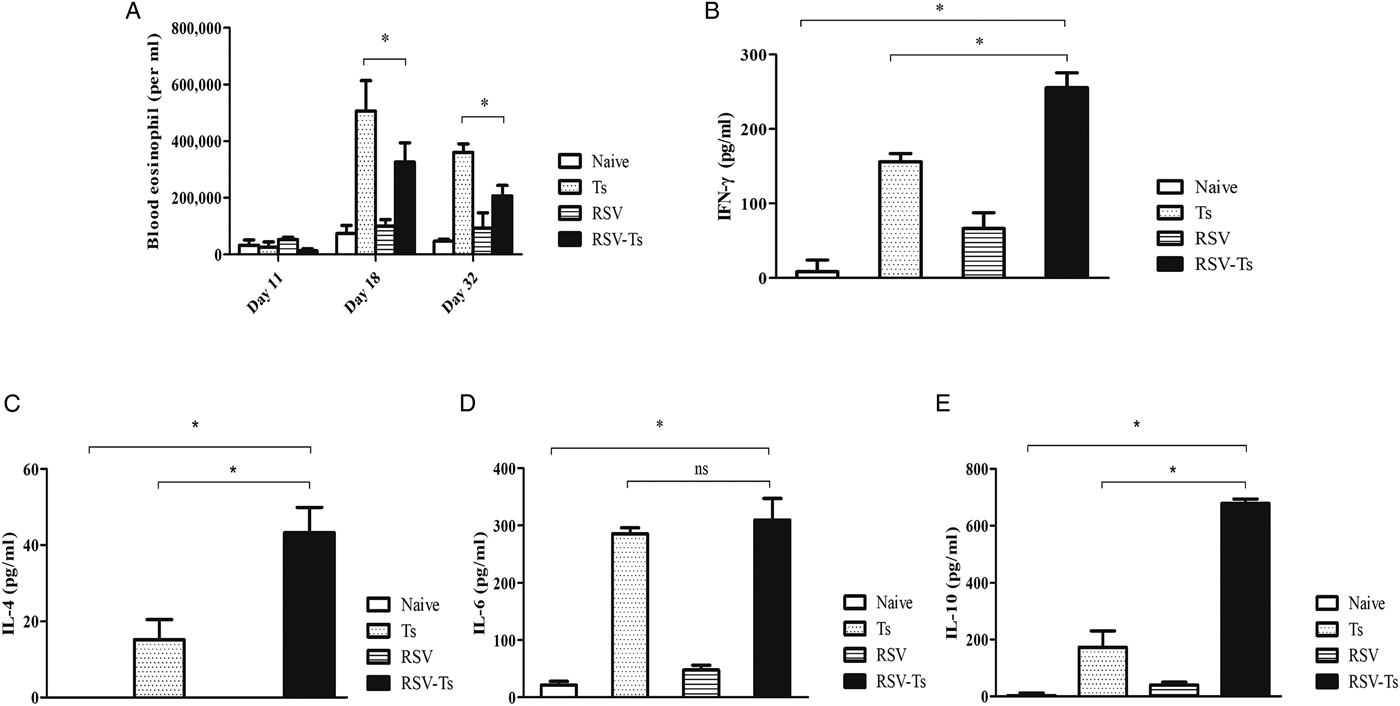
Blood of mice collected on days 11, 18 and 32 were used to count the number of eosinophils under microscope after staining with Discombe's solution. As illustrated in Fig. 3A, similar levels of peripheral blood eosinophils were detected in all groups at day 11. By day 18, T. spiralis control and RSV-Ts groups demonstrated elevated eosinophil levels, which were substantially lower in RSV-Ts group. This trend continued onwards until day 32, where marked reduction in eosinophil levels were observed for both groups. These results suggest that introducing RSV into mice prior to T. spiralis significantly lessened the level of eosinophilia in the peripheral blood, which may have contributed to resistance against T. spiralis infection.
Blood eosinophil and T. spiralis ES antigen stimulated splenocyte cytokine response. Blood collected at days 11, 18 and 32 was used to count eosinophils after staining with Discombe's solution (A). Th1 and Th2 cytokine responses were detected from mice on day 32 post-infection. Cytokine profiles of IFN-γ (B), IL-4 (C), IL-6 (D) and IL-10 (E) from T. spiralis ES antigen-stimulated mice splenocytes were obtained (n = 5). Data are expressed as mean ± s.e.m. *P < 0.05 were considered significant, whereas ‘ns’ indicates no statistical significance.
Increased antigen-specific cytokine secretion through previous RSV infection
Spleens of mice from all groups were individually harvested and splenocytes were isolated after red blood cell lysis. After 3 days of incubation, T. spiralis antigen-stimulated splenocyte supernatants were harvested to assess Th1 and Th2 cytokine responses (Fig. 3B–E). Highest cytokine responses were observed in RSV-Ts group. Noticeable differences were observed between Ts control and RSV-Ts groups for IFN-γ, IL-4 and IL-10, although no significant difference between the two aforementioned groups was observed in the case of IL-6. Nevertheless, drastic increase in both IFN-γ, IL-4 and IL-10 levels indicate that introducing RSV prior to T. spiralis infection induces an immune response in which both Th1 and Th2 cytokines are predominant.
RSV infection increases spleen T-cell responses to T. spiralis post-infection
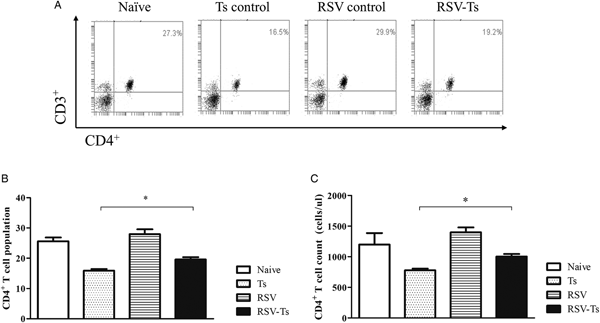
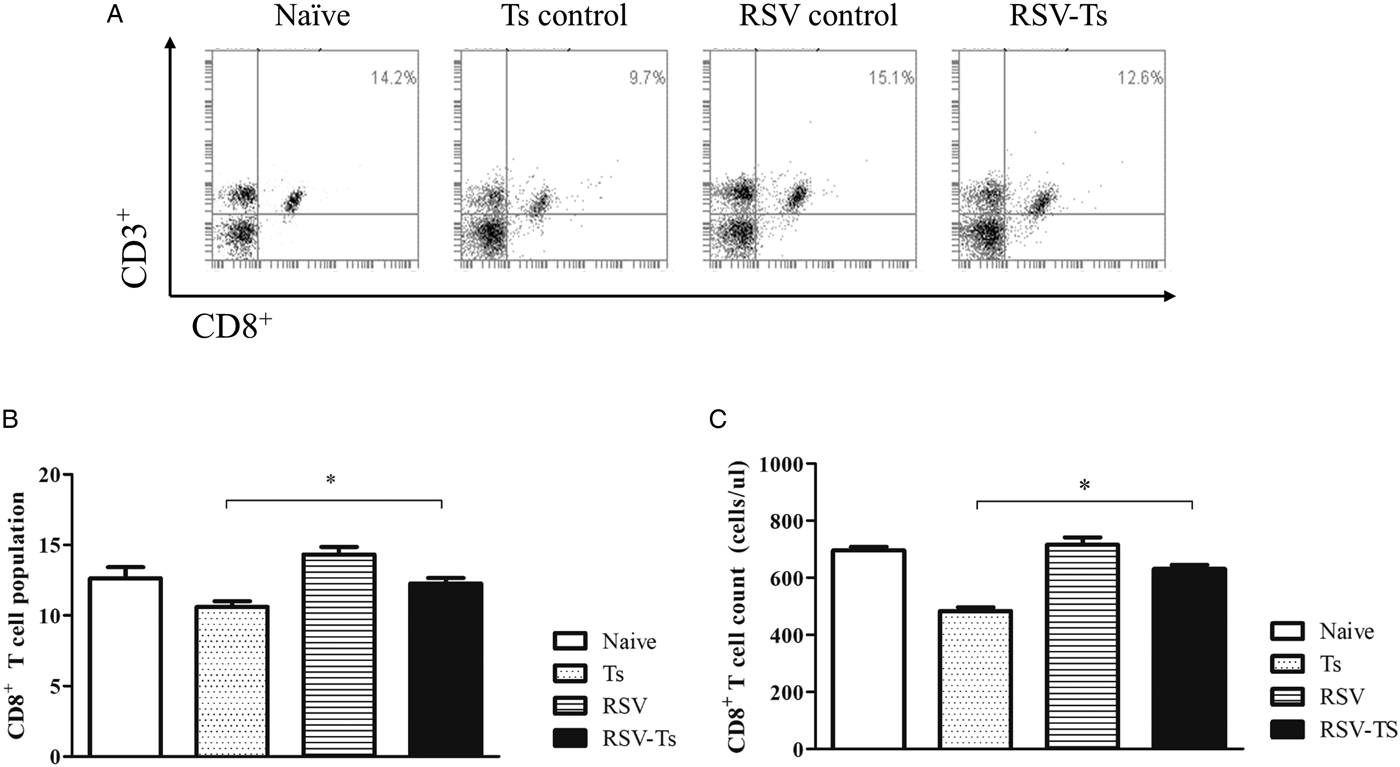
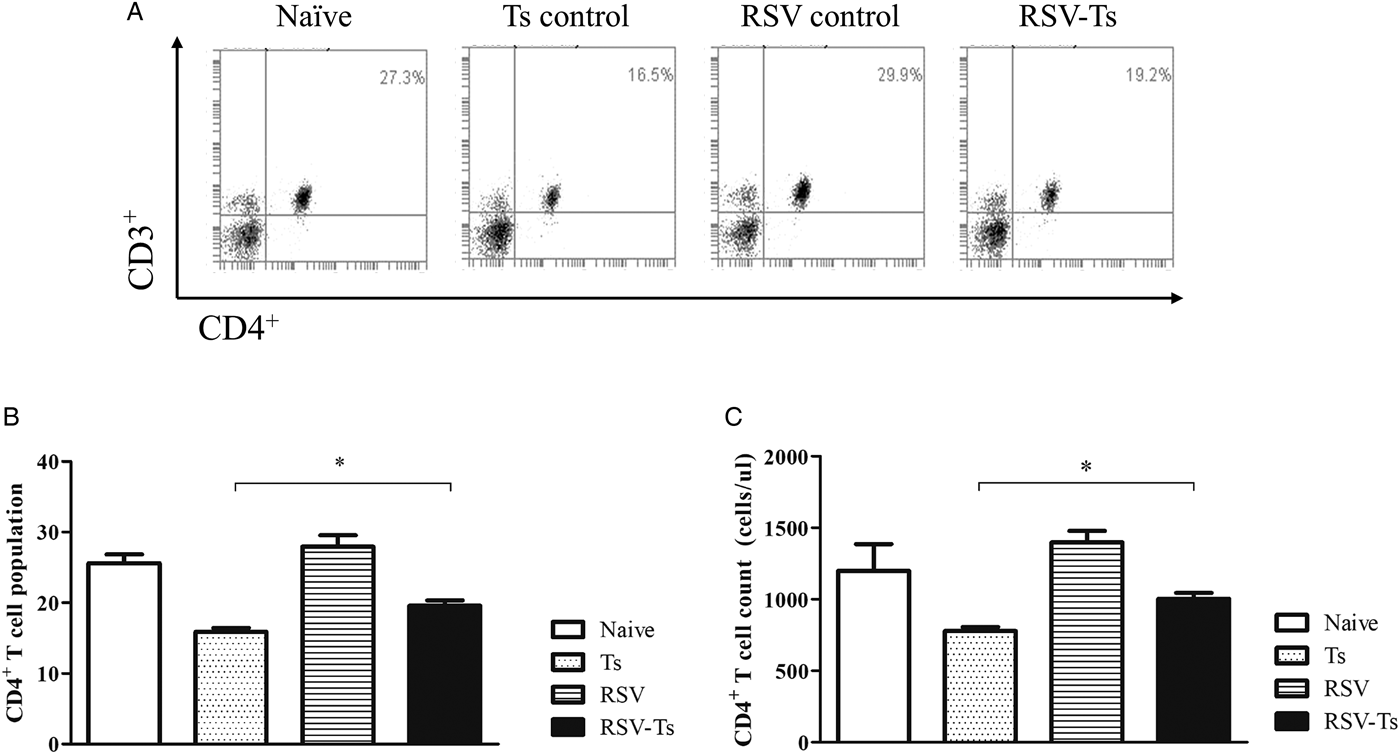
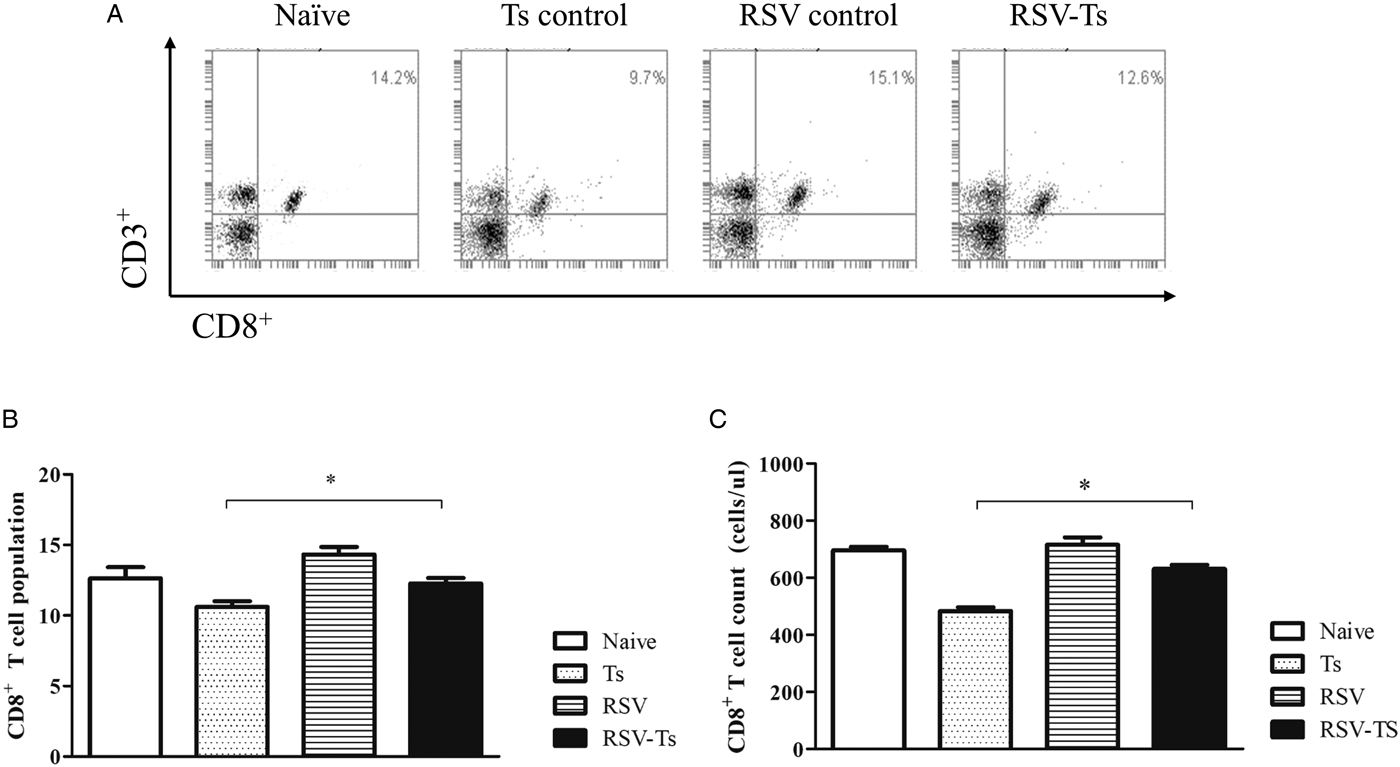
On day 32, splenocyte T-cell responses from all groups were analysed using flow cytometry. Interestingly, compared with naïve mice, both CD4+ and CD8+ T-cell responses were significantly reduced in T. spiralis control and RSV-Ts mice. Miniscule increase in CD4+ T-cell population and absolute counts were observed if RSV was pre-infected before T. spiralis (Fig. 4B and C). Identical patterns were observed for CD8+ T cells, as slight increase in the T-cell population and cell counts were noticed (Fig. 5B and C). The population patterns of CD4+ and CD8+ T cells among groups were similar to those of absolute numbers. In both cases, RSV control demonstrated the highest level of T cells in spleen for both CD4+ and CD8+ T lymphocytes. From these results, it is evident that previous infection with RSV induces greater CD4+ and CD8+ T-cell proliferation than T. spiralis control to enhance murine immune response against T. spiralis.
Splenocyte CD4+ T lymphocyte levels. On day 32, mice were sacrificed and individual splenocytes were obtained for flow cytometry (n = 5). Splenocytes of each individual mice were stained with CD3 and CD4 surface markers to detect CD4+ T cells. Panels show representative flow cytometry of splenocytes stained for CD4+ T cells from each group (A) as well as means for CD4+ T cells population and their counts from spleen (B, C). Two-tailed unpaired Student's t-test was used to test for statistical significance between T. spiralis control and RSV-Ts. Data are expressed as mean ± s.e.m. *P < 0.05 were considered significant.
Splenocyte CD8+ T lymphocyte levels. On day 32, individual splenocytes were isolated from mice and used for flow cytometry (n = 5). Splenocytes of each individual mice were stained with CD3 and CD8 surface markers to detect CD8+ T cells. FACS plots of representative CD8+ T cells from each group (A) and mean CD8+ T-cell population displayed in both percentage and cell counts from spleen are shown (B and C). Two-tailed unpaired Student's t-test was used to test for statistical significance between T. spiralis control and RSV-Ts. Data are expressed as mean ± s.e.m. *P < 0.05 were considered significant.
RSV antibodies can detect T. spiralis ES antigen and contribute to resistance
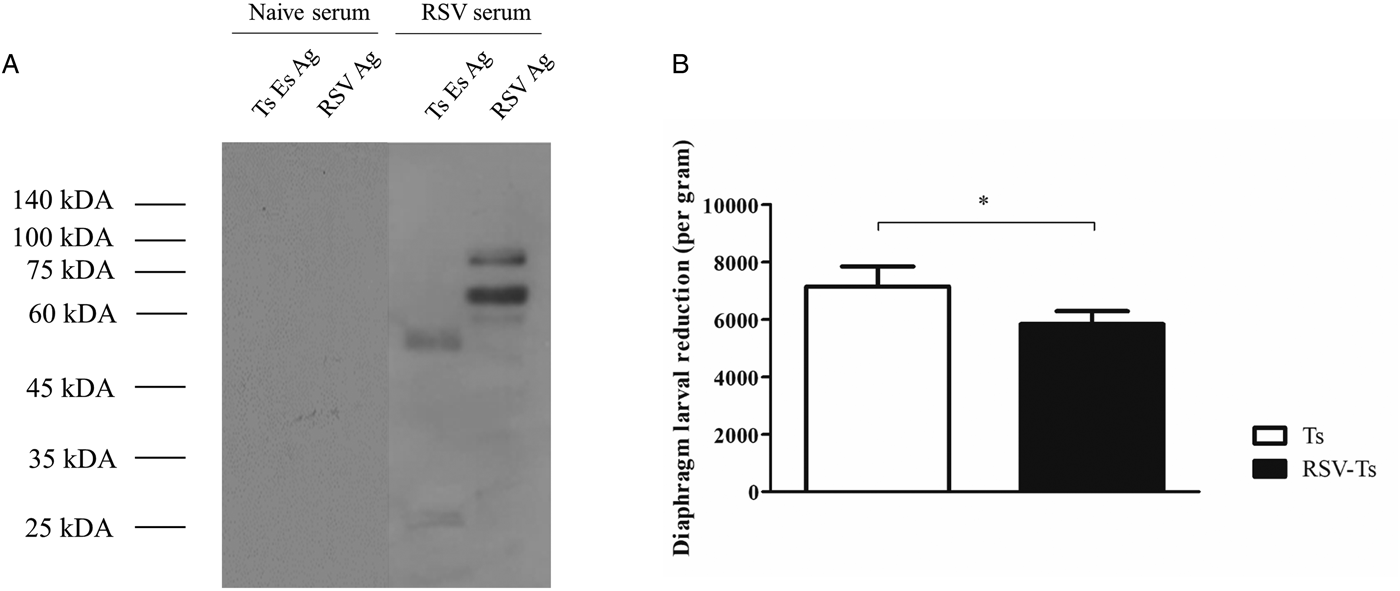
Serum from RSV-infected mice were used to perform immunoblotting against both RSV and T. spiralis ES antigen (Fig. 6A). Results show that multiple bands were detected upon incubation with RSV serum, implying that a few protein components from T. spiralis ES antigen may share common epitopes with some RSV proteins. In contrast, no bands were detected from antigens probed with naïve serum. Using these data, the degree of resistance conferred by RSV was assessed by determining the worm burden reduction in mice (Fig. 6B). Compared with T. spiralis control group, significantly less larvae count was observed from the diaphragms of RSV-Ts mice, implying previous RSV infection contributes to resistance against T. spiralis by reacting against T. spiralis ES antigens to stimulate antibody production against T. spiralis.
RSV antibody reaction against T. spiralis ES antigen and worm burden reduction. Western blot of T. spiralis ES antigen and RSV revealed that using antibodies generated against RSV successfully reacted with both T. spiralis ES antigen and RSV, whereas no reaction was detected when probed with naïve serum (A). Significant worm burden reduction through previous RSV infection was observed after T. spiralis challenge (n = 5) (B). Data are expressed as mean ± s.e.m. *P < 0.05 were considered significant.
Discussion
This study investigated enhanced immune responses and resistance induced by preliminary infection of RSV and subsequent infection with T. spiralis (RSV-Ts) in a mouse model. Trichinella spiralis-specific IgG, IgG1, IgG2a and IgG2b antibody responses were significantly increased by day 32 in RSV-Ts group, in which IgG1 antibody response was predominant. Trichinella spiralis-specific IgE and total IgE levels were elevated in RSV-Ts group as well. Although no significant antibody response against T. spiralis ES antigen was detected from RSV-infected control mice, subsequent T. spiralis infection increased the antibody response against T. spiralis in RSV-Ts. Western blot results show that even though common antigens of identical sizes between T. spiralis ES antigen and RSV were not present, antibody raised against RSV detected certain protein components of T. spiralis ES antigen (Fig. 6A). Studies reporting viral antibody reacting against parasites are extremely limited, but one study has reported that antibodies produced against xenotropic mouse retrovirus Bv2 glycoprotein reacted against Schistosoma japonicum adult worms (Tanaka et al., Reference Tanaka, Iwamura, Amanuma, Irie, Watanabe, Watanabe, Uchiyama and Yasuraoka1989). In this sense, it can be assumed that antibody generated against RSV contributed to enhanced T. spiralis-specific IgG response by inducing greater levels of IgG subclasses. Both T. spiralis-specific and total IgE levels in RSV-Ts were significantly increased by day 32. These results were expected as IgE has been reported to increase as much as 1000-fold primarily due to IL-4, IL-13 and various other factors during a helminth infection (Garraud et al., Reference Garraud, Perraut, Riveau and Nutman2003). During RSV infection, increased production of RSV-specific IgE has also been documented in both humans and mice (Welliver et al., Reference Welliver, Wong, Sun, Middleton, Vaughan and Ogra1981; Becker, Reference Becker2006; Dakhama et al., Reference Dakhama, Lee, Ohnishi, Jing, Balhorn, Takeda and Gelfand2009). IgE, with respect to T. spiralis, is closely associated with parasitic clearance and mast cell response in mice (Gurish et al., Reference Gurish, Bryce, Tao, Kisselgof, Thornton, Miller, Friend and Oettgen2004).
Eosinophilia was observed in both T. spiralis and RSV-Ts, with significantly less eosinophils detected from the latter. Initially, we anticipated greater levels of eosinophils in RSV-Ts compared with T. spiralis control, as eosinophil recruitment in response to RSV infection has been previously documented (Openshaw and Tregoning, Reference Openshaw and Tregoning2005). Contrary to what was expected, RSV-Ts mice had significantly lower eosinophil profile to cope with subsequent T. spiralis infection. Presented eosinophil results for T. spiralis control mice are consistent with previously reported data in rats, as eosinophil levels peaked around week 3 and diminished over the span of next few weeks (Lee and Best, Reference Lee and Best1983; Wakelin and Donachie, Reference Wakelin and Donachie1983; Moon et al., Reference Moon, Lee, Soh, Guo, Piao and Quan2018). Similarly, peak eosinophils were observed at day 21 in both wild-type and IgE-ablated mice infected with T. spiralis (Gurish et al., Reference Gurish, Bryce, Tao, Kisselgof, Thornton, Miller, Friend and Oettgen2004). Recent studies investigating the function of eosinophils in T. spiralis infection have reported interesting results. Eosinophils appear to benefit T. spiralis rather than the host, as it prolongs parasitic survival in muscle through inhibiting nitric oxide accumulation (Fabre et al., Reference Fabre, Beiting, Bliss, Gebreselassie, Gagliardo, Lee, Lee and Appleton2009; Gebreselassie et al., Reference Gebreselassie, Moorhead, Fabre, Gagliardo, Lee, Lee and Appleton2012; Huang et al., Reference Huang, Gebreselassie, Gagliardo, Ruyechan, Lee, Lee and Appleton2014). This applies only to primary infection with T. spiralis as upon re-infection with T. spiralis, eosinophils promote protection against T. spiralis (Huang et al., Reference Huang, Gebreselassie, Gagliardo, Ruyechan, Luber, Lee, Lee and Appleton2015). In this sense, the significantly reduced eosinophilia in days 18 and 32 indicate that less protection was conferred to newborn larvae in the muscle tissues, thereby contributing to resistance against T. spiralis in RSV-Ts mice.
Both T. spiralis-specific Th1 and Th2 cytokines were secreted to a greater extent in the spleens of RSV-Ts mice than its control groups. IL-4 levels in RSV-Ts increased nearly 2-fold compared with T. spiralis control mice. As IgE production upon nematode infection is reliant on IL-4, significant increase in IL-4 due to RSV infection may have conferred enhanced protection against T. spiralis infection (Finkelman et al., Reference Finkelman, Katona, Urban, Snapper, Ohara and Paul1986, Reference Finkelman, Shea-Donohue, Goldhill, Sullivan, Morris, Madden, Gause and Urban1997). No significant difference in IL-6 level was observed between RSV-Ts and T. spiralis control mice, indicating IL-6 may not be involved in conferring resistance against T. spiralis. Upon muscle tissue invasion by T. spiralis, production of cytokines such as IL-10 and IFN-γ in mice has been observed (Bruschi and Chiumiento, Reference Bruschi and Chiumiento2011). Comparing T. spiralis infection in Balb/c and STAT6-ablated mice 18 days p.i., higher concentrations of both IL-10 and IFN-γ were observed (Beiting et al., Reference Beiting, Gagliardo, Hesse, Bliss, Meskill and Appleton2007). Although the exact concentrations of measured cytokines may be different, possibly due to different organ of study and time of measurement, the patterns were similar as greater amounts of IL-10 were produced compared with IFN-γ. These results correlate with the current study as increased production of both IFN-γ and IL-10 was observed in both T. spiralis control and RSV-Ts mice, with significantly increased levels of the aforementioned cytokines produced in the latter. Both of these cytokines are of importance for resistance against T. spiralis as IFN-γ is crucial for inhibiting T. spiralis encysting in muscle in vivo, whereas IL-10 is essential for immune response against intestinal T. spiralis (Helmby and Grencis, Reference Helmby and Grencis2003). In vivo priming of T cells using ES antigens secreted from muscle-encysted larvae induces strong Th2 polarization though secretion of IL-10 and TGF-β (Gruden-Movsesijan et al., Reference Gruden-Movsesijan, Ilic, Colic, Majstorovic, Vasilev, Radovic and Sofronic-Milosavljevic2011). Similarly, significantly high IL-10 production was observed in our study. In response to tissue injury, for instance through new born larval invasion of muscle tissue, cytokines such as IL-6 and IL-27 are secreted to initiate an IL-10 response and the eosinophil-derived IL-10 are documented to unintentionally support parasitic survival while attempting to mitigate damages to muscle tissue (Huang et al., Reference Huang, Gebreselassie, Gagliardo, Ruyechan, Lee, Lee and Appleton2014). We speculate that although vast quantities of IL-10 have been produced, less eosinophil-derived IL-10 cytokines to promote survival of the larva should be evident due to reduced eosinophil levels by day 32, which may be further affected through increased IFN-γ concentrations in the RSV-Ts mice. Through heightened IFN-γ and IL-10 levels, our data confirm that pre-infection with RSV is beneficial for inhibiting T. spiralis infection.
Splenocyte CD4+ and CD8+ T-cell levels were elevated in RSV-Ts compared with T. spiralis control mice (Figs. 4B and C, 5B and C). The increased CD4+ and CD8+ T-cell populations in RSV-Ts mice compared with T. spiralis control mice explains for the enhanced Th1 and Th2 cytokine responses, hence the increased immune response against T. spiralis. Studies investigating the parasitic influence on T-cell proliferation and their activity have documented the depression of T-cell population p.i. with parasites. In Trichuris muris-infected mice, reduced CD4+ and CD8+ cell population was observed (Else and Grencis, Reference Else and Grencis1991). Inhibition of CD3, CD4 and CD8 surface markers via IL-2R suppression in Trypanosoma cruzi infection was also reported (Sztein et al., Reference Sztein, Cuna and Kierszenbaum1990). CD4+, CD8+ and CD19+ T lymphocytes were significantly reduced in response to Taenia crassiceps infection (Zepeda et al., Reference Zepeda, Solano, Copitin, Fernandez, Hernandez, Tato and Molinari2010). In this sense, it is highly plausible that T. spiralis infection may have suppressed the overall T-cell population in splenocytes just as in other parasitic infections, which are enhanced through previous infection with RSV. Since immune responses to T. spiralis infections are positively correlated with infection dose, we speculate that this can be accounted for reduced T-cell populations (de Vos et al., Reference de Vos, Danell and Dick1992; Franssen et al., Reference Franssen, Fonville, Takumi, Vallee, Grasset, Koedam, Wester, Boireau and van der Giessen2011). Correlations can be made as significantly less CD4+ and CD8+ spleen T-cell counts were observed on day 30 when mice were infected with only 10 larvae (Dvoroznakova et al., Reference Dvoroznakova, Hurnikova and Kolodziej-Sobocinska2011).
Our study resulted in the novel finding that antibodies generated against RSV successfully reacted against multiple proteins present in T. spiralis ES antigen, and these may have contributed to reduced worm burden in the diaphragm. Protein components of the T. spiralis ES antigen detected by RSV antibody indicates that these proteins share similar epitopes to that of RSV proteins. The viral antisera have detected T. spiralis ES antigenic proteins between sizes 45–60 kDa and 25–35 kDa (Fig. 6A). No proteins were detected from antigens when probed with naïve serum, indicating that non-specific binding was not the cause of this interaction. Contrary to the Western blot data, weak response from RSV control mice sera was observed against T. spiralis ES antigen (Fig. 2A–E). Evidently, despite the increase in IgG2a and 2b, no significant increase in IgG was observed from RSV control. We speculate that the underlying cause of this discrepancy arises from the fact that antibody used to detect T. spiralis ES antigen was from RSV-infected mice that has been challenged after 1 month, whereas RSV control used for the serum antibody response has only been infected once. In this sense, significantly increased antibody response against T. spiralis ES antigen can be expected from mice that has been challenged with RSV 1 month p.i. Few studies have reported the presence of shared epitopes and cross-reactivity between parasitic organisms and viruses. Polydnaviruses have been reported to possess shared epitopes in its structural proteins with the parasitoid Campoletis sonorensis venom gland and oviduct proteins (Webb and Summers, Reference Webb and Summers1990; Webb and Luckhart, Reference Webb and Luckhart1994). Antigenic cross-reactivity between human T-cell lymphotropic virus type I structural proteins and blood stage proteins of Plasmodium falciparum have also been documented (Lal et al., Reference Lal, Rudolph, Alpers, Sulzer, Shi and Lal1994; Porter et al., Reference Porter, Anthony, Solihin and Hayes1995). Parasite and viral antigen cross-reactivity has been well documented, especially through vaccine studies as parasitic antigens of Onchocerca volvulus are utilized as a vaccine component against infectious viruses such as influenza (Jiang et al., Reference Jiang, Fisher, Concannon, Lustigman, Shen and Murasko2016). Exemplified by the aforementioned studies, antibodies generated against RSV reacting to a helminthic parasite is highly plausible and these interactions can be utilized to bolster pathogen-specific immune responses within hosts.
Collectively, present study has demonstrated that introducing RSV and a small dose of T. spiralis larvae into mice results in strengthened immunological response against T. spiralis. Studies have already reported mixed Th1 and Th2 responses elicited upon T. spiralis infection. Although the exact identities of the T. spiralis ES antigen components detected by the RSV antibody remains elusive, more research needs to be conducted to understand which portion of the ES antigen RSV antiserum reacts to, which may serve to elucidate the underlying mechanism of T. spiralis resistance. Prospective studies investigating how a viral infection alters the outcome of a subsequent parasitic infection are necessary to broaden the knowledge pertaining to immunoregulatory responses involved in virus and parasite co-infection studies.
Author ORCIDs
Fu-Shi Quan http://orcid.org/0000-0001-8921-3333
Acknowledgements
The authors would like to express their gratitude to Dr. Eun-Kyung Moon for the fruitful discussions over the course of this study.
Financial support
This work was supported by grants from the National Research Foundation of Korea (NRF) (2018R1A2B6003535, 2018R1A6A1A03025124) and a grant from Cooperative Research Program for Agriculture Science & Technology Development (Project No. PJ01320501), Rural Development Administration, Republic of Korea.
Conflict of interest
None.
Ethical standards
All of the experimental procedures involving animals have been approved and conducted under the guidelines set out by Kyung Hee University IACUC.