Introduction
Sudden sensorineural hearing loss (SSNHL) constitutes a substantial proportion of otologic emergencies in otorhinolaryngology clinics. It typically occurs unilaterally and is classically defined as sensorineural hearing loss of at least 30 dB affecting three consecutive frequencies, developing within less than 72 hours. In most cases, the aetiological factor cannot be identified; therefore, it is also termed idiopathic sudden hearing loss. The proposed mechanisms in its pathogenesis include viral infections, vascular disorders, autoimmune diseases and trauma.Reference Chandrasekhar, Tsai Do, Schwartz, Bontempo, Faucett and Finestone1 Due to the unresolved nature of its pathogenesis, studies addressing SSNHL continue to attract considerable scientific interest. Several investigations suggested that SSNHL admissions may cluster at certain times of the year and that external factors such as seasonal variations may influence its occurrence.Reference Gerçeker, Ugur, Gokcan, Muderris and Tataragasi2–Reference Sonbay Yılmaz, Ensari and Gur12
During the coronavirus disease 2019 (Covid-19) pandemic, healthcare accessibility, patient behavior and admission dynamics changed markedly, which in turn affected SSNHL admissions. Furthermore, there are studies reporting a possible association between Covid-19 infection and the development of SSNHL.Reference Frosolini, Franz, Daloiso, de Filippis and Marioni13, Reference Meng, Wang, Sun and Zhu14 Audiogram types were also linked to both the aetiology and prognosis of SSNHL. Nevertheless, evidence regarding whether audiogram types are associated with admission timing or intra-annual distribution remains extremely limited.Reference Gerçeker, Ugur, Gokcan, Muderris and Tataragasi2, Reference Zhang, Ji, Ma, Yu and Jing15
In this retrospective study, the admission dates and audiogram types of patients presenting with SSNHL between 2015 and 2024 were analysed. The study investigated whether SSNHL admissions clustered during particular periods. Using seasonal-trend decomposition with locally estimated scatterplot smoothing (STL), the trends and seasonal components of the admissions were identified. The aims were to elucidate the temporal dynamics of SSNHL and to contribute to the prediction of admission peaks.
Materials and methods
This retrospective study was conducted at the Department of Otorhinolaryngology, Faculty of Medicine, Süleyman Demirel University, following approval from the Subcommittee of the Health Sciences Ethics Committee of Süleyman Demirel University Rectorate (approval number 14, dated 4 July 2025). Patient identities were kept confidential, and data were anonymised before analysis. The study was performed in accordance with the principles of the Declaration of Helsinki.
Data from patients who presented to the Otorhinolaryngology Clinic with SSNHL between 1 January 2015 and 31 December 2024 were analysed. These data were retrieved from the hospital’s digital archive system. Inclusion criteria were the absence of pathological physical examination findings that could explain SSNHL, absence of pathological radiological findings that could explain SSNHL, age over 18 years and complete accessibility of relevant data in the digital archive system. Exclusion criteria included history of acoustic trauma prior to SSNHL, history of otologic surgery, known history of neurotologic disease, use of ototoxic medications, an interval of more than 14 days between the onset of hearing loss and admission, recurrent SSNHL, bilateral SSNHL and history of physical trauma preceding SSNHL.
For patients meeting these criteria, data about age, sex, side of hearing loss, audiogram and admission date were evaluated. Admission dates were recorded in day/month/year format. Based on admission dates, data were also grouped by month, season and year. In Turkey, winter includes December, January and February; spring includes March, April and May; summer includes June, July and August; and autumn includes September, October and November. In addition, the years 2015, 2016, 2017, 2018 and 2019 were considered the pre–Covid-19 pandemic period; 2020 and 2021 the Covid-19 pandemic period; and 2022, 2023 and 2024 the post–Covid-19 pandemic period.
Audiograms were classified into four types, similar to the studies of Watanabe and Suzuki as well as Zhang et al.Reference Zhang, Ji, Ma, Yu and Jing15, Reference Watanabe and Suzuki16 In the flat type, all frequencies were affected at a similar level. In the profound type, there was total or near-total hearing loss across all frequencies. In the up-sloping type, low frequencies were predominantly affected, whereas in the down-sloping type, high frequencies were more severely impaired. Audiogram types could not be determined for the years 2015, 2016 and 2017, as the corresponding audiogram images were not available in the digital archive. To avoid data inaccuracies, admissions from these years were excluded from audiogram-based analyses. The presence of tinnitus and/or vestibular symptoms accompanying hearing loss was not objectively assessed and was not consistently documented in the records; therefore, these data were not analysed in this study.
Statistical analysis
Data analysis was performed using SPSS version 30 (IBM Corp., New York, USA) and the Python programming language in the Google Colab environment. Descriptive statistics were used to summarise demographic distributions, and admissions were analysed according to year, month and season. Results are presented as mean, standard deviation, percentage and minimum–maximum values. Differences between observed and expected distributions of admission frequencies by month, season, year and Covid-19 periods were evaluated using the chi-squared goodness-of-fit test. The relationship between audiogram types and admission periods was analysed with the Pearson chi-squared test. To explore time-series patterns, the STL method was applied to admission data, and the trend, seasonal and residual components were obtained. For visual representation of the analyses, heatmaps, time-series plots and distribution graphs were generated in the Python environment. A p-value of less than 0.05 was considered statistically significant.
Results and analysis
A total of 738 patients who met the inclusion criteria were enrolled in the study. Of these, 307 (41.6%) were female and 431 (58.4%) were male. The mean age of the patients was 45.74 (± 15.55) years. The mean age of female patients was 45.47 (± 15.81) years, while that of male patients was 45.93 (± 15.39) years. There was no statistically significant difference in age between the sexes (p = 0.691). Hearing loss occurred in the left ear in 378 patients (51.2%) and in the right ear in 360 patients (48.8%).
Analysis of SSNHL admissions by year revealed a statistically significant difference (χ2 = 29.805; p < 0.001). Specifically, admissions in 2019 were significantly higher than expected (z = 3.98; p < 0.001), whereas those in 2020 were significantly lower than expected (z = –2.65; p < 0.01) (Table 1).
Analysis of distribution of SSNHL admissions by year

SSNHL = sudden sensorineural hearing loss.
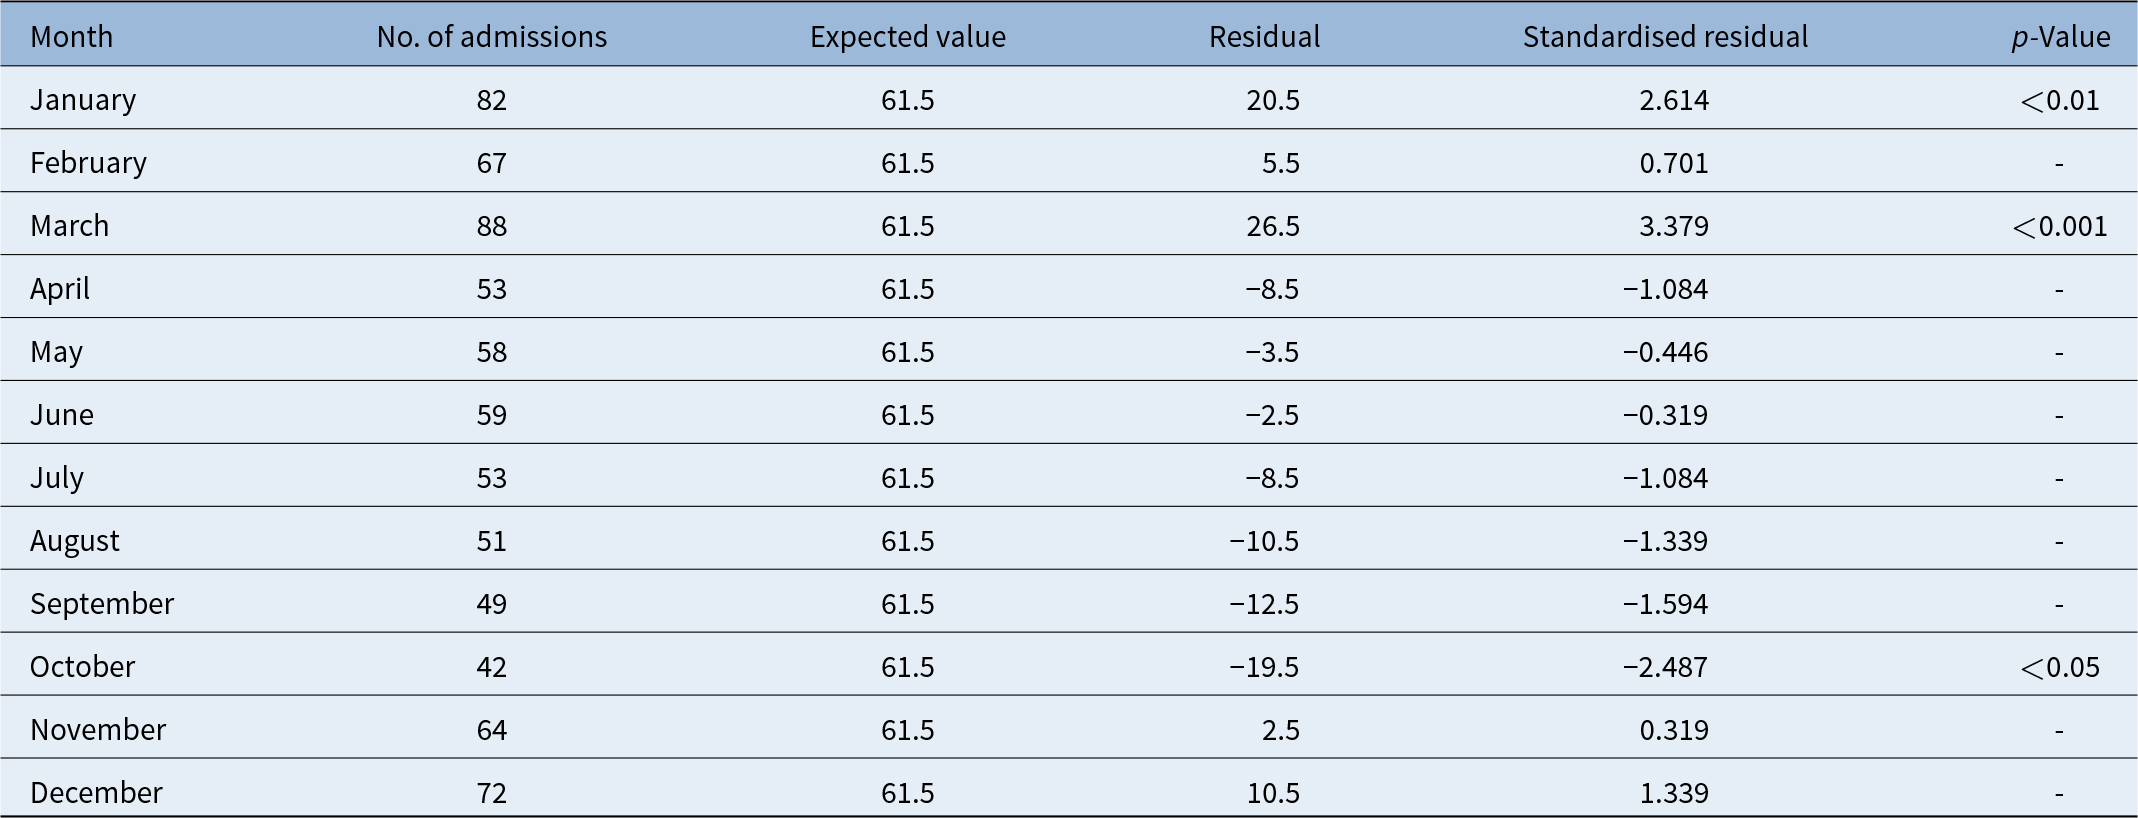
The intra-annual distribution by month of SSNHL cases also showed a statistically significant difference (χ2 = 33.805; p < 0.001). A significant increase in SSNHL admissions was observed in March (z = 3.38; p < 0.001). In addition, admissions were significantly higher than expected in January (z = 2.61; p < 0.01), while they were significantly lower in October (z = –2.49; p < 0.05). No significant differences were detected in the distribution of admissions during the other months (Table 2). Variations in monthly admission frequencies were also illustrated with a heatmap (Fig. 1).
Heatmap analysis of monthly variations in admission frequency.

Analysis of distribution of SSNHL admissions by month

SSNHL = sudden sensorineural hearing loss.
According to the results of the chi-squared goodness-of-fit test, a statistically significant difference was also observed in SSNHL admissions by season (χ2 = 15.583; p = 0.001). Specifically, admission numbers were significantly higher than expected in winter (z = 2.69; p < 0.01), while they were significantly lower in autumn (z = –2.17; p < 0.05). No significant differences were detected in spring or summer (Table 3; Fig. 2).
Heatmap analysis of seasonal variations in admission frequency.

Analysis of distribution of SSNHL admissions by season

SSNHL = sudden sensorineural hearing loss.
The temporal distribution of SSNHL cases by year and month was also analysed using exact admission dates in day/month/year format with the STL method. The STL plots illustrated distinct periodic variation patterns (Fig. 3). In the STL analysis applied to the time series, admission data were decomposed into three components and evaluated separately: trend, seasonal and residual components.
STL plots for SSNHL admission dates.

In the analyses conducted according to the Covid-19 pandemic, a total of 408 patients (55.3%) were identified in the pre-pandemic period, with an annual average of 81.6 patients. During the pandemic period, 125 patients (16.9%) were recorded, corresponding to an annual average of 62.5. In the post-pandemic period, 205 patients (27.8%) were observed, with an annual average of 68.33. In the year-based analysis of SSNHL admissions, the number of cases in 2020 was found to be significantly lower (p < 0.01). The annual averages of SSNHL admissions and their classification according to pandemic periods are presented in Figure 4.
Annual averages of SSNHL admissions and classification of years based on Covid-19 pandemic periods.

When audiogram types of 514 SSNHL cases between 2018 and 2024 are compared by year, the most common pattern was the flat type (n = 168; 32.7 per cent). This was followed by the up-sloping type (n = 136; 26.5 per cent), the down-sloping type (n = 127; 24.7 per cent) and the profound type (n = 83; 16.1 per cent). Although the distribution of audiogram types varied across years, the difference was not statistically significant according to the Pearson chi-squared test (χ2 = 18.470; p = 0.425). No specific audiogram type was found to predominate in any particular year.
In the study, a statistically significant association was found between months and the distribution of audiogram types in SSNHL admissions (χ2 = 56.442; p = 0.007). Standardised residuals were used to determine which audiogram types were observed more or less frequently than expected in each month. The analysis revealed that the down-sloping audiogram type was significantly less frequent than expected in March (adjusted standardized residual [ASR] = –2.00), whereas the profound type was significantly more frequent in the same month (ASR = +1.83). In May, the profound type was significantly less frequent (ASR = –2.32). In September, the profound audiogram type was significantly more frequent than expected (ASR = +2.03). In May and August, the frequency of the crossing horizontally or flat type showed a significant tendency to increase. The heatmap corresponding to this analysis is presented in Figure 5.
Heatmap of monthly frequencies of audiogram types.

No statistically significant difference was found in the distribution of audiogram types by season (χ2 = 13.086; p = 0.159). Similarly, there was no statistically significant difference in the distribution of audiogram types among SSNHL cases observed in the pre-pandemic, pandemic and post-pandemic periods (χ2 = 3.582; p = 0.733).
Discussion
In our retrospective analysis of 738 patients diagnosed with SSNHL over a 10-year period, the mean age at diagnosis was 45.75 years, with a male predominance of 58.4 per cent. The monthly distribution of SSNHL admissions demonstrated significant variations. Admissions were significantly higher in March and January, whereas they were lower in October. Seasonal analysis further revealed that the number of admissions was significantly higher in winter and lower in autumn.
The results were corroborated by a more comprehensive method—STL—applied with exact day/month/year data. The STL plots illustrated clear periodic patterns. The trend component indicated a slight decline in SSNHL admissions beginning in early 2015, which continued until 2019, followed by a transient peak in that year. A marked decrease was observed in 2020, after which admissions again showed an upwards trend. This increase is noteworthy, particularly in the context of the Covid-19 pandemic. By 2023, however, the number of admissions displayed a renewed tendency to decline. Such fluctuations suggest that admission frequency is influenced not only by seasonal factors but also by external determinants such as healthcare accessibility, public awareness and extraordinary circumstances like the pandemic.
In the seasonal component, distinct recurring patterns were observed throughout the year. According to the analysis, periods of increased admissions were concentrated between November and March. During this interval, the seasonal effect exceeded the mean number of admissions by approximately two to five cases. In contrast, between May and August, the seasonal effect was negative, with admission counts falling 1.5 to 2.5 cases below the overall average. These findings indicate that SSNHL admissions increase during winter and early spring, whereas they decrease during the summer months.
The seasonal component did not exhibit any marked upwards or downwards trends over time, but rather persisted with similar patterns across the study period, highlighting the systematic and stable nature of the seasonal effect. Examination of the residual component showed that most of the variability was explained by the trend and seasonal components, with residuals ranging within plus or minus 5. Notably, pronounced deviations were observed in some months around 2020, which may be attributed to abrupt changes in healthcare-seeking behavior during the Covid-19 pandemic. In other periods, the low variance of residuals confirmed that the STL model successfully explained the dataset. In conclusion, STL analysis demonstrated that SSNHL admissions are shaped not only by long-term trends but also by recurring seasonal influences specific to certain periods of the year.
The increase in admissions during the November–March period suggests that infectious or environmental factors may play roles in the pathogenesis of the disease. These observations highlight the importance of seasonal awareness in diagnosis and healthcare planning. Moreover, the STL analysis revealed that categorising data strictly by meteorological seasons may not be the most appropriate approach, as our findings demonstrated that the period with recurrent high SSNHL admissions was specifically between November and March.
Kim et al., in their population-based study analysing SSNHL patients diagnosed in South Korea between 2011 and 2015, reported that new SSNHL cases were most frequently diagnosed in October and least frequently in January. The authors suggested that the observed increase in autumn may be related to cold weather conditions.Reference Kim, Kim, Im, Kim, Song and Chae3 Oh et al. analysed 105 SSNHL patients and found that the highest monthly incidence occurred in March and April. They also demonstrated that the annual distribution of SSNHL correlated with seasonal parameters such as daily temperature, wind speed and fine dust concentration.Reference Oh, Choi and Cho4 Simani et al. investigated the seasonal variation of SSNHL admissions and conducted a comparative analysis of their data with the literature. Most studies in the literature indicate that SSNHL incidence peaks in spring and is lowest in winter. In their own series, incidence was also significantly lower in winter compared to other seasons.Reference Simani, Oron, Shapira, Handzel, Abu Eta and Warshavsky5 In their study of SSNHL admissions in Taiwan, Wu et al. analysed data from 9,267 patients diagnosed between 1998 and 2022 and reported the highest incidence in autumn.Reference Wu, Lin and Chao6 Gerçeker et al., in a Turkish study analysing 164 SSNHL patients between 2002 and 2006, found higher admission numbers in spring and autumn, with lowest numbers in winter. They also evaluated the severity of hearing loss and concluded that SSNHL cases occurring in winter were more severe.Reference Gerçeker, Ugur, Gokcan, Muderris and Tataragasi2 Durmuş et al. analysed 68 SSNHL patients admitted between 2015 and 2017 in Turkey and reported the highest number of cases in spring and the lowest in autumn.Reference Durmuş, Bora, Çam and Altuntaş7 Danielides et al. assessed 82 SSNHL patients over a five-year period in terms of seasonal distribution and meteorological parameters and found no significant association with either.Reference Danielides, Nousia, Bartzokas, Lolis, Kateri and Skevas8 Similarly, Deya et al. retrospectively analysed 97 patients over three years and concluded that SSNHL admissions did not differ significantly throughout the year.Reference Jourdy, Donatelli, Victor and Selesnick9 Tal et al. analysed 740 SSNHL patients admitted between 2004 and 2019 and found no significant seasonal relationship.Reference Tal, Ibrahim and Ronen10 Ryu et al., in South Korea, evaluated 318 patients admitted between 2005 and 2015 and also reported no seasonal association.Reference Ryu, Park, Park, Kim, Kim and Yeo11 Finally, Sonbay Yılmaz et al. in Turkey likewise found no significant relationship between seasonal distribution and SSNHL incidence.Reference Sonbay Yılmaz, Ensari and Gur12
As summarised above, many studies worldwide have examined the association between seasons and SSNHL. However, most of these studies included a relatively small number of patients. Moreover, local variations in seasonal conditions, differences in grouping during data analysis, and heterogeneity in patient characteristics may have contributed to the inconsistent findings. Compared with these studies, the strengths of our work are the use of STL analysis and the relatively large number of patients included.
In our study, the seasonal component derived from STL decomposition qualitatively resembled the fluctuations observed in the Ministry of Health’s influenza-like illness (ILI) surveillance and influenza positivity rates for the period 2018–2025. In Turkey, admissions to family physicians due to ILI typically show a marked increase each year between December and March, reaching their lowest levels during the summer months. Similarly, influenza positivity rates in Turkey consistently exhibit sharp peaks in winter, dropping close to zero during summer.17 The overlap between the SSNHL admission pattern observed in our study and these epidemiological trends suggests an ecological-level synchrony between ILI and SSNHL admissions. Possible mechanisms underlying this synchrony include viral neuritis directly involving the cochleovestibular nerve or spiral ganglion, microcirculatory impairment and thrombotic events in the stria vascularis through systemic inflammation and endothelial dysfunction and autoimmune inner ear injury triggered by host immune responses.Reference Chen, Fu and Zhang18–Reference Weng, Lin and Wang20 Reports in the literature describing increased SSNHL incidence during winter and clinical-serological evidence supporting the role of viral infections in its aetiology are consistent with these interpretations. In a review of 43 articles published in 2019, Chen et al. concluded that viruses may play a role in the pathogenesis of SSNHL in the majority of studies.Reference Chen, Fu and Zhang18 The viruses most frequently implicated include herpes simplex virus, hepatitis B virus, measles virus, rubella virus, mumps virus, Lassa virus, influenza virus and enteroviruses. In addition to the mechanisms described above, reactivation of latent viruses was also proposed as a potential cause of hearing loss.Reference Chen, Fu and Zhang18, Reference Weng, Lin and Wang20 Furthermore, inflammatory mediators such as tumour necrosis factor-alpha and interleukin-6, generated during systemic inflammation, were suggested to contribute to the development of hearing loss.Reference Chen, Fu and Zhang18, Reference Weng, Lin and Wang20
In contrast to this, in their study assessing the risk of SSNHL following acute respiratory tract infections, Weng et al. reported—unlike most prior studies—that the risk of SSNHL decreased after acute respiratory infection.Reference Weng, Lin and Wang20 Opposite to the findings of Weng et al., Lin et al., analysing the data of 1,131 patients, found that acute upper respiratory tract infections increased the risk of SSNHL, with the highest risk occurring within the first month after infection. Lin et al. emphasised that viral infection–induced endothelial damage may play a role in the association between acute upper respiratory tract infections and SSNHL.Reference Lin, Kuo and Wu19 Our interpretation of the relationship between the Ministry of Health’s ILI data and our findings is in line with the results of Lin et al. It should be noted that this interpretation does not claim direct causality. Other factors that may influence the intra-annual distribution of SSNHL admissions (such as ambient temperature, humidity, concurrent outbreaks and variability in healthcare accessibility) must also be considered. Moreover, our interpretation was based solely on qualitative comparison of publicly available graphs; the data were not used quantitatively, thus, the magnitude of the effect was not calculated within the scope of this study.
According to the results of our study, SSNHL admissions showed variability over the years. Specifically, the number of admissions in 2019 was significantly higher than expected, whereas in 2020 this number was significantly lower. Notably, there was a marked decline in admissions during certain months of 2020. This decrease is thought to be due to the extraordinary changes in healthcare delivery and hospital visits caused by the Covid-19 pandemic. Another indicator that the Covid-19 pandemic substantially affected SSNHL admissions is the variation in annual average case numbers across pre-pandemic, pandemic and post-pandemic periods. The mean annual number of patients was 81.6 in the pre-pandemic period, 62.5 during the pandemic period and 68.33 in the post-pandemic period. Although many studies suggested that Covid-19 may contribute to the development of SSNHL, the association and the exact mechanisms underlying hearing loss remain unclear.Reference Frosolini, Franz, Daloiso, de Filippis and Marioni13, Reference Meng, Wang, Sun and Zhu14 Therefore, it would be more appropriate to interpret the observed fluctuations in admission numbers in terms of differences in patient behaviour and healthcare delivery rather than as a direct effect of the Covid-19 virus itself.
In our study, analyses of audiogram types revealed no significant differences with respect to seasons or the Covid-19 pandemic period, whereas statistically significant associations were observed between months and audiogram type distribution. According to these results, the down-sloping audiogram type was significantly less frequent than expected in March, while the profound type was significantly more common in the same month. In May, the profound type was significantly less frequent, suggesting that such severe hearing loss was rare during that month. In September, the profound audiogram type was significantly more frequent than expected. The frequency of the crossing horizontally type showed a significant tendency to increase in May and August. These findings suggest that audiogram patterns are statistically associated with certain months and that seasonal or environmental factors may influence the clinical presentation of SSNHL. However, further studies are needed to support the clinical relevance and potential pathophysiological mechanisms underlying these differences.
There are only a limited number of studies in the literature that investigated audiogram types in SSNHL in this context. Zhang et al., in their study analysing 510 SSNHL patients between 2007 and 2018, categorised audiogram types in a similar way and, consistent with our results, found no association between seasons and audiogram types. However, the same study reported that daily temperature variation and relative humidity were associated with audiogram types. Daily temperature variation was linked to profound hearing loss, which was interpreted as vascular impairment leading to disruption of inner ear microcirculation and subsequent hearing loss. In the same study, high humidity was associated with the up-sloping audiogram type, which was interpreted as a potential cause of endolymphatic hydrops, similar to what is seen in Ménière’s disease.Reference Zhang, Ji, Ma, Yu and Jing15, Reference Schmidt, Sarran, Ronan, Barrett, Whinney and Fleming21 Gerçeker et al. concluded that profound hearing loss in SSNHL was associated with cold weather. They interpreted this as being due to the increased frequency of viral infections during colder periods and the rise in blood viscosity associated with cold exposure.Reference Gerçeker, Ugur, Gokcan, Muderris and Tataragasi2 In conclusion, in addition to monthly patterns, meteorological factors such as temperature variation and humidity may also influence audiogram types.
This study has several limitations that should be acknowledged. First, its retrospective and single-centre design may limit the generalisability of the findings. Although a relatively large cohort was analysed, the results may still reflect local characteristics influenced by region-specific meteorological and healthcare factors. Second, audiogram data for the years 2015–2017 were unavailable; thus, analyses of audiogram patterns excluded those cases. Third, tinnitus and vestibular symptoms were not systematically or objectively assessed, preventing evaluation of their potential associations with SSNHL. Fourth, the interpretation of ecological synchrony between SSNHL admissions and ILI trends was based on qualitative comparison of publicly available surveillance graphs, without quantitative integration of epidemiological data. Finally, unmeasured confounders—such as variations in healthcare accessibility, patient behavior, concurrent viral outbreaks and socioeconomic factors—may also have influenced admission frequencies and audiogram distributions. Future multicentre, prospective studies incorporating standardised clinical, audiological and epidemiological data are warranted to validate and expand upon these findings.
• Sudden sensorineural hearing loss (SSNHL) is an otologic emergency with unclear pathogenesis, and its temporal dynamics remain insufficiently understood
• In this study, SSNHL admissions show distinct intra-annual (seasonal) clustering, especially between November and March
• The temporal pattern of SSNHL admissions parallels national influenza-like illness trends, suggesting a possible association with viral infections
• Audiogram type distributions vary by month, indicating that seasonal and environmental factors may affect both the clinical severity and aetiology of SSNHL
• The study’s results may reflect local meteorological influences, and multicentre research is needed to confirm and generalise the findings
Conclusion
Our study demonstrated that SSNHL admissions display distinct intra-annual patterns, with consistent clustering across years, particularly between November and March. The parallelism between our findings and national ILI trends highlights a potential link between SSNHL and viral infections. Furthermore, the observed variation in audiogram types across months suggests that seasonal and environmental factors may influence both the clinical severity and underlying aetiological mechanisms of SSNHL. Nevertheless, as our findings may reflect local characteristics shaped by meteorological variables, further multicentre studies are required to validate these results and allow for broader generalisation.
Financial support
None.
Competing interests
None.
Acknowledgements
None.
Artificial intelligence and language assistance statement
Artificial intelligence tools were utilised during the data analysis phase for verifying Python codes developed in Google Colab and for providing grammatical support during the English translation process. No content or material related to the study design or manuscript content was generated using artificial intelligence tools. The manuscript was reviewed, edited and certified by native English-speaking professionals for language accuracy.